Page MenuHomePhabricator

Fully loaded time regression on 3G Barack Obama en.wiki
Closed, ResolvedPublic

Assigned To
Authored By
Jhernandez
Sep 11 2017, 9:30 AM
Referenced Files
F9873811: Screen Shot 2017-09-28 at 2.31.34 PM.png
Sep 28 2017, 12:32 PM
F9789061: Screen Shot 2017-09-25 at 6.19.34 AM.png
Sep 25 2017, 4:23 AM
F9788223: Screen Shot 2017-09-25 at 5.42.57 AM.png
Sep 25 2017, 4:05 AM
F9788634: Screen Shot 2017-09-25 at 5.57.33 AM.png
Sep 25 2017, 4:05 AM
F9788142: howto.png
Sep 25 2017, 4:05 AM
F9788256: open.png
Sep 25 2017, 4:05 AM
F9788191: hepp.png
Sep 25 2017, 4:05 AM

Description

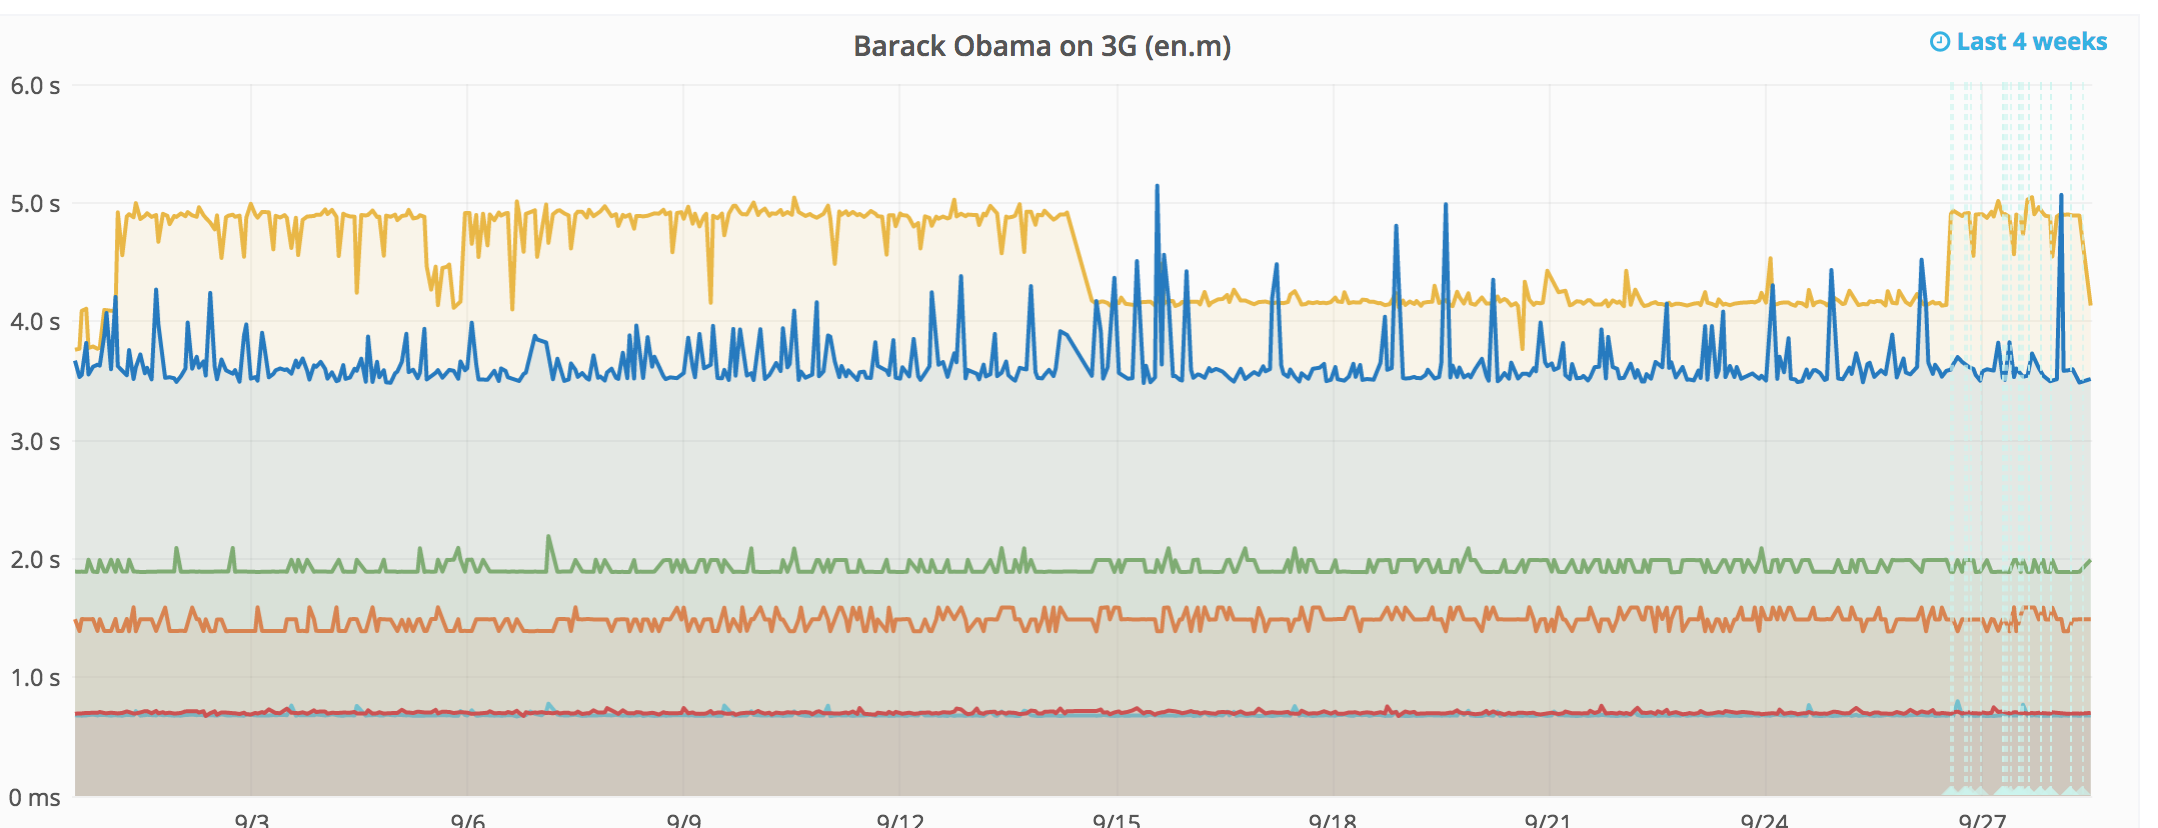
As of approximately 3am UTC, 1st of September, the fully loaded time for Barack Obama on enwiki using 3G slowed down 25% (from 4s to 5s)

  • Dashboard graph
    • Beta cluster doesn't exhibit the same behavior
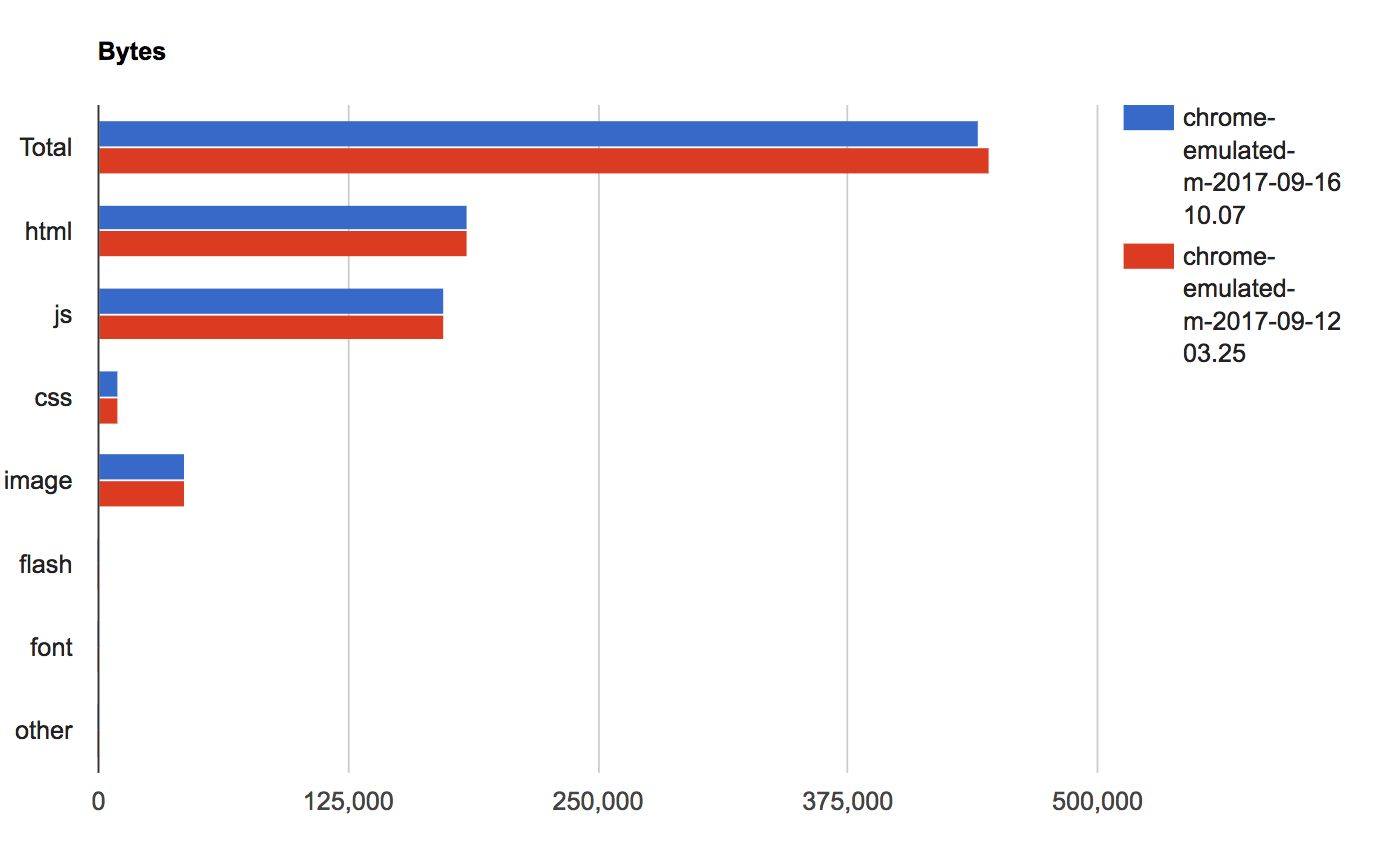
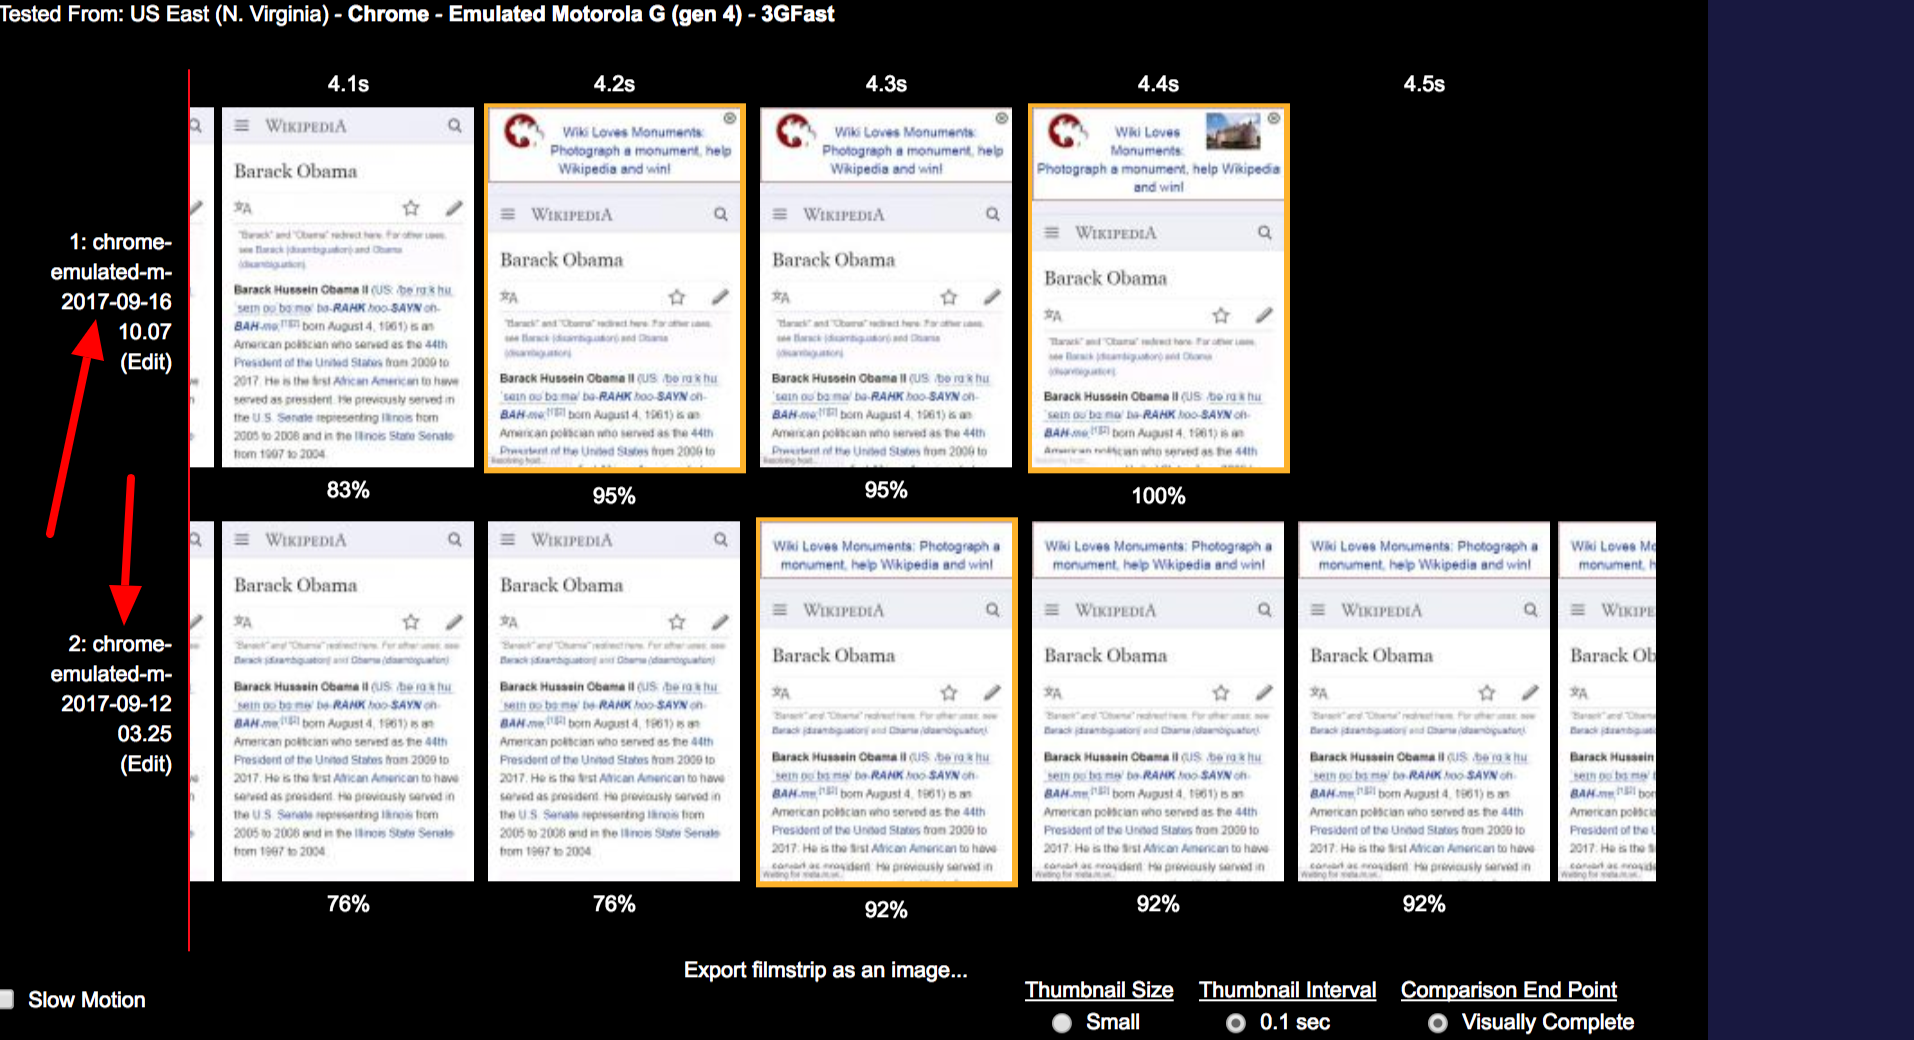
  • The content doesn't seem to have change substantially: diff

Is the slowdown caused by deployed software, or something else?

Event Timeline

Peter claimed this task.
Peter subscribed.

@Jhernandez it's because of the banner, check the screenshots http://wpt.wmftest.org/video/compare.php?tests=170912_KZ_6J,170829_Y5_R5 (comparing before September and current).

Hi @Peter, sorry to bother you. On September 14th, the increased fully-loaded time dropped to a half second (instead of a full second). However, the banner is still running. Would it be possible to run these tests again?

Hi @Niedzielski let me look into that, sorry I missed your response.

I always try to check the server admin log, there's two syncs that happened between we had the big change:

https://wikitech.wikimedia.org/wiki/Server_Admin_Log

2017-09-14

13:31 dcausse@tin: Synchronized wmf-config/InitialiseSettings.php: Setup Cirrus MLR models for top 20 language AB test (duration: 00m 50s)
11:14 jynus@tin: Synchronized wmf-config/db-eqiad.php: Remove all references to db1049, pool db1100 (duration: 00m 49s)

They don't look that they can cause something like that. So I would look more into the metrics. The metrics is from our continuous tests. So for the metrics what you see in Grafana, we also store the full result of the tests: http://wpt.wmftest.org/testlog/1/ - everyone can access that, the only problem is the GUI isn't optimal.

I would do like this:

  1. Check in Grafana and take two timestamp where I know have the diff in fully loaded- 17-09-13 vs 17-09-16
  2. Go to http://wpt.wmftest.org/testlog/1/ and try to find the runs. This is the step where you need to how to, checkout:

howto.png (972×2 px, 288 KB)

  1. Choose "Shot tests from all users"
  2. Choose "Do not limit the numbers if results 2b (missed that in the image) Choose a time interval, I've changed it to 30 days back
  3. You can write something in the search field, in this case I just used Obama to filter out some tests.
  4. Click "Update List" and wait ...

Then find the runs for https://en.m.wikipedia.org/wiki/Barack_Obama on the different dates, choose them and click compare.

These are ok I think: http://wpt.wmftest.org/video/compare.php?tests=170916_DR_A1,170912_HT_2Y

Then make sure to choose the interval 0.1 then it's easier to see the big different in the screenshots:

hepp.png (1×1 px, 706 KB)

You are perfectly right the monuments are still running.

Then best case you can find some difference in the graphs. The fullyLoaded happens earlier as you said. Another diff is the overall size, it differs almost 6kb:

Screen Shot 2017-09-25 at 5.42.57 AM.png (852×1 px, 82 KB)

But almost no change in HTML/CSS/JS/images so then you need to compare both runs more indeep to see the diff. I do that by clicking on the link and open them in new tabs:

open.png (1×1 px, 791 KB)

So that's how I usually do it but .... in this case when I looked at the graphs, it seems like the tests wasn't running for a couple of hours, seems like some kind of problems. We don't have a log of changes for WebPageTests except the commit log (https://github.com/WPO-Foundation/webpagetest/commits/master) they are automatically pushed at the moment (kind of bad). I looked there and no change that should mean anything to us.

The last resort, the perf channel on IRC:

Screen Shot 2017-09-25 at 5.57.33 AM.png (410×1 px, 148 KB)

The magic words there are "killed and redeployed the windows agents", I always writes there if I do any changes to the WebPageTest agent. So I think is bug in the Windows agent in WPT, we've seen this on other metrics before that after a restart TTFB for example comes back to normal :(

I'll look some more and report it upstream.

I have my own instance running sitespeed.io that I keep to make sure I can map WPT errors/changes it runs for 3g but on Digital Ocean (so the metrics are not as stable as on AWS but we can use it to see trends) and there is no change at the same time, so I'm pretty sure it is a problem with WebPageTest:

Screen Shot 2017-09-25 at 6.19.34 AM.png (1×2 px, 354 KB)

Thank you for the super-detailed notes, @Peter! (I'll share these with the team!) The results look very similar on the dates I picked too.

@Peter, it's back up another half second on September 26th at 12:00 :]

13:25 hashar@tin: Synchronized wmf-config/filebackend.php: Expose Thumbor swift username - T144479 (duration: 00m 44s)
13:24 hashar@tin: Synchronized wmf-config/CommonSettings.php: Enable asia-specific Navigation Timing metric - T169522 (duration: 00m 47s)
13:22 godog: upgrade grafana to 4.5.2 on labmon1001 - T175980
13:15 hashar@tin: Synchronized wmf-config/CommonSettings.php: Disable RelatedArticles instrumentation on all wikis - T174944 (duration: 00m 45s)
13:02 marostegui: Drop redundant indexes from s6 - T174509
13:00 elukey: add mw132[7,8] to live traffic (new appservers) - weights will be increased incrementally from 5 to 20
12:44 gehel: restarting blazegraph on wdqs1004 / wdqs2001 for heap resive - T175919
12:27 marostegui: Drop redundant indexes from s2 - T174509
12:12 marostegui: Drop redundant indexes from enwiki on eqiad - T174509
12:03 kartik@tin: Finished deploy [cxserver/deploy@aa232ee]: Update cxserver, registry reconstruction (duration: 03m 03s)
12:00 kartik@tin: Started deploy [cxserver/deploy@aa232ee]: Update cxserver, registry reconstruction
11:58 moritzm: uploaded prometheus-apache-exporter 0.3-1+deb9u1 to apt.wikimedia.org/stretch-wikimedia
11:57 marostegui: Drop redundant indexes from enwiki on codfw - T174509
11:49 moritzm: uploaded prometheus-hhvm-exporter 0.3.1+deb9u1 to apt.wikimedia.org/stretch-wikimedia
11:30 kartik@tin: (no justification provided)
11:29 kartik@tin: Finished deploy [cxserver/deploy@f1d4851]: Update cxserver, registry reconstruction (duration: 00m 52s)
11:28 kartik@tin: Started deploy [cxserver/deploy@f1d4851]: Update cxserver, registry reconstruction

  • I joined #wikimedia-perf today but I don't have the channel history to check for "killed and redeployed the windows agents".

I'll restart the agent now and see if it comes down.

The sad news is that the restart made the metric come down:

Screen Shot 2017-09-28 at 2.31.34 PM.png (828×2 px, 384 KB)

Thanks for checking and the follow-up, @Peter! I'll be more mindful of comparing the sitespeed.io results in the future before raising the alarm.