Page MenuHomePhabricator

User-perceived page load performance study
Closed, ResolvedPublic

Description

Research page: https://meta.wikimedia.org/wiki/Research:Study_of_performance_perception

Introduction

The current metrics we use to measure page load performance are based on assumptions about what users prefer. Even the assumption that faster is always better is universal in the metrics used in this field, while academic research shows that this might not be a universal main criterion to assess the quality of experience (performance stability might be preferred) and is likely to depend on the subject and the context.

We usually deal with two classes of metrics, real user metrics (RUM) that we collect passively from users, leveraging the performance information that we can capture client-side. It's usually very low level, highly granular and quite disconnected from the experience from the user's perspective. The other type of metric we use is synthetic, where we have automated tools simulate the user experience and measure things. These get closer to the user experience, by allowing us to measure visual characteristics of a page load. But both are far from capturing what the page feels like to users, because when the measurement is made, they don't require any human input. Even their modeling is often just a best guess by engineers, and only recently have studies looked at the correlation between those metrics and user sentiment. It wasn't part of the metrics' design.

In this study, we would like to bridge the gap between user sentiment and the passive RUM performance metrics that are easy to collect unobtrusively.

Collecting user-perceived page load performance

A lot of studies put users' nose in the mechanics of the page load to ask them about it. For example, showing them 2 videos side by side of the same page loading differently. This is a very artificial exercise and disconnected from the real-world experience of loading a page in the middle of a user flow. In this study we want to avoid interfering with the page load experience. Which is why we plan to ask the real users, on the production wikis, about their experience after a real page load has finished, in the middle of their browsing session. After a random wiki page load has happened, the user viewing it is asked via an in-page popup to score how fast or pleasant that page load was.

Users will have an option to opt out of this surveying permanently (preference stored in local storage). It might be interesting to give them different options to dismiss it (eg. "I don't want to participate", "I don't understand the question") in order to tweak the UI if necessary.

Collecting RUM metrics alongside

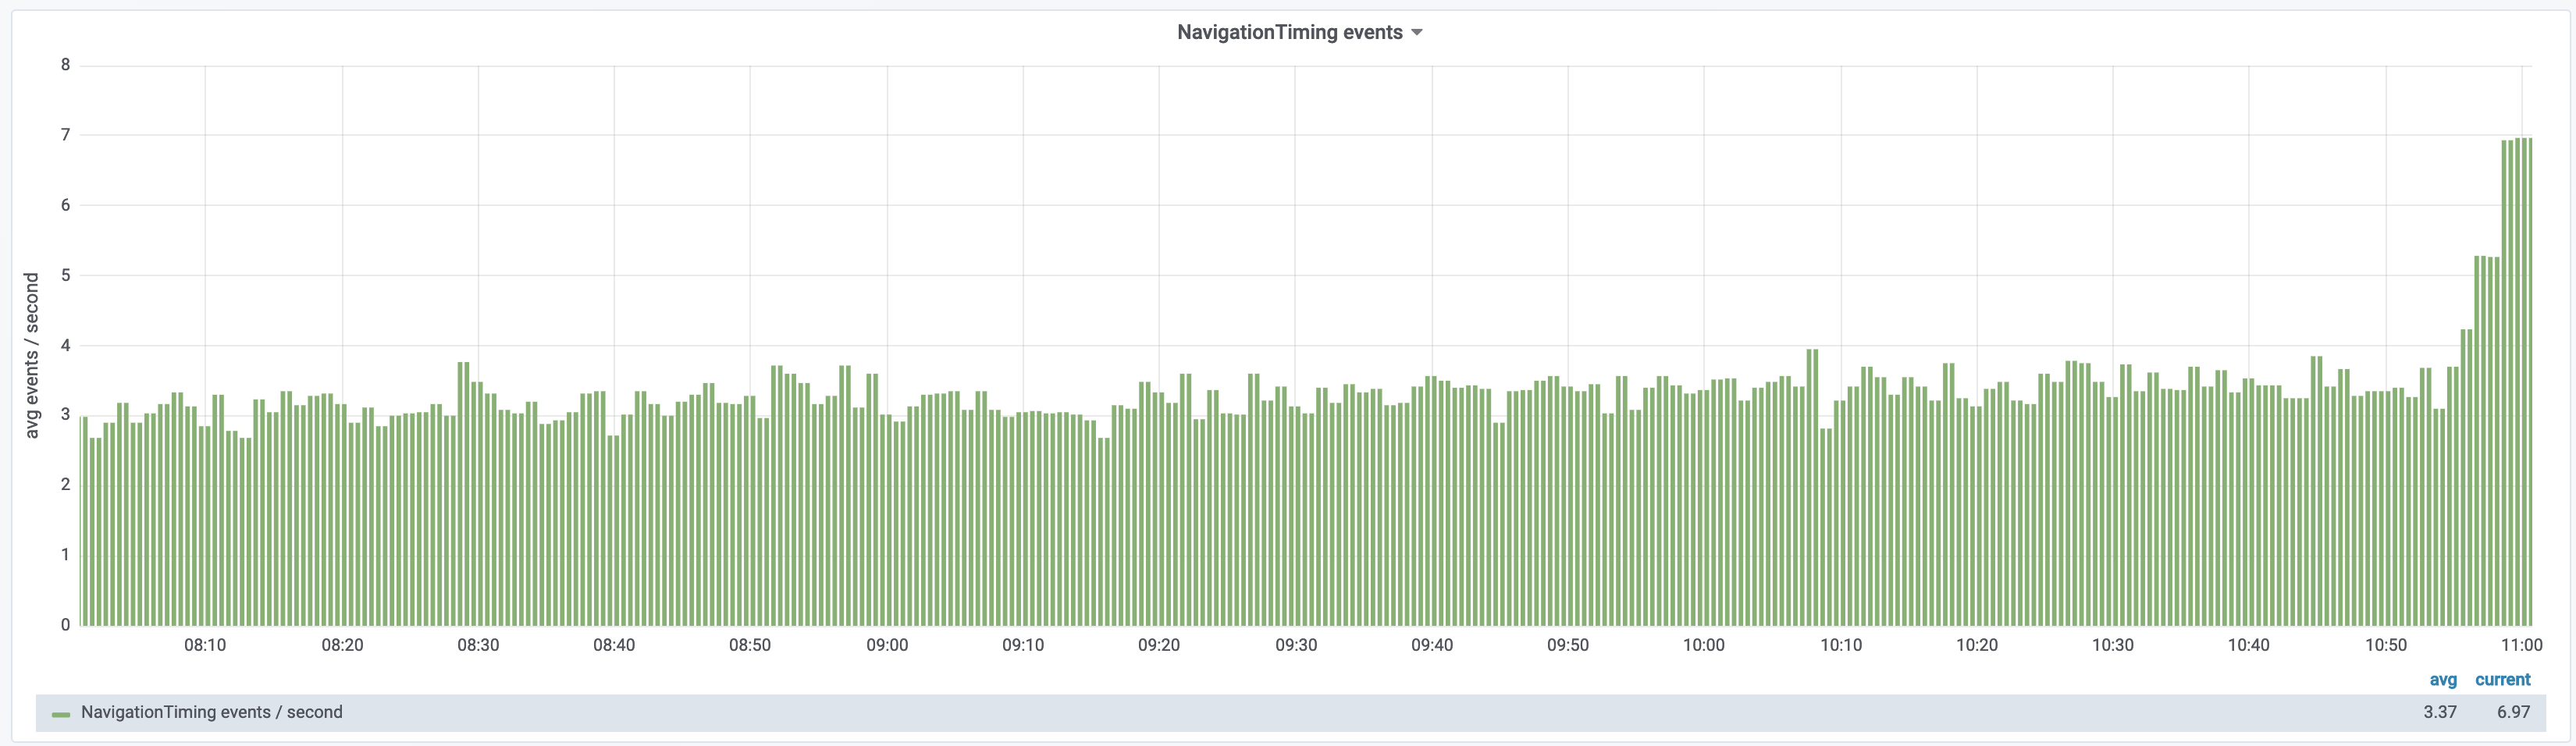
This is very straightforward, as we already collect such metrics. These need to be bundled with the survey response, in order to later look for correlations. In addition to performance metrics, we should bundle anonymized information about things that could be relevant to performance (user agent, device, connection type, location, page type, etc.). Most of this information is already being collected by the NavigationTiming extension and we could simply build the study on top of that.

Attempting to build a model that lets us derive user-perceived performance scores from RUM data only

Once we have user-perceived performance scores and RUM data attached to it, we will attempt to build a model that reproduces user-perception scores based on the underlying RUM metrics.

We can try building a universal model at first, applying to all users and all pages on the wiki. And then attempt to build context-specific models (by wiki, page type, connection type, user agent, location, etc.) to see if we could get better correlation.

Ideally, given the large amount of RUM data we can collect (we could actually collect more than we currently do), we would be trying the most exhaustive set of features possible. We should try both expert models and machine learning, as prior work has shown that they can both give satisfying results in similar contexts.

Scope

While it would be nice to have the user-perceived performance scores collected on all wikis, some have communities that are less likely to welcome such experiments by the WMF. We could focus the initial study on wikis that are usually more friendly to cutting-edge features, such as frwiki or cawiki. Doing at least 2 wikis would be good, in order to see if the same model could work for different wikis, or if we're already finding significant differences between wikis.

This study will focus only on the desktop website. It can easily be extended to the mobile site or even the mobile apps later, but for the sake of validating the idea, focusing on a single platform should be enough. There is no point making the study multi-platform if we don't get the results we hope for on a single one.

Challenges

  • Picking when to ask. How soon in the page load lifecycle is too soon to ask? (the user might not consider the page load to be finished yet) How late is too late? (the user might have forgotten how the page load felt)
  • Does the survey pop-up interfere with the page load perception itself? We have to display a piece of UI on screen to ask the question, and it's part of the page. We need to try to limit the effect that this measurement has as much as possible. This should be one of the main criteria in the design, that this survey UI's appearance doesn't feel like it's part of the initial page load.
  • How should the question be asked? Phrasing matters. If we ask a question too broad (eg. are you having a pleasant experience?) people might answer thinking about a broader context, like their entire browsing session, the contents of the page, or whether or not they found what they wanted to find on the wiki. If the question is too narrow, it might make them think too much about page loading mechanics they normally don't think about.
  • What grading system should we use? There are a number of psychological effects at play when picking a score for something, and we should be careful to pick the model that's the most appropriate for this task.

Limitations

This study won't look at performance stability. For example, if the page loads before the one being surveyed were unusually fast or slow, this will likely affect the perception of the current one. We could explore that topic more easily in a follow-up study if we identify meaningful RUM metrics in this initial study limited to page load studies in isolation.

Expected outcomes

  • We don't find any satisfying correlation between any RUM-based model, even sliced by page type/wiki/user profile. This informs us, and the greater performance community, that RUM metrics are a poor measurement of user-perceived performance. It would be a driving factor to implement new browser APIs that measure performance metrics closer to what users really experience. And in the short term it would put a bigger emphasis on synthetic metrics as a better reference for user-perceived performance (as there has been academic work showing a decent correlation there already). It could also drive work into improving synthetic metrics further. Also, from an operational perspective, if we keep the surveys running indefinitely, we would still get to measure user-perceived performance globally as a metric we can follow directly. It will be harder to make it actionable, but we would know globally if user sentiment is getting better or worse over time and slice it by different criteria.
  • We find a satisfying RUM-based universal model. Depending on its characteristics, we can assess whether or not it's a wiki-specific one, or if we potentially uncovered a universal understanding, that could be verified in follow-up studies done by others on other websites.
  • We find a satisfying RUM-based model adapted to some context. This would change the way performance optimization is done, by showing that context matters, meaning that improving performance might not take the form of a one-size-fits-all solution.

In the last 2 cases, this would allow us to have a universal performance metric that we can easily measure passively at scale and that we know is a good representation of user perception. This would be a small revolution in the performance field, where currently the user experience and the passive measurements are completely disconnected.


See also

The following url shows the survey unconditionally (Note: submissions are real!)

https://ca.wikipedia.org/wiki/Plantes?quicksurvey=internal-survey-perceived-performance-survey

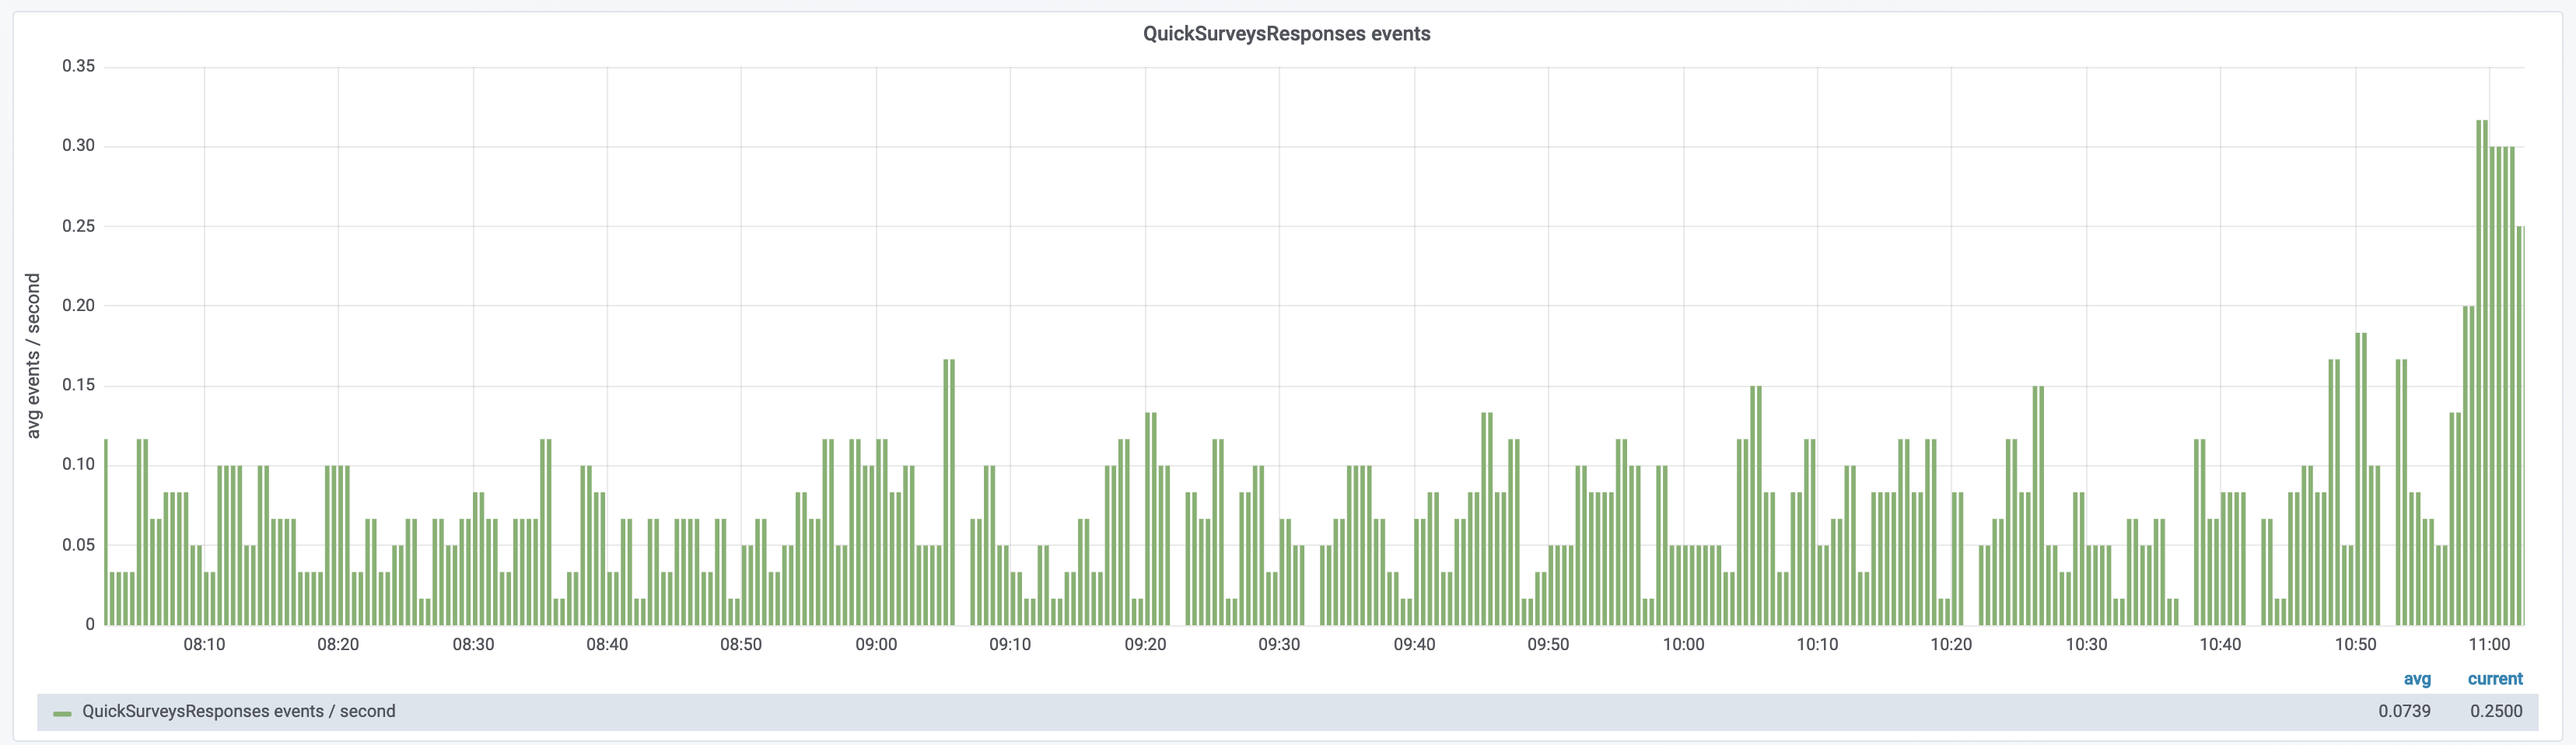
The following dashboard shows ingestion of responses (Note: This can include other surveys in the future, although as of writing, no other ones are enabled).

https://grafana.wikimedia.org/dashboard/db/eventlogging-schema?var-schema=QuickSurveysResponses

Details

SubjectRepoBranchLines +/-
performance/navtimingmaster+20 -0
analytics/refinerymaster+5 -0
analytics/refinerymaster+35 -0
mediawiki/extensions/NavigationTimingmaster+6 -1
mediawiki/extensions/NavigationTimingwmf/1.33.0-wmf.19+6 -1
operations/mediawiki-configmaster+15 -3
operations/mediawiki-configmaster+3 -0
mediawiki/extensions/NavigationTimingmaster+20 -3
operations/mediawiki-configmaster+0 -1
operations/mediawiki-configmaster+2 -12
operations/mediawiki-configmaster+13 -1
operations/mediawiki-configmaster+1 -1
analytics/refinerymaster+41 -0
operations/puppetproduction+1 -0
operations/mediawiki-configmaster+4 -1
operations/mediawiki-configmaster+4 -2
operations/mediawiki-configmaster+14 -0
mediawiki/extensions/NavigationTimingmaster+58 -8
operations/mediawiki-configmaster+1 -1
operations/mediawiki-configmaster+23 -1
mediawiki/extensions/NavigationTimingmaster+2 -1
mediawiki/extensions/WikimediaMessagesmaster+12 -4
mediawiki/vagrantmaster+26 -1
mediawiki/extensions/QuickSurveysmaster+13 -13
mediawiki/coremaster+24 -2
Show related patches Customize query in gerrit

Related Objects

StatusSubtypeAssignedTask
Resolved Gilles
Declined Gilles
Resolved Gilles
Resolved Whatamidoing-WMF
Resolved Gilles
Declined Gilles
Resolved Gilles
Resolved Gilles
Resolved Gilles
Resolved Gilles
Resolved Gilles
Declined Gilles
Invalid Gilles
Resolved Gilles
Resolved Gilles
DeclinedNone
Resolved Gilles
Resolved Gilles
Resolved Whatamidoing-WMF
ResolvedSlaporte
Declined Gilles
Declined Gilles
Declined Gilles
Resolved Gilles

Event Timeline

There are a very large number of changes, so older changes are hidden. Show Older Changes

Regarding July 5th, I looked into it and I don't see a survey responses spike in Hive:

SELECT COUNT(DISTINCT(event.surveyinstancetoken)), COUNT(*) FROM event.quicksurveysresponses WHERE year = 2018 AND month = 7 AND day > 1 AND day < 8 GROUP BY day;
421428
409418
376384
390403
388399
433446

It's possible that what's seen in Grafana is a bug/overcounting in Graphite, which is a different datastore used to back these graphs. Hive is the canonical data store.

I forgot one very important detail about the survey impression: it's only recorded once the user has the survey in their viewport. Which explains why we have some that take minutes. It's simply that people initially scrolled past the survey before it appeared, then scrolled back to the top of the article after doing some reading.

We actually *don't* measure the amount of time it takes to download the survey assets and insert the survey into the page, which in the case of impressions that take minutes, happened way before quicksurveyimpression's performancenow.

Now, the figures I was seeing make a lot more sense. For page loads that take <1s, it's extremely unlikely that the survey isn't already inserted if users see it after 5s. It just means that they scrolled down and went back to the top of the page.

Let's break this down into buckets to see if there is a progressive drop off satisfaction rates. For page loads taking less than 1s, with s being the survey impression time in seconds:

s < 1 1 <= s < 33 <= s < 66 <= s < 10s10 <= s < 2020 <= s < 3030 <= s < 4040 <= s < 120
95.25%92.56%92.59%94.44%91.68%89.65%87.76%94.5%

Query used:

SELECT q2.event.surveyResponseValue, COUNT(*) AS count FROM event.quicksurveyinitiation AS q INNER JOIN event.navigationtiming n ON q.event.surveyInstanceToken = n.event.stickyRandomSessionId INNER join event.quicksurveysresponses q2 ON q.event.surveyInstanceToken = q2.event.surveyInstanceToken WHERE n.year = 2018 AND q.year = 2018 AND q2.year = 2018 AND q.event.surveyCodeName = "perceived-performance-survey" AND q.event.performanceNow IS NOT NULL AND n.event.loadEventEnd IS NOT NULL AND q2.event.surveyResponseValue IS NOT NULL AND n.event.loadEventEnd < 1000 AND q.event.performanceNow - n.event.loadEventEnd >= 30000 AND q.event.performanceNow - n.event.loadEventEnd < 40000 GROUP BY q2.event.surveyResponseValue;

I think this shows that as time goes by after the page load, people's memory of it becomes less reliable. This probably calls for filtering out late survey responses from the study. Anything beyond 10 seconds is probably too unreliable to be considered.

I added new features to my random forest model, namely the top image resource timing and the survey appearance time (full list of features in the view I created). I also filtered out all survey responses where the survey appeared more than 10 seconds after the pageload. Lo and behold:

precisionrecallf1-scoresupport
-10.750.810.781312
10.790.730.761288
avg / total0.770.770.772600

Same thing, with the randomness pinned to a specific seed:

    precision    recall  f1-score   support

-1       0.75      0.81      0.78      1247
 1       0.81      0.75      0.78      1353

 avg / total       0.78      0.78      0.78      2600

And now, looking at feature importance for that model:

page_mediawikiloadend0.05972091225258912
page_dominteractive0.05555291638900518
page_domcomplete0.05029047286517806
page_loadeventend0.048274963237053846
page_loadeventstart0.046181668409670085
ip0.046109392740830896
survey_viewtime0.04488665276254195
page_responsestart0.04440687952739068
topimage_responseend0.04077331115712293
recvfrom0.029823405874552695
browsermajor0.029482259852426335
topimage_responsestart0.028736209656332376
topimage_starttime0.028290985156393226
page_transfersize0.028204055030698078
page_firstpaint0.028037362514820707
page_requeststart0.027769567173480763
topimage_fetchstart0.02661139926653559
page_connectend0.025833714670749037
page_rumspeedindex0.02462637982425334
country0.02395627074244878
devicefamily0.02183131546802089
page_secureconnectionstart0.02088374156242488
page_connectstart0.019940496531770834
osmajor0.019530654385698672
topimage_requeststart0.018620757009868052
topimage_connectstart0.01849116651369536
topimage_domainlookupstart0.015145333820839442
page_fetchstart0.014936654879505382
topimage_connectend0.013892746408479624
browserfamily0.012989476946930726
osminor0.012813699149677529
topimage_domainlookupend0.012744622802096366
topimage_encodedbodysize0.009540190724377883
browserminor0.009194449645718927
topimage_transfersize0.007657837205586284
osfamily0.006915917271512656
topimage_decodedbodysize0.006408494747900259
wiki0.006123717189758629
effectiveconnectiontype0.004893297204520509
topimage_secureconnectionstart0.00369666570159363
user_editcountbucket0.0027404407734646537
page_redirecting0.002609271324344027
page_responseend0.0008302736281410966
topimage_workerstart0.0
topimage_redirectend0.0

It's interesting to see the prevalence of some of the top image metrics, when those have only been collected since September 18th (and thus are missing from a large portion of the records used in this analysis!). I'll look into re-doing the same model using only data from September 18 onwards. It might also be interesting to model against only articles that have a top image.

I'll also remove the survey view time, which is not something we'll have on NavigationTiming data outside of the survey.

Re-running the same analysis only with data more recent than when ResourceTiming was deployed (2018-09-18T19:40:06Z), and removing survey display time as a feature:

precisionrecallf1-scoresupport
-10.850.730.78336
10.710.830.76264
avg / total0.790.780.78600

Not a big difference compared to before. The top features are the same in a slightly different order, the top image ones are not more prominent than before.

Finally, looking only at entries that have top image data reduces the dataset too much, yielding worse results. We'll have to wait until we've collected more data to re-run that one.

Very sadly while in the process of trying to make the same code run on Python 3 I updated sklearn, without keeping track of which old version I was using before, and now I can't get results that are as good as earlier this week. This is what I get now, over the whole dataset, minus surveys that take > 10s to be viewed:

precisionrecallf1-scoresupport
-10.660.840.741292
10.800.600.691386
avg / total0.730.720.712678

And that's with the Python 2 version of my code.

For Python 3 I run into problems with fit_transform that force me to map some columns manually to numerical values, which in turn turns into worse results than with Python 2. It might be interesting to compare how the values get transformed by the Python 2 library. Differences in the default strategy for that might explain how different the results have been.

It could also have been a fluke with the snapshot of data used the other day and with new negative responses recorded the old model might have worked less effectively.

I noticed, though, that in my undersampling experiments I wasn't always using the same amount of positive responses relative to negative responses. Which made me wonder what would happen if I undersampled the positive responses even more? Essentially using class imbalance in our favor, because we care more about capturing the negative responses than we do about capturing the positive ones. And that seems to be what has the biggest impact. This is slightly overdoing it, but clearly shows the effect:

precisionrecallf1-scoresupport
-10.780.920.841306
10.780.500.61703
avg / total0.780.780.762009

And toning it down a little:

precisionrecallf1-scoresupport
-10.670.890.761317
10.770.470.581094
avg / total0.710.700.682411

By adding the time to the features, in the form of unix timestamp, hour, minute, seconds, day of the week, as well as the ISP's ASN (which I don't think actually contributes much to the improvement) I'm back into excellent results:

precisionrecallf1-scoresupport
-10.770.840.801323
10.830.770.801393
avg / total0.800.800.802716

This probably works without accounting for users timezones because the target wikis (fr, ca, ru) all have traffic heavily centered around continental Europe. To do this even better, we would need to collect the client-side timezone in NavigationTiming and apply it to the timestamps recorded by EventLogging.

And if we leave out the top image metrics, because they've only been recording since mid-September, we get these results:

precisionrecallf1-scoresupport
-10.730.890.801323
10.870.690.771393
avg / total0.800.790.792716

Still pretty great!

Now, it's quite noteworthy that the most prominent feature, by far, is the unix timestamp:

unifiedperformancesurvey.ts 0.12601567188
unifiedperformancesurvey.page_loadeventstart 0.0552107967697
unifiedperformancesurvey.page_mediawikiloadend 0.0542528347965
unifiedperformancesurvey.page_dominteractive 0.0499585312226
unifiedperformancesurvey.page_domcomplete 0.0452909574817
unifiedperformancesurvey.page_loadeventend 0.0439757009884
unifiedperformancesurvey.ip 0.0428143759841
unifiedperformancesurvey.asn 0.0421671778307
unifiedperformancesurvey.minute 0.0407356065918

Which, might look surprising at first, when you consider that the random forest tree will have branches with rules like "if that value is greater than, then do go branch A, otherwise go to branch B". Given how the training and validation work, the fact that the model can predict things during the timespan of recorded data doesn't mean that it will be able to infer things correctly from the timestamps of future times. It's interesting nonetheless, because it might indicate that having the timestamp is necessary to account for seasonality, or changes in the environment (eg. performance improvement/regression). If we had a year's worth of data, we could try adding month and day of the month as features.

To close on these great results, let's try one last time without the top image metrics and without the timestamp (but keeping hour, minute, seconds, weekday):

precisionrecallf1-scoresupport
-10.720.850.781323
10.830.680.751393
avg / total0.770.760.762716

Not bad at all :)

The prominence of timestamp makes a ton of sense to me. Depending on the time of day, users are either almost certainly hitting ESAMS (which will have a hot cache for all of the test wikis), or hitting a different data center (in which case they're much less likely to have a hot cache for frwiki and the like). I wouldn't be surprised if hour was the most meaningful factor out of (month, day, hour, minute).

Without using the timestamp in my latest model it's actually backwards in terms of importance, but they're in the same range, some of the ordering is just coming from the randomness of the random forest algorithm. I wouldn't read too much into the order of the feature importance when the values are in the same range:

unifiedperformancesurvey.seconds 0.0490926217513
unifiedperformancesurvey.minute 0.0467801232989
unifiedperformancesurvey.hour 0.0394378997918

Timestamp really stands out when it's in the mix, though, in all the models I've been running since the beginning it's the highest importance value I've seen, by far. It's almost twice the value of the second best.

I think that to verify that the model incorporating the timestamp really works, I need to set apart a whole chunk of separate time as part of the validation set. Right now I believe that the splitting algorithm is picking training values and validation values randomly in the same (whole) timespan. This intertwining of training and validation values over time is probably what makes timestamp so effective as a feature, in my opinion. Essentially, if you know how people feel around a specific time, it's easier to predict the performance perception of others around the same time. With Russian wikipedia dominating the data because of its larger traffic, it's easy to imagine that collectively internet users in Russia might be experiencing slowdowns at the same time. It could be coming from us, from the network, from traffic peaks at specific times of day. It could also be traffic spikes to specific articles.

I'm going to lock down the task somewhat for now at Dario Rossi's request, because having preliminary results available publicly is problematic for the double-blind submission of the research paper.

Gilles changed the visibility from "Public (No Login Required)" to "Custom Policy".

Another thing that occurred to me: we know that we've had factors (eg, Chrome 69) in the study period that may have changed actual perception for a large group of subjects. I wonder if that could also be influencing the importance of timestamp as a factor?

Absolutely, and the DC switchover, students going back to school in September, etc.

I've added month, month day and year day, while still keeping actual timestamp out of the features, and it's "year day" that's super prominent, almost as much as timestamp was. I think this backs up the fact that what's happening is that it's capturing long-term trends that are critically affecting the user perception. It's actually breaking a new record by integrating these instead of the raw timestamp:

precisionrecallf1-scoresupport
-10.800.880.841323
10.870.790.831393
avg / total0.840.830.832716

Now the question is, to what extent it's capturing cyclical (back to school) and non-cyclical (DC switchover, browser update) events. Maybe we can tell a bit by looking at which days the tree branches end up using as cutoff points by inspecting the generated trees, I'll look at that next week.

If we want the model to keep capturing non-cyclical events, it will have to be streaming or run regularly against recent data. In other words, to be able to make it adapt to non-cyclical events, we have to keep the survey running permanently for a small fraction of users.

Hi Gilles, nice results!
Unluckily I am not able to replicate them and I am still stuck to 0.6ish of recall for negative replies. Can you please post the query you are using to collect the data and the information referred to the qsi.event.performanceNow to filter out the late surveys?

I have been trying this one and succeeded for September but when it comes to the month of August I have

Error: org.apache.thrift.TException: Error in calling method CloseOperation (state=08S01,code=0)
Error: Error while cleaning up the server resources (state=,code=0)

This is the query I am using

SELECT * FROM event.quicksurveysresponses AS qsr
INNER JOIN event.quicksurveyinitiation qsi ON qsr.event.surveyInstanceToken = qsi.event.surveyInstanceToken
INNER JOIN event.navigationtiming nt ON qsr.event.surveyInstanceToken = nt.event.stickyRandomSessionId
WHERE qsr.year = 2018 AND qsi.year = 2018 AND nt.year = 2018 
AND qsr.month = 8 AND qsi.month = 8 AND nt.month = 8
AND qsr.event.surveyCodeName = "perceived-performance-survey"
AND qsr.event.surveyResponseValue IN ('ext-quicksurveys-example-internal-survey-answer-positive', 'ext-quicksurveys-example-internal-survey-answer-negative')
AND qsi.event.performanceNow - nt.event.loadEventEnd < 10000;

I maybe managed to replicate your results (If the query I made to the dB was correct), but these one, in my case, refer only to one fold, which appears to be a "lucky one", since when I perform a 10-fold validation there is a significant drop in the performances, specially for the recall of (-1), with respect to these:

precision    recall  f1-score   support

          -1       0.75      0.88      0.81      1047
           1       0.85      0.70      0.77      1010

   micro avg       0.79      0.79      0.79      2057
   macro avg       0.80      0.79      0.79      2057
weighted avg       0.80      0.79      0.79      2057

The current dataset I'm using is coming from the view I've created. Querying this view takes 30+ minutes, though.

You can see the query it's doing with

SHOW CREATE TABLE unifiedPerformanceSurvey;

Your query looks fine, it would just be missing more recent data where the column in the navigationtiming table was renamed.

Anyway, instead of running the query I've already ran, you can just access the data directly under /home/gilles/export.tsv on stat1004

You can also find the script I'm using to process the data (where, quite importantly, I'm dropping a bunch of features captured by that query) under /home/gilles/randomforest2.py also on stat1004. You need to run it with Python 2.

As you'll see at the end, I'm using GridSearchCV with 10-fold cross-validation. Unless I'm mistaken, it's selecting the best estimator based on that. All the classification reports I've shared came from that.

Looking only at November data, which contains new metrics like the cpu benchmark and top image resource timing, these are the top Pearson correlations for individual metrics:

page_responseend-0.124995
page_loadeventstart-0.118504
page_domcomplete-0.118501
page_loadeventend-0.118448
page_dominteractive-0.117836
topimage_starttime-0.100179
topimage_fetchstart-0.100179
page_tcp-0.095061
topimage_domainlookupend-0.093590
topimage_connectstart-0.093457
topimage_responseend-0.092828
topimage_domainlookupstart-0.092723
topimage_requeststart-0.091953
topimage_connectend-0.091017
topimage_responsestart-0.087445
page_processing-0.086445
page_rumspeedindex-0.082267
topimage_secureconnectionstart-0.069033

And for reference, firstPaint is close to 0 (and positively correlated, even):

page_firstpaint0.005310

In the new ones it's interesting to see that central notice time has a low correlation:

centralnoticetime-0.020357

CPU score correlation isn't high:

cpuscore-0.044808

While top image latency seems important, the size of the image isn't:

topimage_transfersize-0.001743

It's too bad that we can't (yet) have such a thing as top image firstPaint, it might score high.

Now that we have CPU benchmarking data, we can verify what came out of the manual labelling of device power based on UA. And just like before, the slower the device, the more unhappy you are likely to be about your pageload's performance:

Subset of responsesPercentage of positive responses
All88.74
100 < cpu score <= 20090.75
200 < cpu score <= 30090.46
300 < cpu score <= 40089.01
400 < cpu score <= 50086.73
500 < cpu score85.81

Following the discussion we've had during the private presentation on Monday, next actionnables seem to be:

  • increase overall NavigationTiming sampling rate on ruwiki
  • run a community consultation on eswiki to have the survey run there

After checking the data on Turnilo, I see that eswiki has the same amount of traffic as ruwiki. If we apply the same new sampling rate (1 in every 100) to eswiki as we're going to for ruwiki, both measures combined would increase our data collection by 20x. Meaning we could potentially collect approximately 15000 survey responses per day, or 5.4 million per year.

I've increased the overall navtiming rate for ruwiki and the survey rate for frwiki

Change 483369 had a related patch set uploaded (by Gilles; owner: Gilles):
[operations/mediawiki-config@master] Revert ruwiki navtiming rate

https://gerrit.wikimedia.org/r/483369

Change 483369 merged by jenkins-bot:
[operations/mediawiki-config@master] Revert ruwiki navtiming rate

https://gerrit.wikimedia.org/r/483369

Mentioned in SAL (#wikimedia-operations) [2019-01-10T09:52:48Z] <gilles@deploy1001> Synchronized wmf-config/InitialiseSettings.php: T187299 Decrease ruwiki navtiming rate (duration: 00m 52s)

Gilles added a subscriber: stjn.

@stjn I tried to respond to your message on ruwiki but it appears I've been blocked from editing there...

Never mind, I'm not blocked, my message was probably just triggering an abuse filter. I was just responding that I'm going to work on making a different sampling rate for editors and readers possible for the survey.

Great, sorry for not answering there sooner.

Change 485763 had a related patch set uploaded (by Gilles; owner: Gilles):
[mediawiki/extensions/NavigationTiming@master] Add ability to set different survey rate for logged-in users

https://gerrit.wikimedia.org/r/485763

I think we could collect fairly cheaply a history of past loadEventStart stored in localStorage and have that recorded when the user is sampled by navtiming. This way we would be able to see if the pageview respondents are asked about is unusually fast/slow compared to what they've previously experienced. Something like an array of timestamp + loadEventEnd recorded for each article view, and we keep the last 10/20.

Change 485763 merged by jenkins-bot:
[mediawiki/extensions/NavigationTiming@master] Add ability to set different survey rate for logged-in users

https://gerrit.wikimedia.org/r/485763

Change 491229 had a related patch set uploaded (by Gilles; owner: Gilles):
[operations/mediawiki-config@master] Launch performance perception survey on eswiki

https://gerrit.wikimedia.org/r/491229

Change 491229 merged by jenkins-bot:
[operations/mediawiki-config@master] Launch performance perception survey on eswiki

https://gerrit.wikimedia.org/r/491229

Mentioned in SAL (#wikimedia-operations) [2019-02-19T11:26:13Z] <gilles@deploy1001> Synchronized wmf-config/InitialiseSettings.php: T187299 Launch performance perception survey on eswiki (duration: 00m 46s)

I've had a look at the eswiki data on https://grafana.wikimedia.org/d/000000551/performance-perception-survey and picking a couple of different days, the 87% satisfaction ratio is true there as well. I think it's quite remarkable that this holds true, it's the same ratio we had on ruwiki.

Change 493055 had a related patch set uploaded (by Gilles; owner: Gilles):
[operations/mediawiki-config@master] Oversample navtiming on ruwiki and eswiki

https://gerrit.wikimedia.org/r/493055

Change 493055 merged by jenkins-bot:
[operations/mediawiki-config@master] Oversample navtiming on ruwiki and eswiki

https://gerrit.wikimedia.org/r/493055

Mentioned in SAL (#wikimedia-operations) [2019-03-05T10:07:37Z] <gilles@deploy1001> Synchronized php-1.33.0-wmf.19/extensions/NavigationTiming: T187299 Backport wiki oversampling config syntax change (duration: 00m 48s)

Mentioned in SAL (#wikimedia-operations) [2019-03-05T10:10:50Z] <gilles@deploy1001> Synchronized wmf-config/InitialiseSettings.php: T187299 Oversample navtiming on ruwiki and eswiki (duration: 00m 47s)

Wiki oversampling results in a bunch of warnings: https://logstash.wikimedia.org/app/kibana#/dashboard/1c3a4d80-35c2-11e7-b186-d1bc9cbdde4c?_g=h@ba40421&_a=h@f9f2916

PHP Warning: array_filter() expects parameter 1 to be an array or collection
t  exception.trace	       	#0 [internal function]: MWExceptionHandler::handleError(integer, string, string, integer, array, array)
#1 /srv/mediawiki/php-1.33.0-wmf.19/extensions/NavigationTiming/NavigationTiming.config.php(41): array_filter(integer, Closure$NavigationTimingConfig::getNavigationTimingConfigVars;1616, integer)
#2 /srv/mediawiki/php-1.33.0-wmf.19/includes/resourceloader/ResourceLoaderFileModule.php(1121): NavigationTimingConfig::getNavigationTimingConfigVars(ResourceLoaderContext)
#3 /srv/mediawiki/php-1.33.0-wmf.19/includes/resourceloader/ResourceLoaderFileModule.php(623): ResourceLoaderFileModule->expandPackageFiles(ResourceLoaderContext)
#4 /srv/mediawiki/php-1.33.0-wmf.19/includes/resourceloader/ResourceLoaderModule.php(827): ResourceLoaderFileModule->getDefinitionSummary(ResourceLoaderContext)
#5 /srv/mediawiki/php-1.33.0-wmf.19/includes/resourceloader/ResourceLoader.php(662): ResourceLoaderModule->getVersionHash(ResourceLoaderContext)
#6 [internal function]: Closure$ResourceLoader::getCombinedVersion(string)
#7 /srv/mediawiki/php-1.33.0-wmf.19/includes/resourceloader/ResourceLoader.php(674): array_map(Closure$ResourceLoader::getCombinedVersion;613, array)
#8 /srv/mediawiki/php-1.33.0-wmf.19/includes/resourceloader/ResourceLoader.php(755): ResourceLoader->getCombinedVersion(ResourceLoaderContext, array)
#9 /srv/mediawiki/php-1.33.0-wmf.19/load.php(46): ResourceLoader->respond(ResourceLoaderContext)
#10 /srv/mediawiki/w/load.php(3): include(string)
#11 {main}

This comes from oversample array validation coming from NavigationTiming.config.php

Change 494460 had a related patch set uploaded (by Gilles; owner: Gilles):
[mediawiki/extensions/NavigationTiming@master] Fix NavigationTimingOversampleFactor validation

https://gerrit.wikimedia.org/r/494460

Change 494463 had a related patch set uploaded (by Gilles; owner: Gilles):
[mediawiki/extensions/NavigationTiming@wmf/1.33.0-wmf.19] Fix NavigationTimingOversampleFactor validation

https://gerrit.wikimedia.org/r/494463

Change 494463 merged by jenkins-bot:
[mediawiki/extensions/NavigationTiming@wmf/1.33.0-wmf.19] Fix NavigationTimingOversampleFactor validation

https://gerrit.wikimedia.org/r/494463

Mentioned in SAL (#wikimedia-operations) [2019-03-05T10:55:07Z] <gilles@deploy1001> Synchronized php-1.33.0-wmf.19/extensions/NavigationTiming/NavigationTiming.config.php: T187299 Fix wiki oversampling config validation (duration: 00m 48s)

All good now. Warning went away and oversampling active, as confirmed by EventLogging-schema dashboard on Grafana:

Capture d'écran 2019-03-05 12.01.09.png (956×3 px, 302 KB)

It more than doubles the navtiming events, but it's still small among the overall EventLogging traffic (7-8 events/sec vs 1694).

QuickSurvery responses also increased, as expected:

Capture d'écran 2019-03-05 12.02.54.png (958×3 px, 235 KB)

Change 494460 merged by jenkins-bot:
[mediawiki/extensions/NavigationTiming@master] Fix NavigationTimingOversampleFactor validation

https://gerrit.wikimedia.org/r/494460

As a result of the oversampling, we are showing the survey to 10x anonymous users and the same amount of logged-in users as before. We are only getting 3x the responses (and that's true for both eswiki and ruwiki). This shows that there are diminishing returns to displaying the survey more.

As a result, at the current rate we are collecting around 17k non-neutral survey responses per day across all surveyed wikis, which works out to 510k per month, 6+ million per year:

0: jdbc:hive2://an-coord1001.eqiad.wmnet:1000> SELECT COUNT(*) FROM event.quicksurveysresponses WHERE year = 2019 AND month = 3 AND day = 6 AND event.surveyResponseValue IN ('ext-quicksurveys-example-internal-survey-answer-positive', 'ext-quicksurveys-example-internal-survey-answer-negative');
17041

@Fsalutari do you think that will be a sufficient amount to attempt deep learning?

Change 494921 had a related patch set uploaded (by Gilles; owner: Gilles):
[operations/mediawiki-config@master] Oversample navtiming on ruwiki and eswiki

https://gerrit.wikimedia.org/r/494921

Change 494921 abandoned by Gilles:
Oversample navtiming on ruwiki and eswiki

https://gerrit.wikimedia.org/r/494921

Change 494921 restored by Gilles:
Oversample navtiming on ruwiki and eswiki

https://gerrit.wikimedia.org/r/494921

Great!
Yes I think so. Let's try

As a result of the oversampling, we are showing the survey to 10x anonymous users and the same amount of logged-in users as before. We are only getting 3x the responses (and that's true for both eswiki and ruwiki). This shows that there are diminishing returns to displaying the survey more.

As a result, at the current rate we are collecting around 17k non-neutral survey responses per day across all surveyed wikis, which works out to 510k per month, 6+ million per year:

0: jdbc:hive2://an-coord1001.eqiad.wmnet:1000> SELECT COUNT(*) FROM event.quicksurveysresponses WHERE year = 2019 AND month = 3 AND day = 6 AND event.surveyResponseValue IN ('ext-quicksurveys-example-internal-survey-answer-positive', 'ext-quicksurveys-example-internal-survey-answer-negative');
17041

@Fsalutari do you think that will be a sufficient amount to attempt deep learning?

Gilles lowered the priority of this task from Medium to Low.Apr 30 2019, 12:03 PM

Change 512205 had a related patch set uploaded (by Gilles; owner: Gilles):
[analytics/refinery@master] Retain more performance data

https://gerrit.wikimedia.org/r/512205

Change 512287 had a related patch set uploaded (by Gilles; owner: Gilles):
[performance/navtiming@master] Track performance perception survey impressions

https://gerrit.wikimedia.org/r/512287

Change 512205 merged by Gilles:
[analytics/refinery@master] Retain more performance data

https://gerrit.wikimedia.org/r/512205

Change 514018 had a related patch set uploaded (by Gilles; owner: Gilles):
[analytics/refinery@master] Retain RUMSpeedIndex

https://gerrit.wikimedia.org/r/514018

Change 514018 merged by Gilles:
[analytics/refinery@master] Retain RUMSpeedIndex

https://gerrit.wikimedia.org/r/514018

Change 512287 merged by jenkins-bot:
[performance/navtiming@master] Track performance perception survey impressions

https://gerrit.wikimedia.org/r/512287

Gilles lowered the priority of this task from Low to Lowest.Oct 24 2019, 8:28 AM
Krinkle changed the visibility from "Custom Policy" to "Public (No Login Required)".Sep 8 2021, 3:15 PM