We use both synthetic and RUM testing for Wikipedia. These two ways of testing performance are best friends and help us verify regressions. Today, we will look at two regressions where it helped us to get metrics both ways.
In our synthetic lab environment, we update the browser version in a controlled way. When there’s a new browser release, we wait for a new Docker container with the latest version. We stop the current tests, update the Docker container and restart the tests and look at the metrics that we graph in Grafana. That way, we can check whether a new browser version introduced a regression.
Our users’ browsers usually upgrade slowly. The browser vendors usually push the browser to a percentage of users first, and then give the green light to update all of them. When we collect performance metrics, we also collect browser names and versions. That way we can see when users pick up a new browser version and if that version has any impact on our metrics. The adoption of new versions by real users takes time, and when we see a regression in our synthetic testing, it can take a couple of weeks until we see the same effect in our user metrics.
Chrome 67
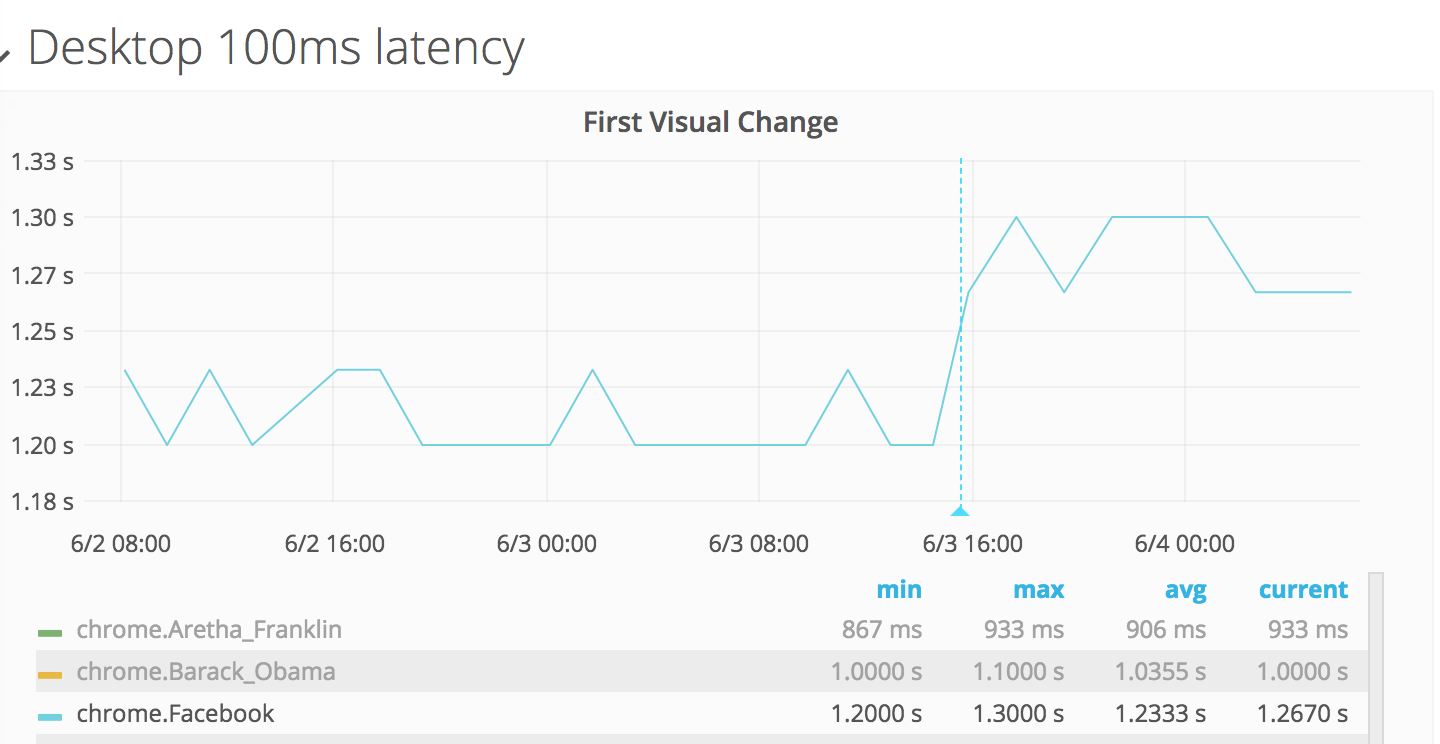
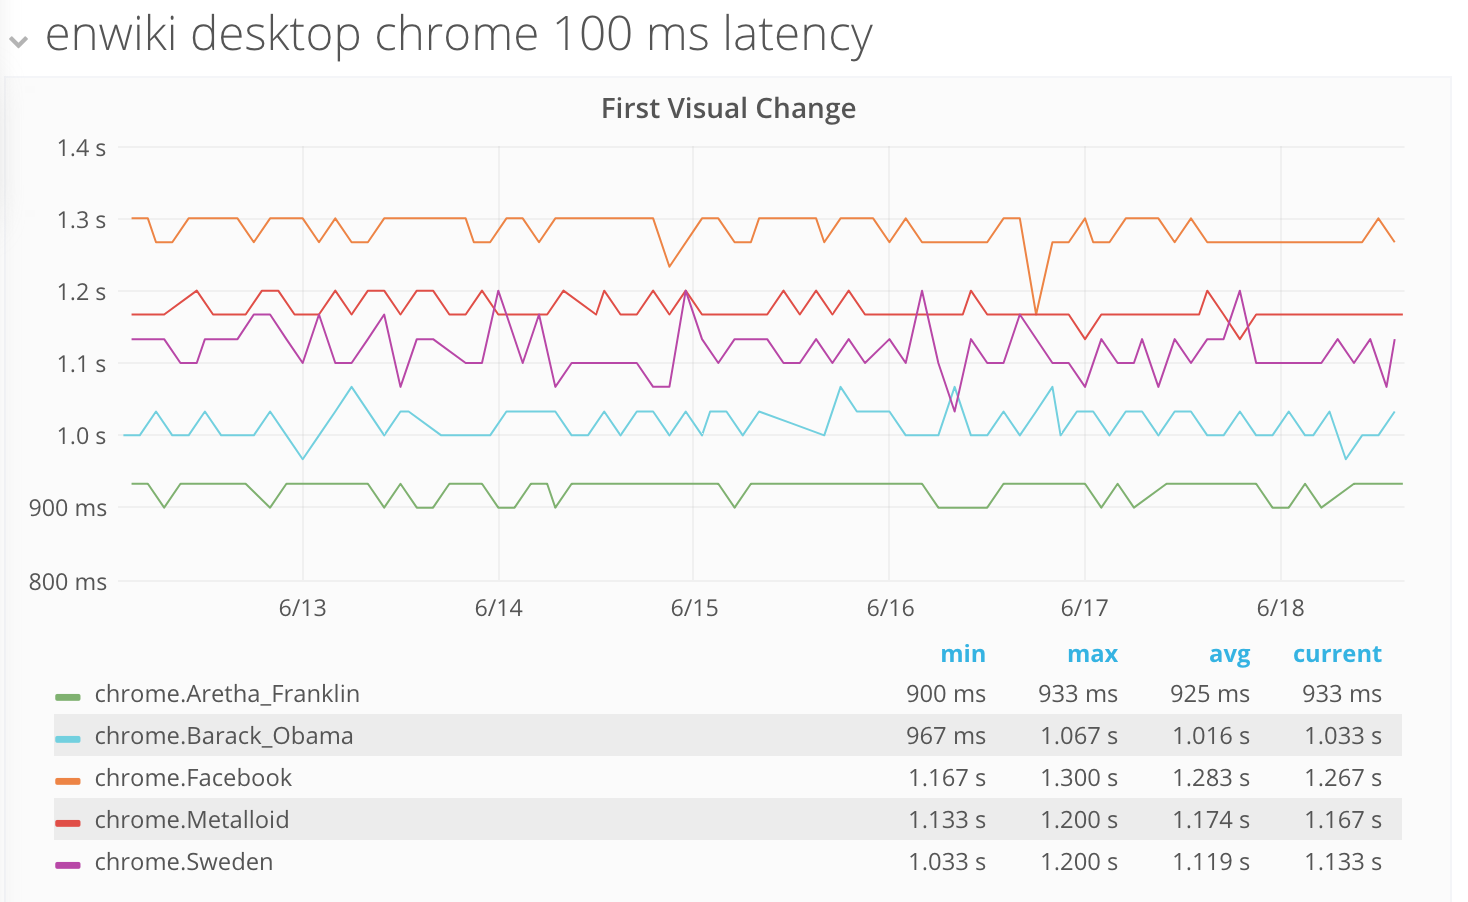
When we pushed Chrome 67 we noticed a regression in our first visual change synthetic testing (T196242).
Here you can see what it looked like for our test of https://en.wikipedia.org/wiki/Facebook. The blue vertical line is when we pushed the new browser version.
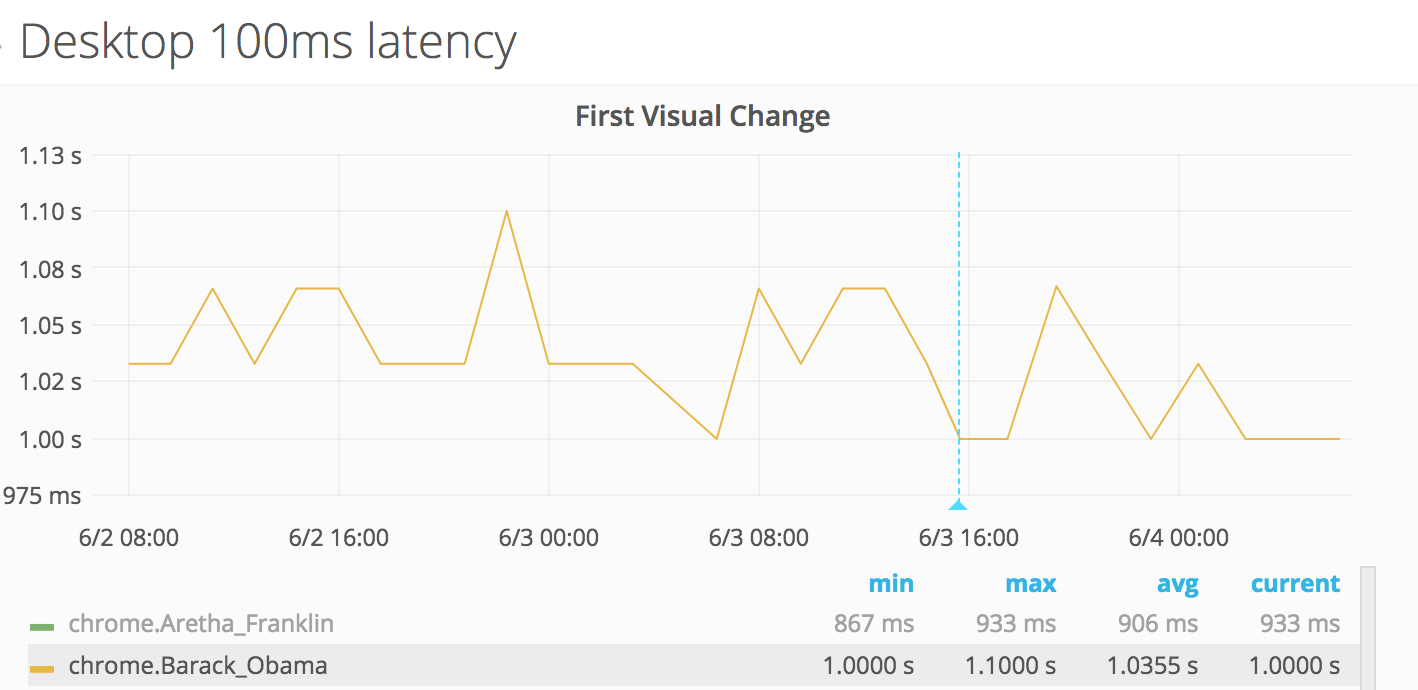
Most of the pages we test were affected, but not all of them. For our tests of the "Barack Obama" English Wikipedia article, it was hard to spot any change at all.
We could only see the change on desktop. And we could verify the regression in both of our synthetic tools (WebPageTest and Browsertime/WebPageReplay). Could it be some content that causes that regression, since it only affected some pages?
Next step
When we see a regression, we always first try to rule out that it has something to do with a change we have done. If the regression happens when we update the browser in our tests, it’s easy: we roll back the browser version and collect new metrics to see if the metrics goes back down. And then we update to the new version again. In this case, we confirmed it was only the browser causing our first visual change metric to jump. (Not a change in our content.)
When we find a browser regression, we try to collect as much data as possible and file an upstream issue. In this case it became Chromium issue 849108.
The next step is to see if we can find the same change in the metrics that we collect directly from users. The firstPaint metric in Chrome is similar to the first visual change metric we use in our synthetic testing. Which means that when we have enough traffic coming from Chrome 67, we should be able to see the change on first paint.
The conversion rate from Chrome 66 to 67 looked like this:
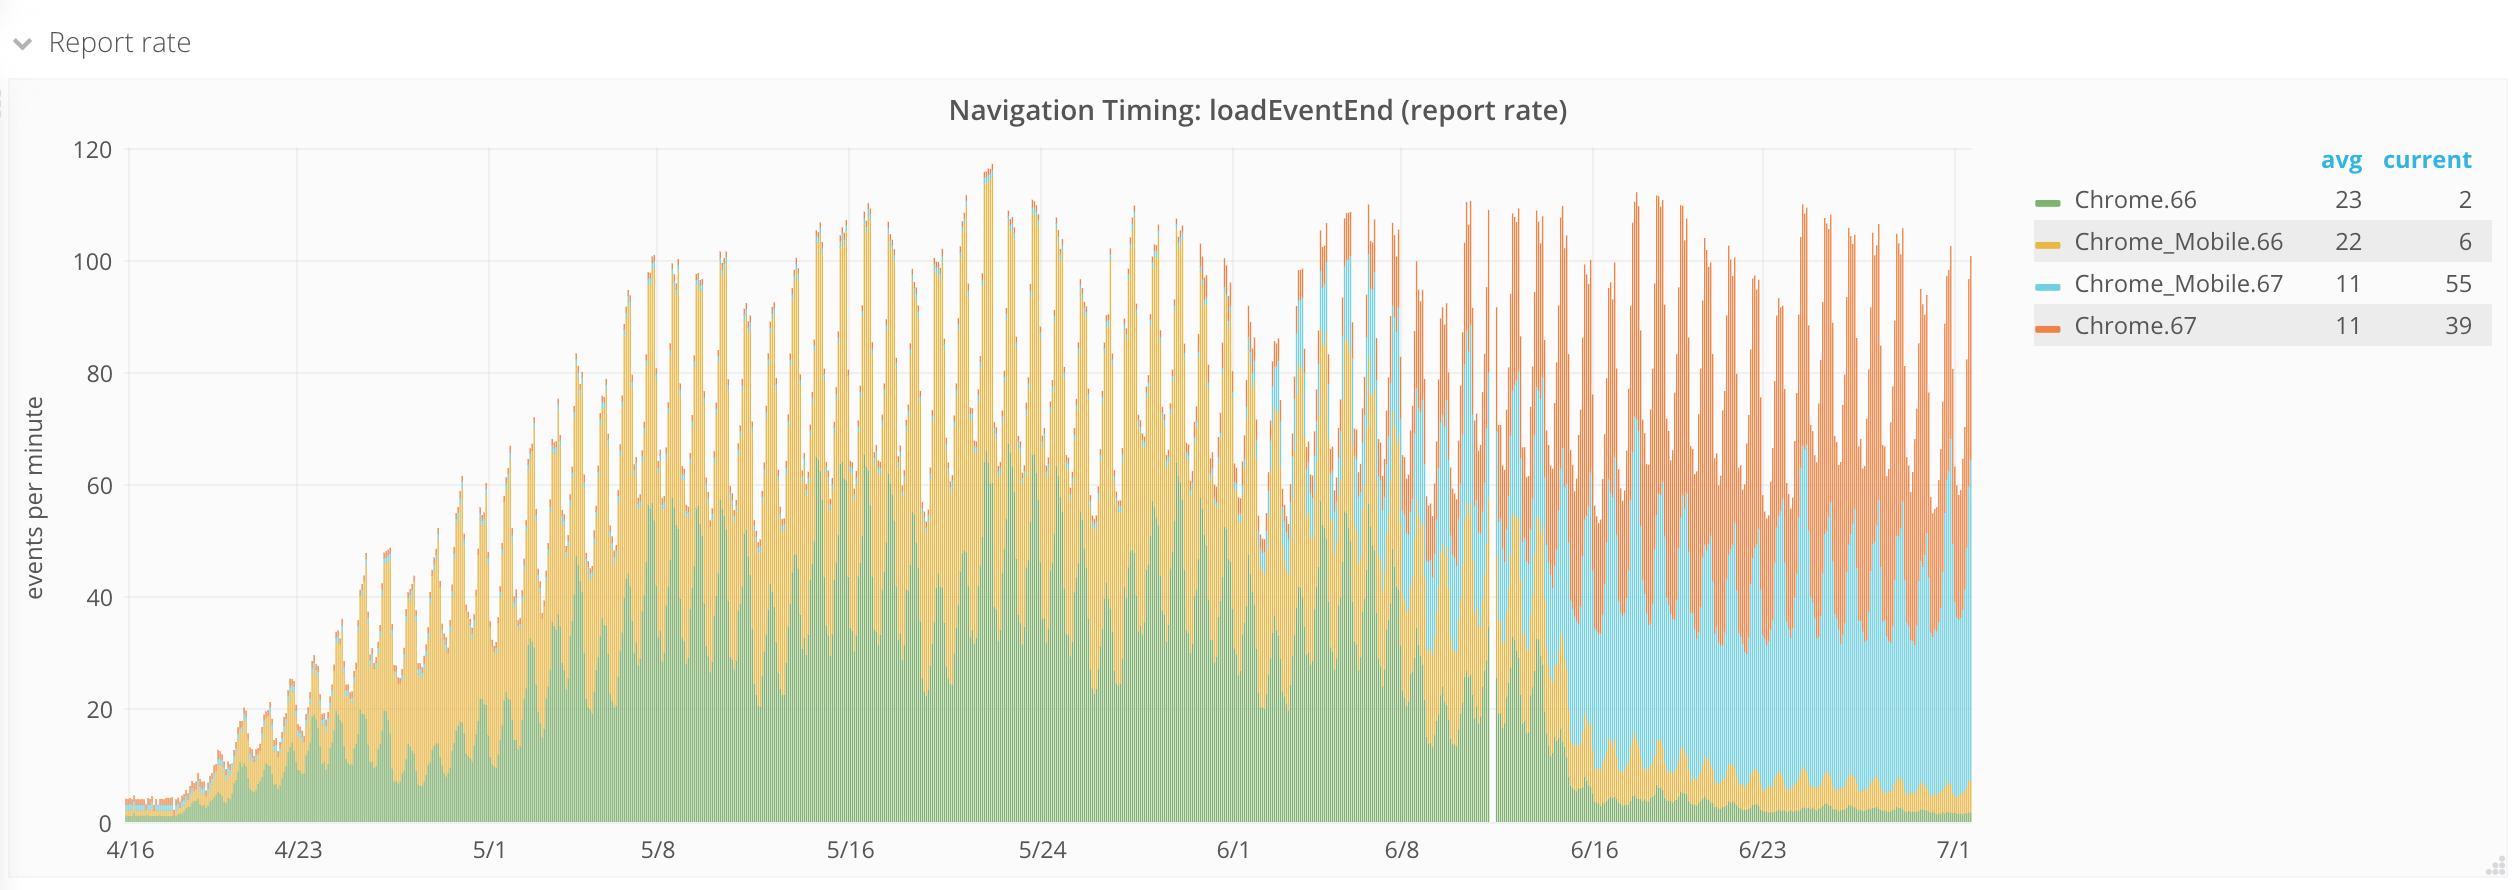
If you look real closely, you can see that around the 15th of June we started getting enough traffic for Chrome 67 to see the effect on our metrics.
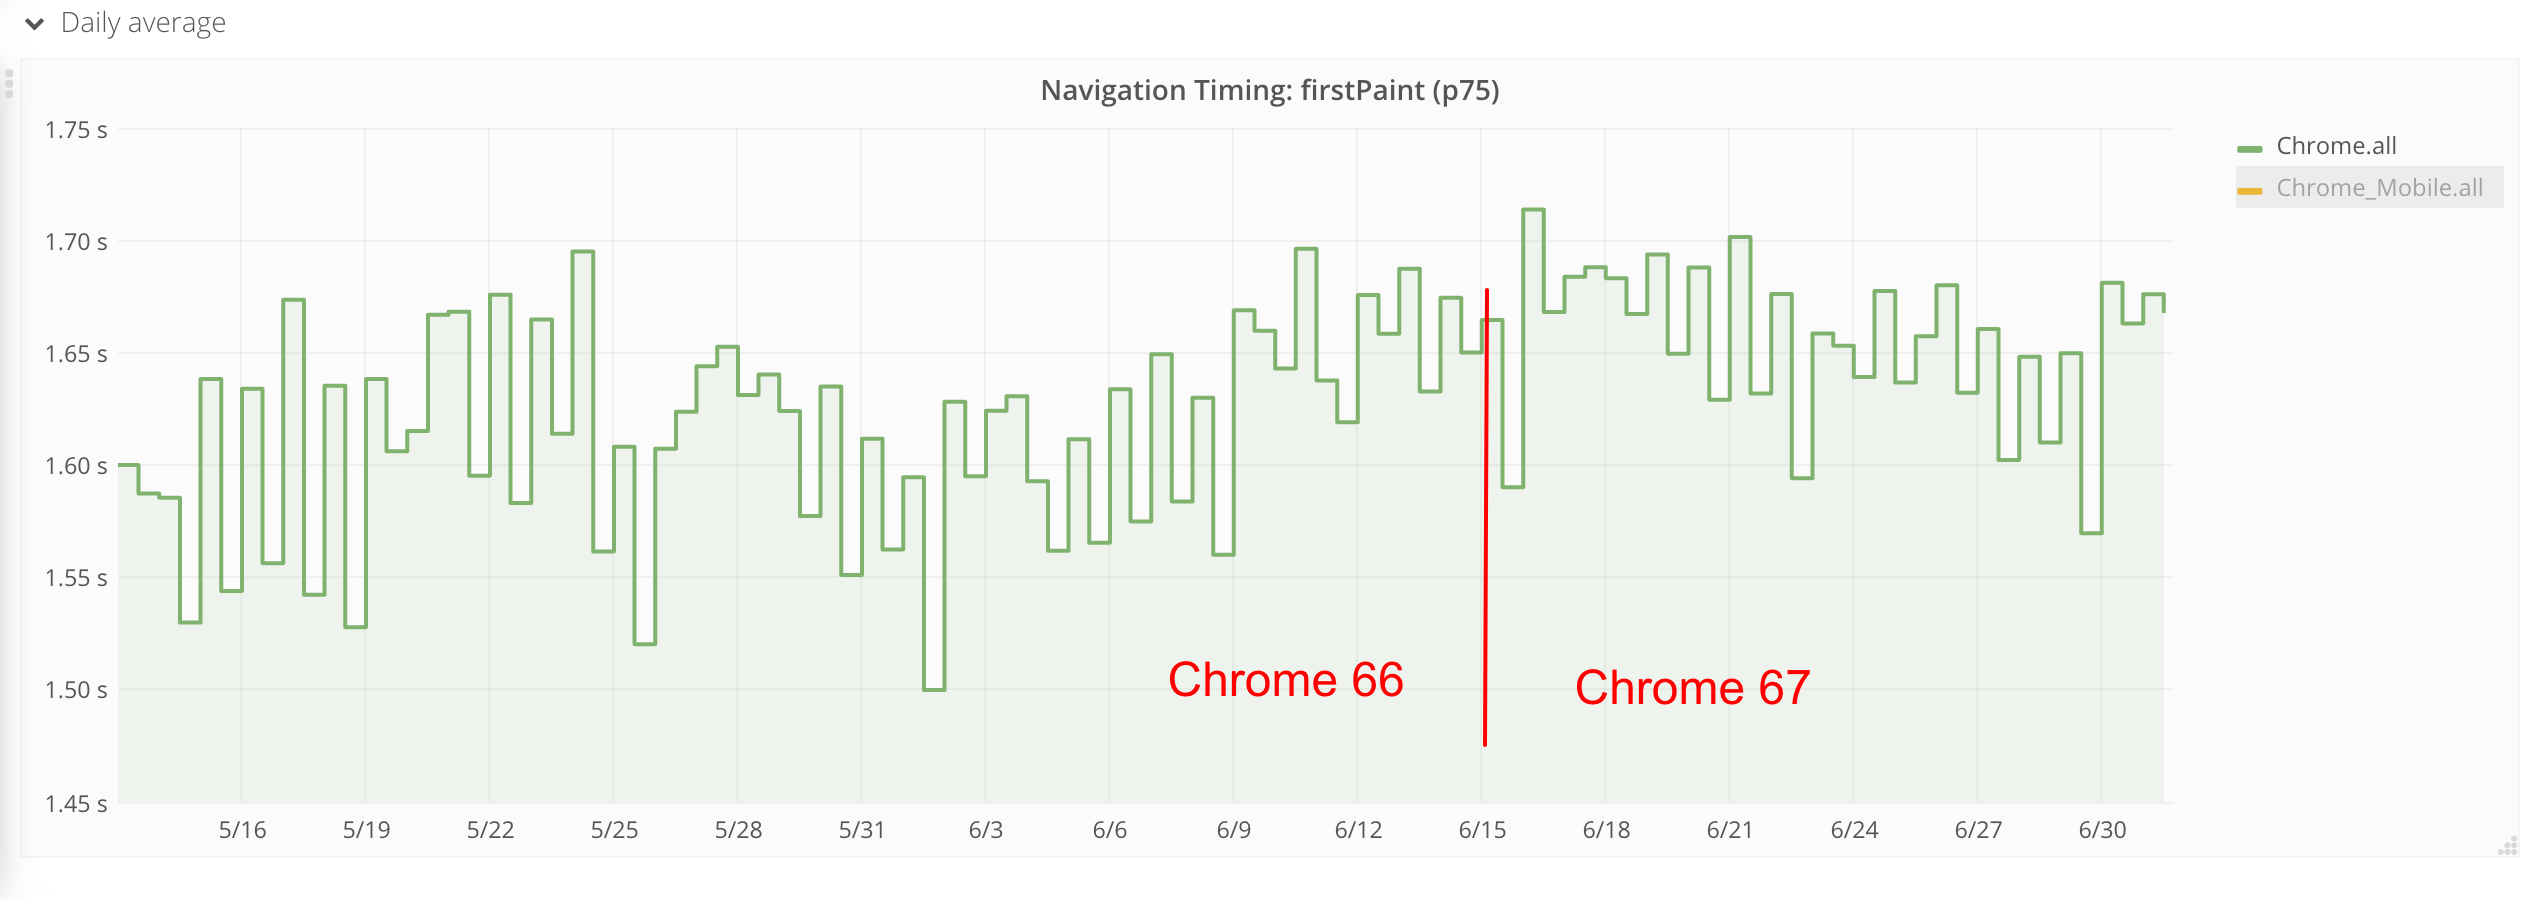
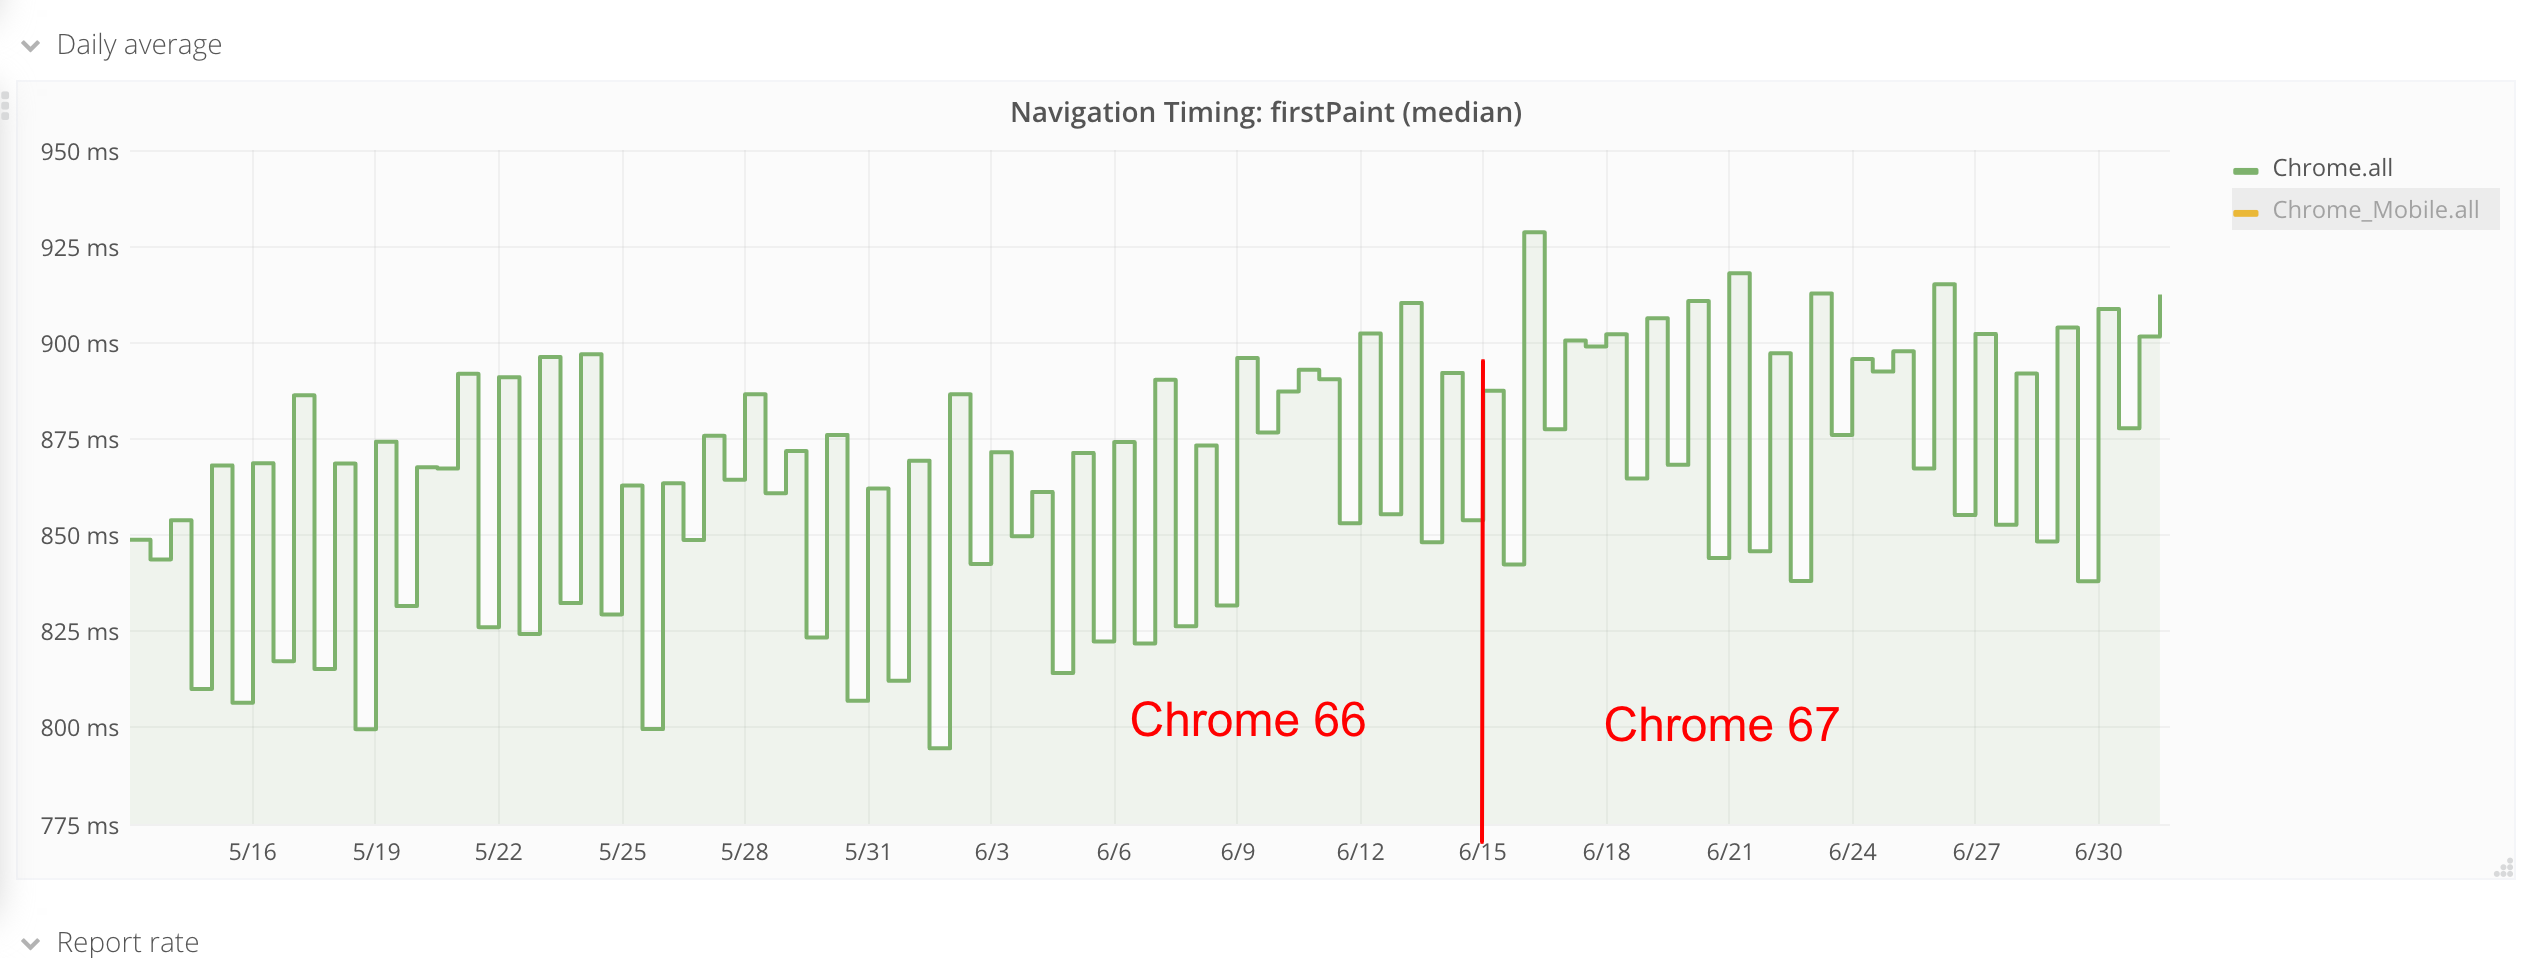
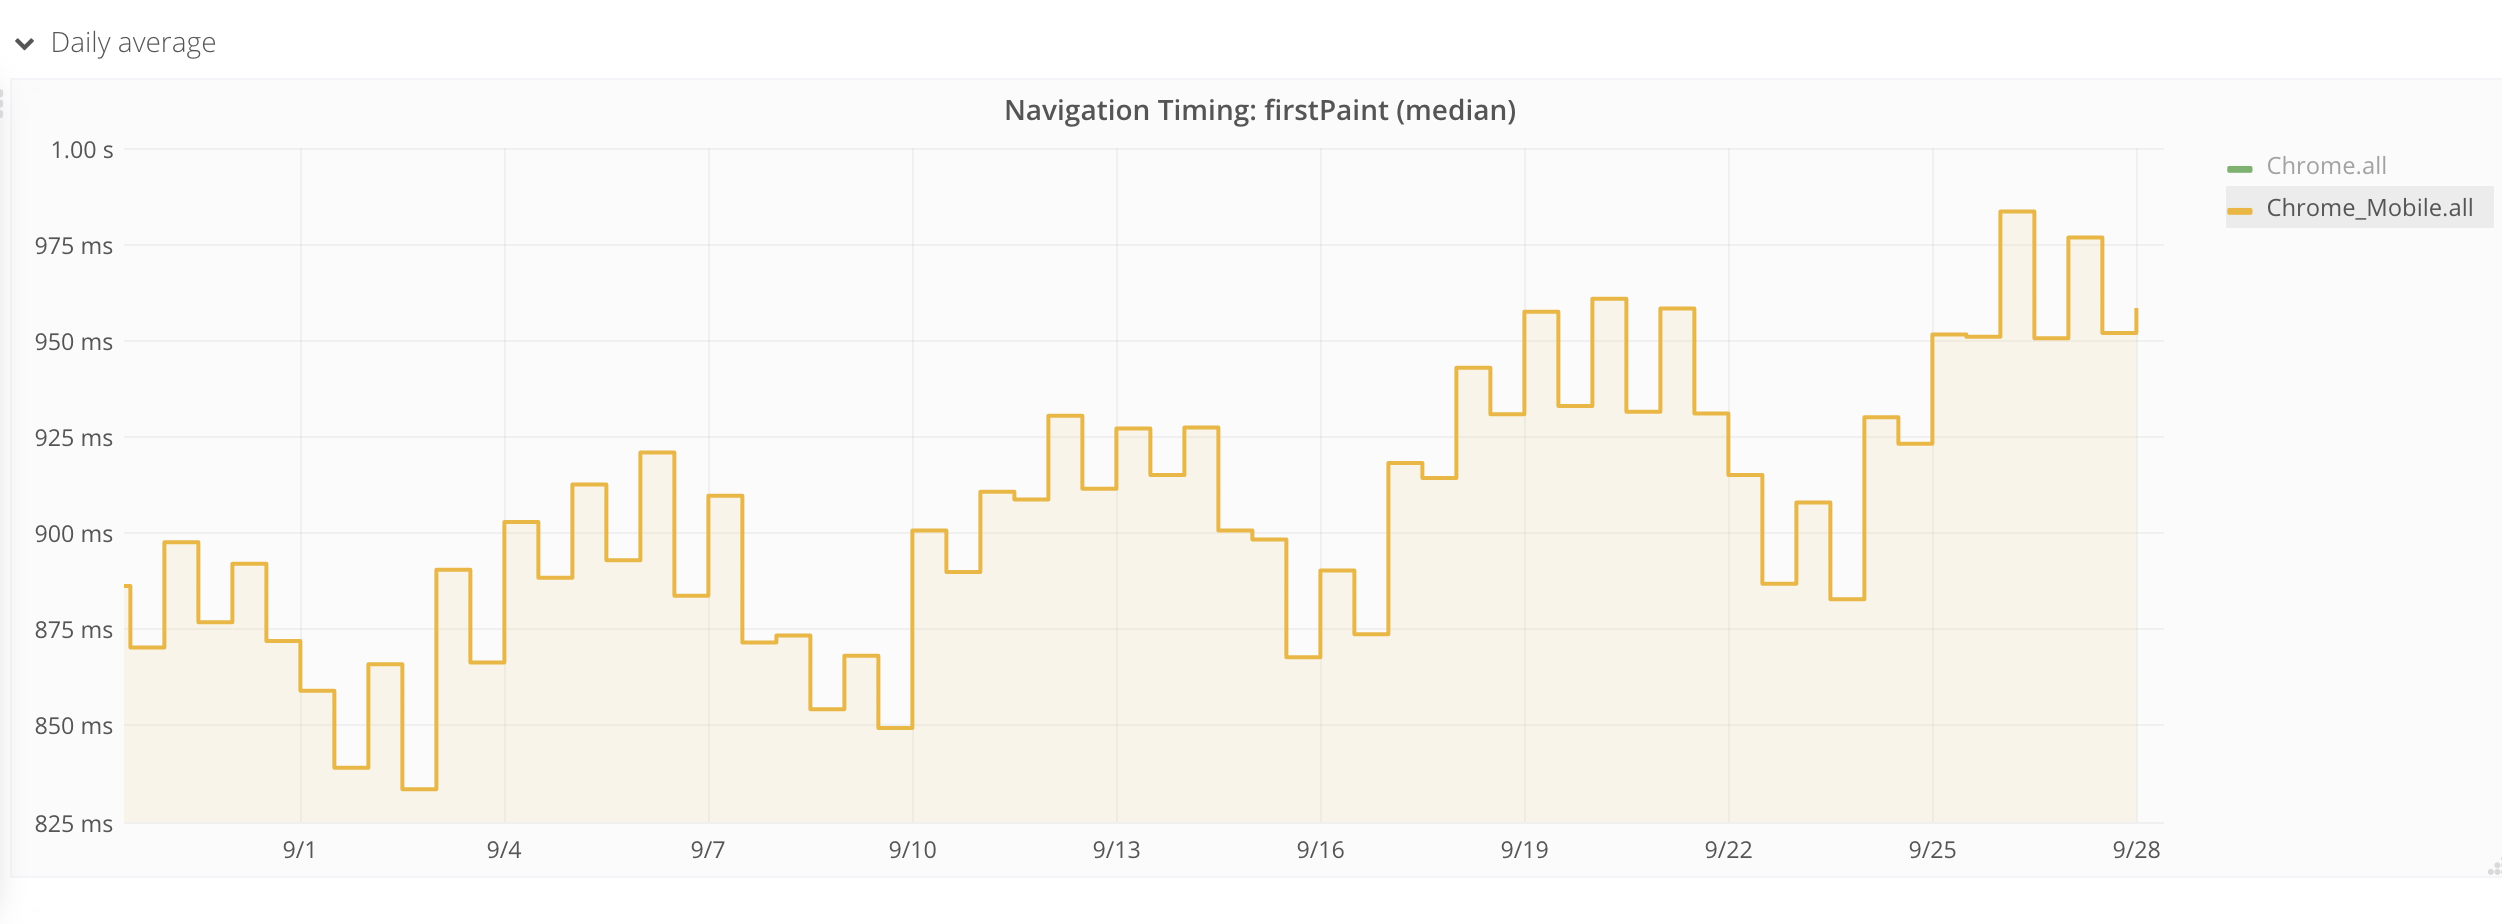
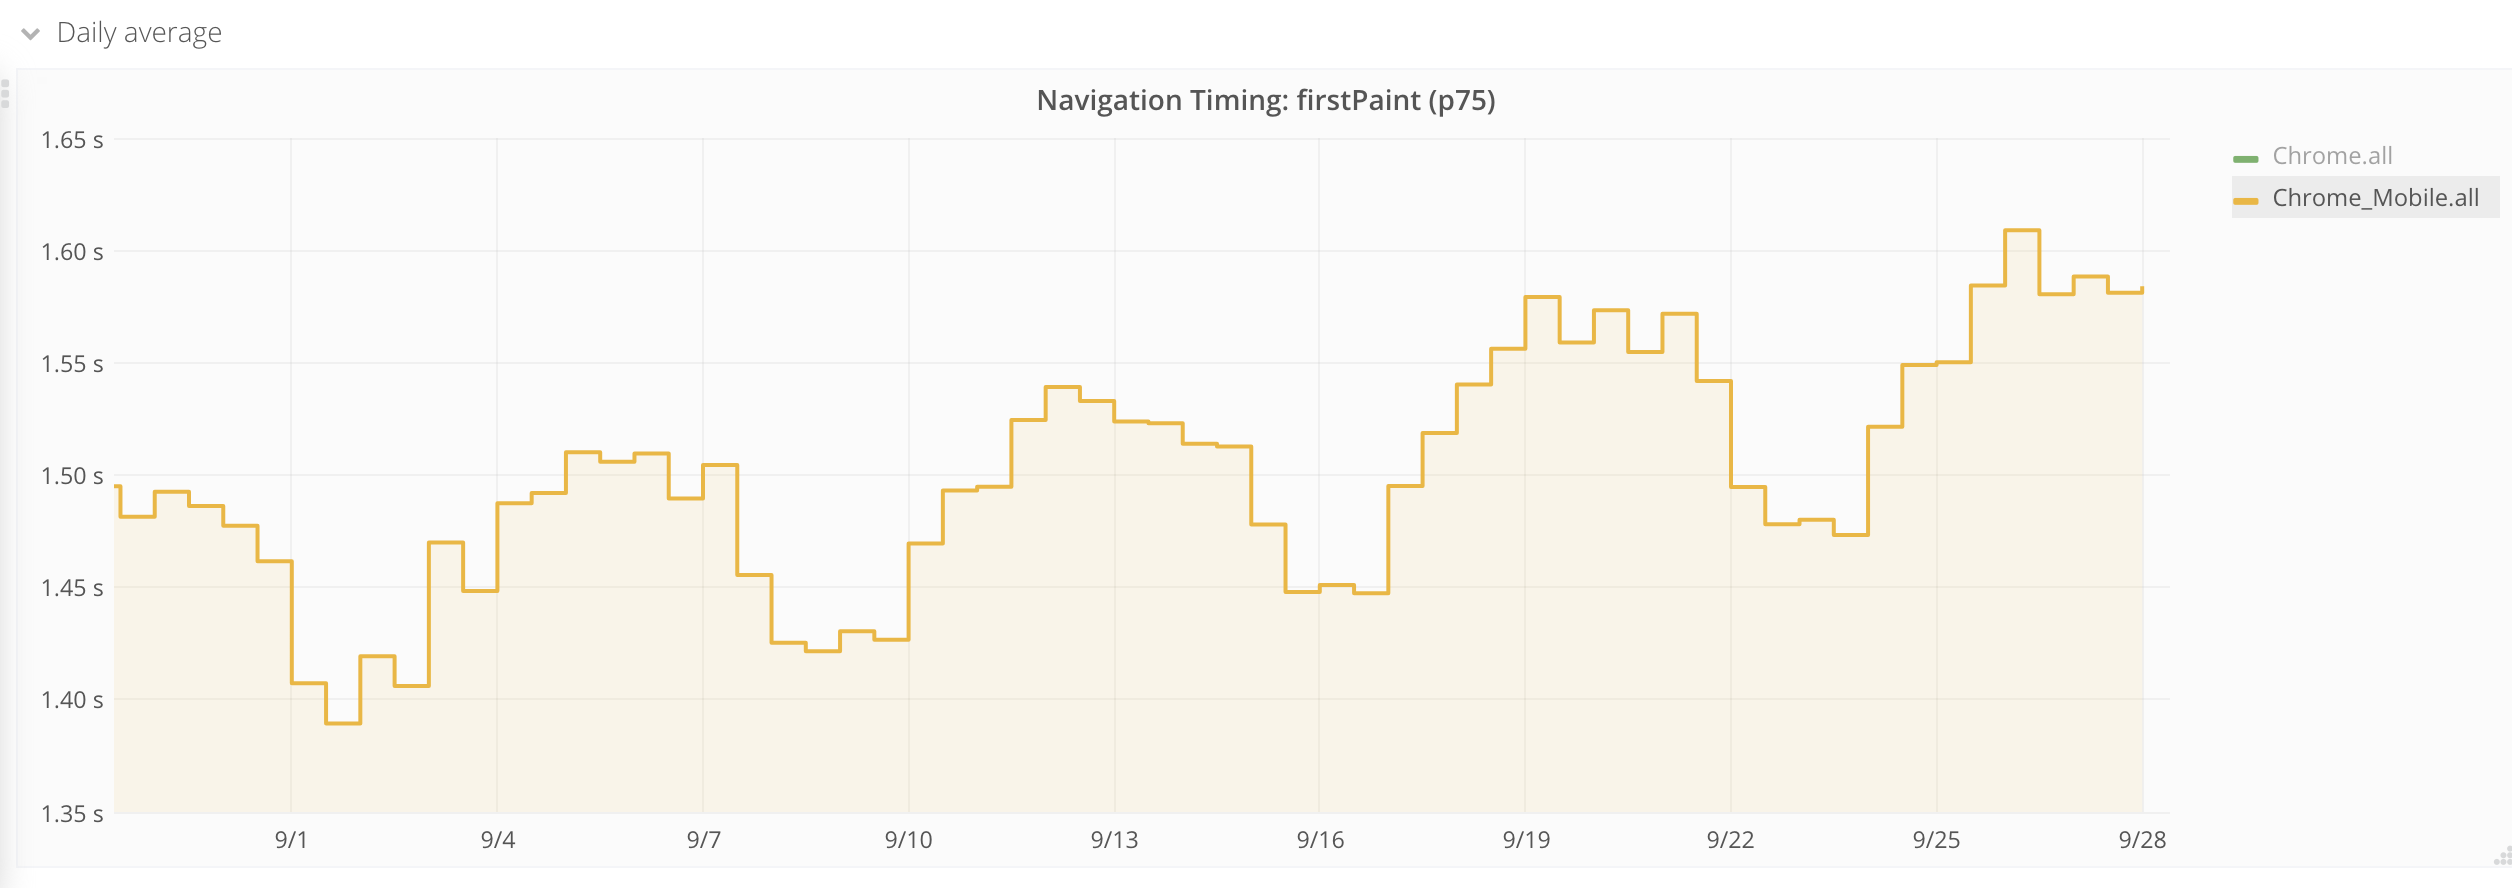
To see the change in Chrome, we look at the metrics we collect from all versions of Chrome and check the median and 75th percentile of first paint.
In the following graph, we take the average over one day to try to minimize spikes. If you look at the right side (Chrome 67) of the graphs you can see that it has a slightly higher first paint than to the left (Chrome 66).
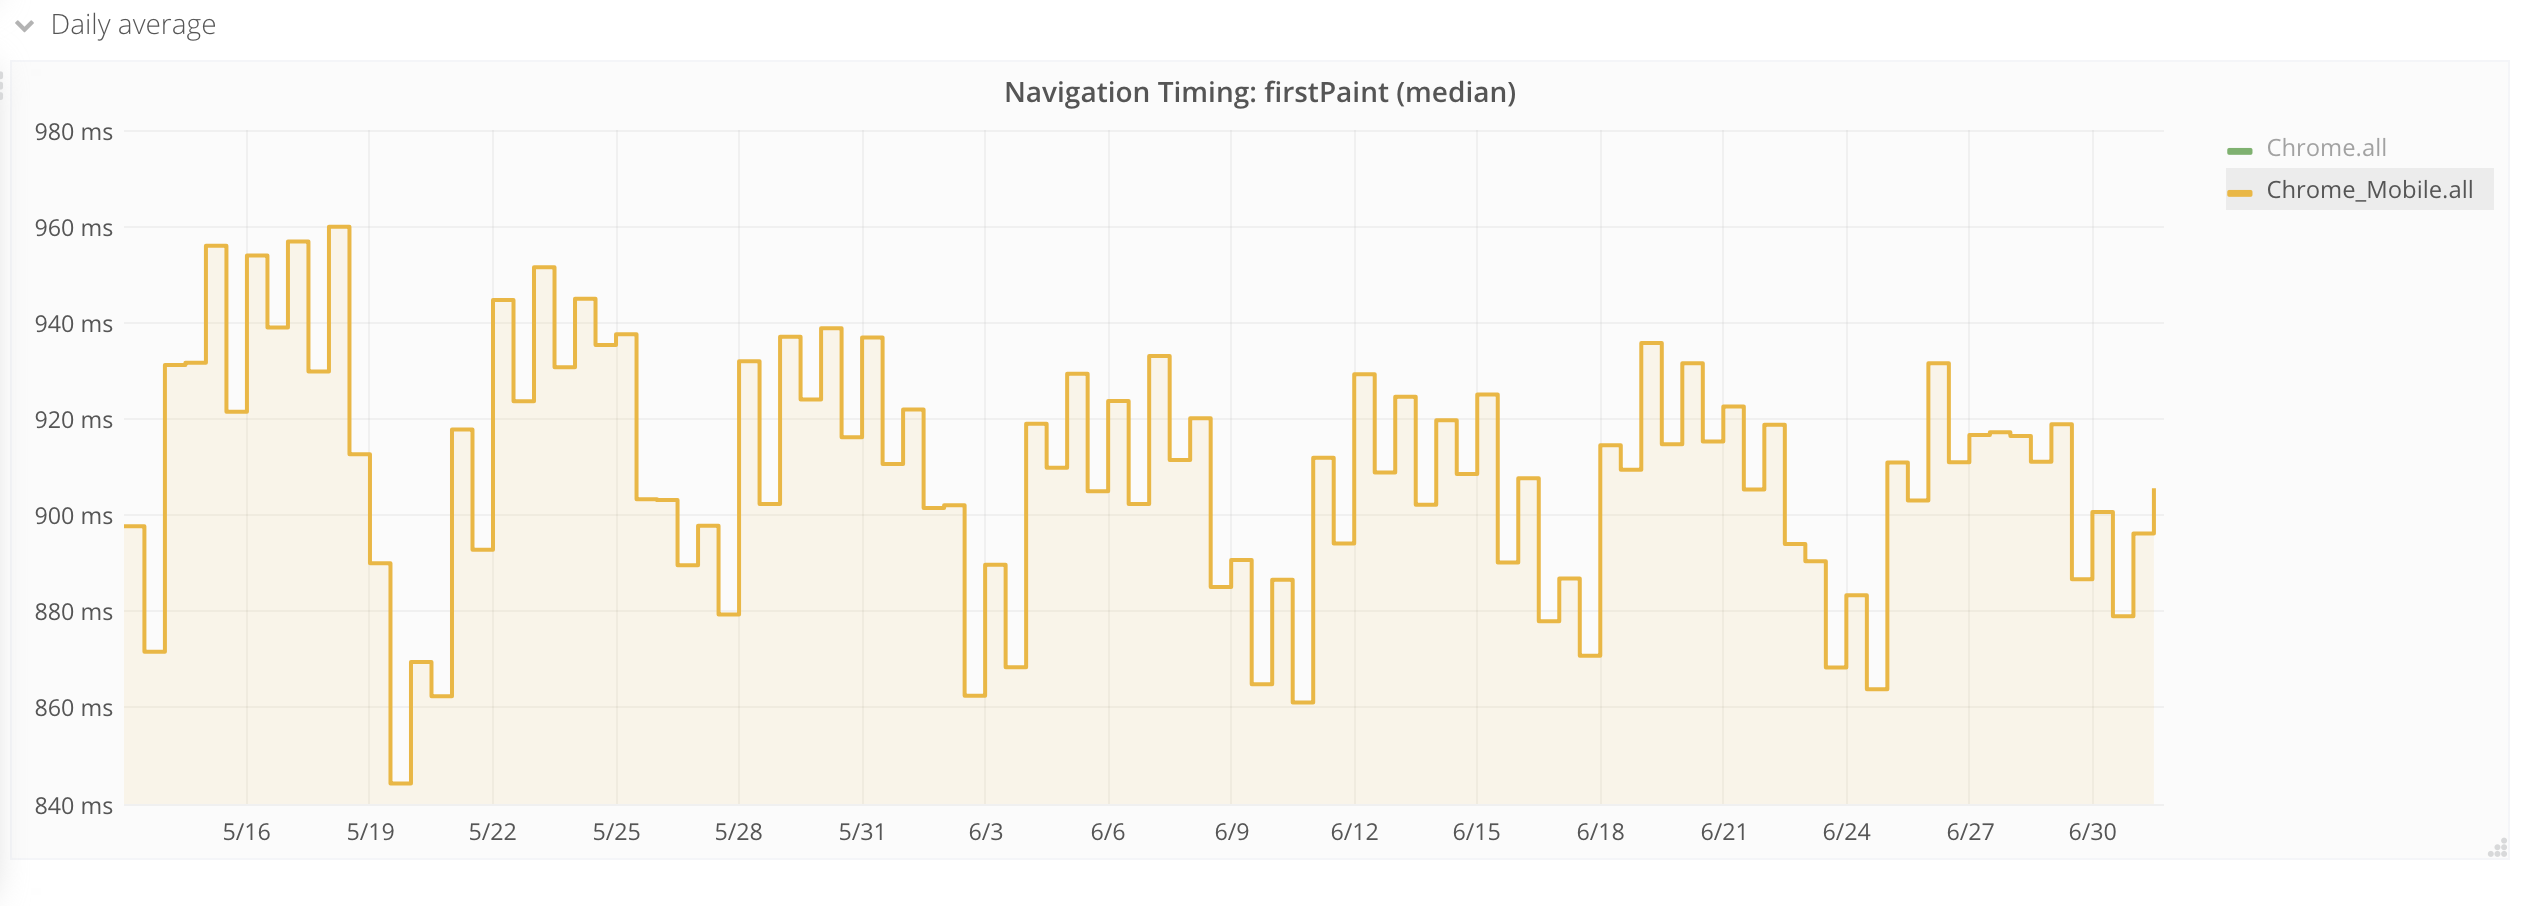
To verify the metrics, we also looked at first paint on mobile. There’s no regression there, it rather looks like there could be a small win in first paint.
To be 100% sure that there’s nothing we introduced, we take another look at synthetic testing at that time when the increase in first paint was seen for real users (15th of June).
There’s no increase in the metrics from synthetic tests at that time. This confirms it was a (small) regression in Chrome 67.
Chrome 69
Some time ago, our performance alerts in Grafana fired about first paint in Chrome having increased for our users. We looked at it, and couldn’t find an exact issue that could have caused it. It looked like the metric had slowly increased over time. That type of regression are always the hardest to deal with because it’s hard to see exactly what’s causing the regression.
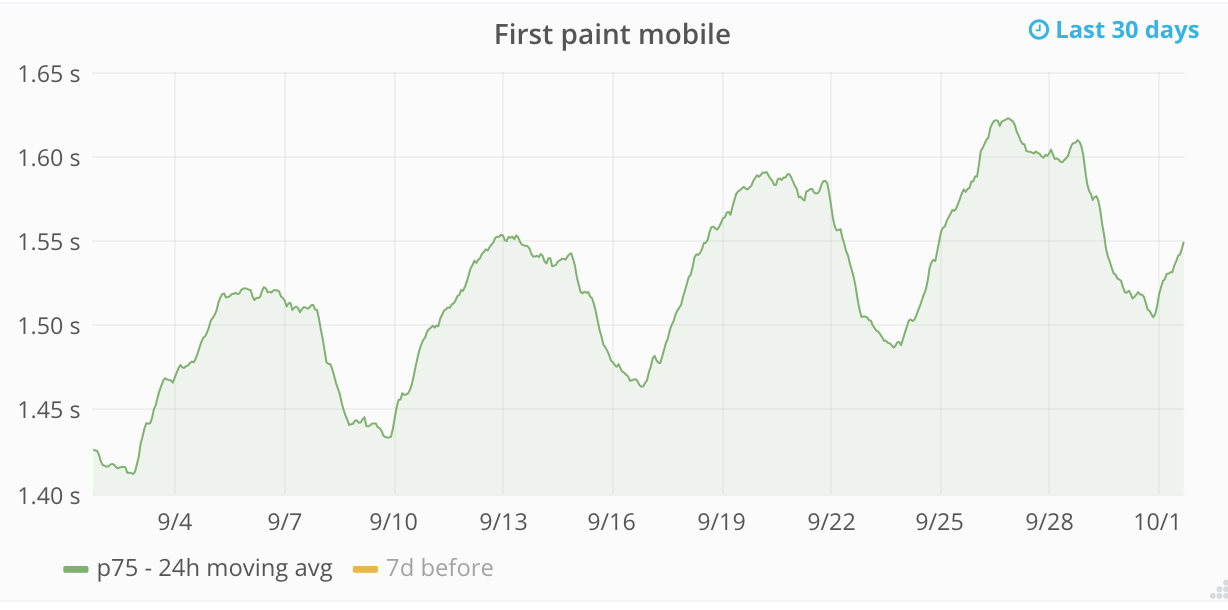
We could see the regression both on desktop and mobile. It was most obvious when we checked the first paint on mobile. You can see the weekly pattern we have but the highs are getting higher and higher.
But we actually had the answer: When we updated to Chrome 69 in our synthetic testing a couple of weeks ago, we again saw an increase in first visual change. This time, we could see the regression on some wikis but not all of them. We’ve switched back and forth between Chrome 68 and 69 and first visual change for the Japanese wiki looked like this:
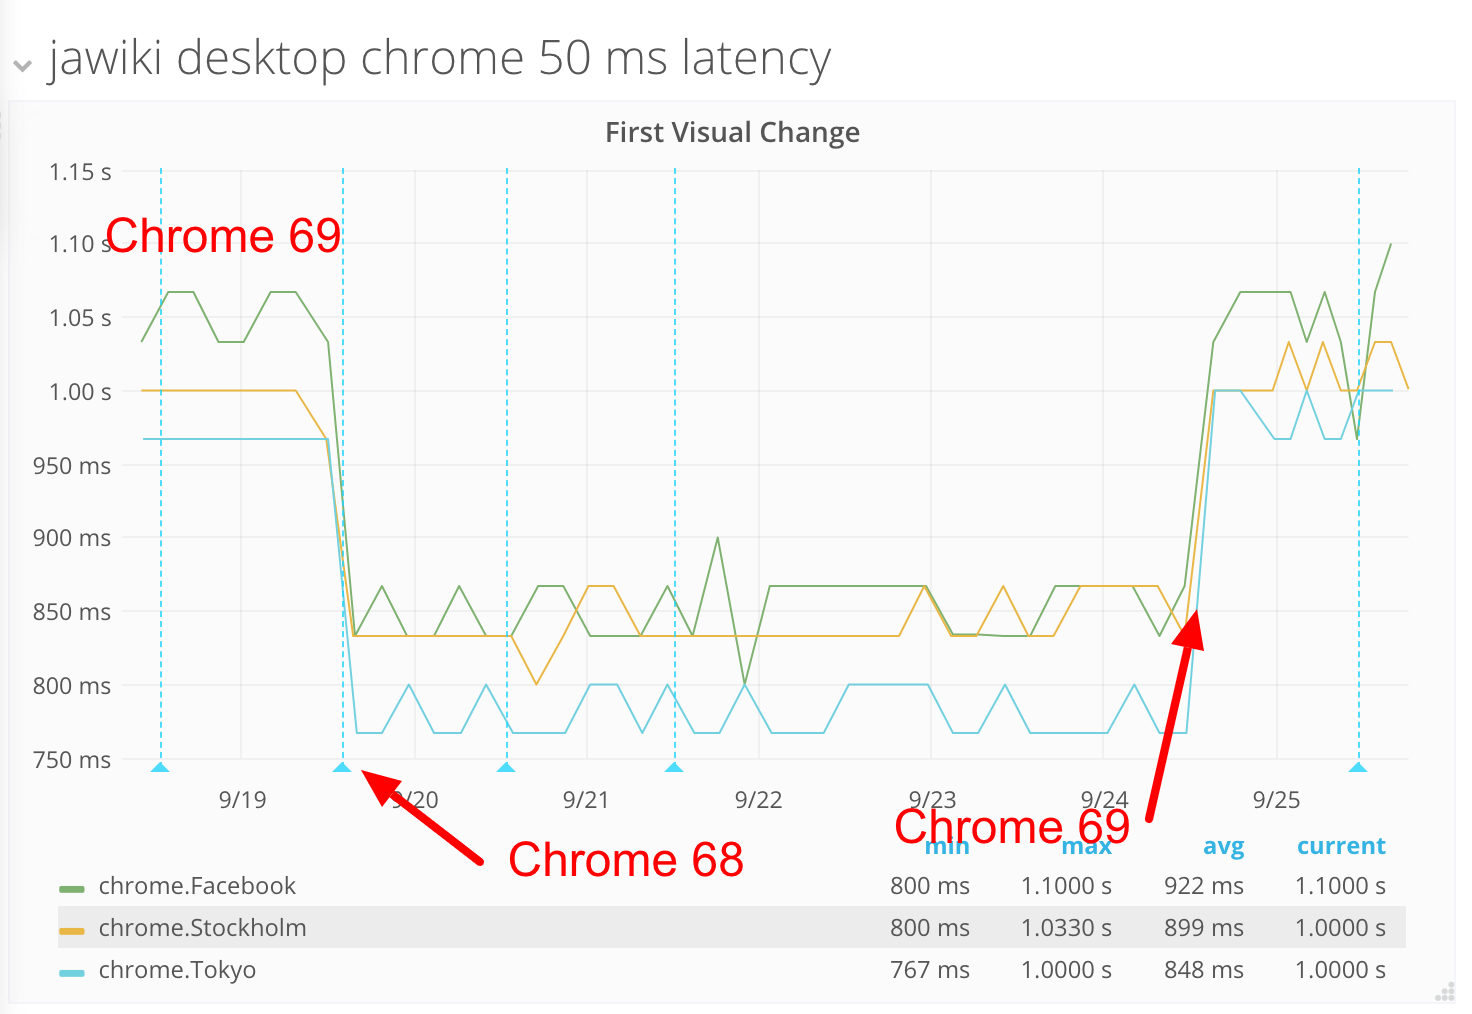
This time, it seems like a bigger impact on first visual change. We track this issue in T203543 and filed an upstream bug with Chromium.
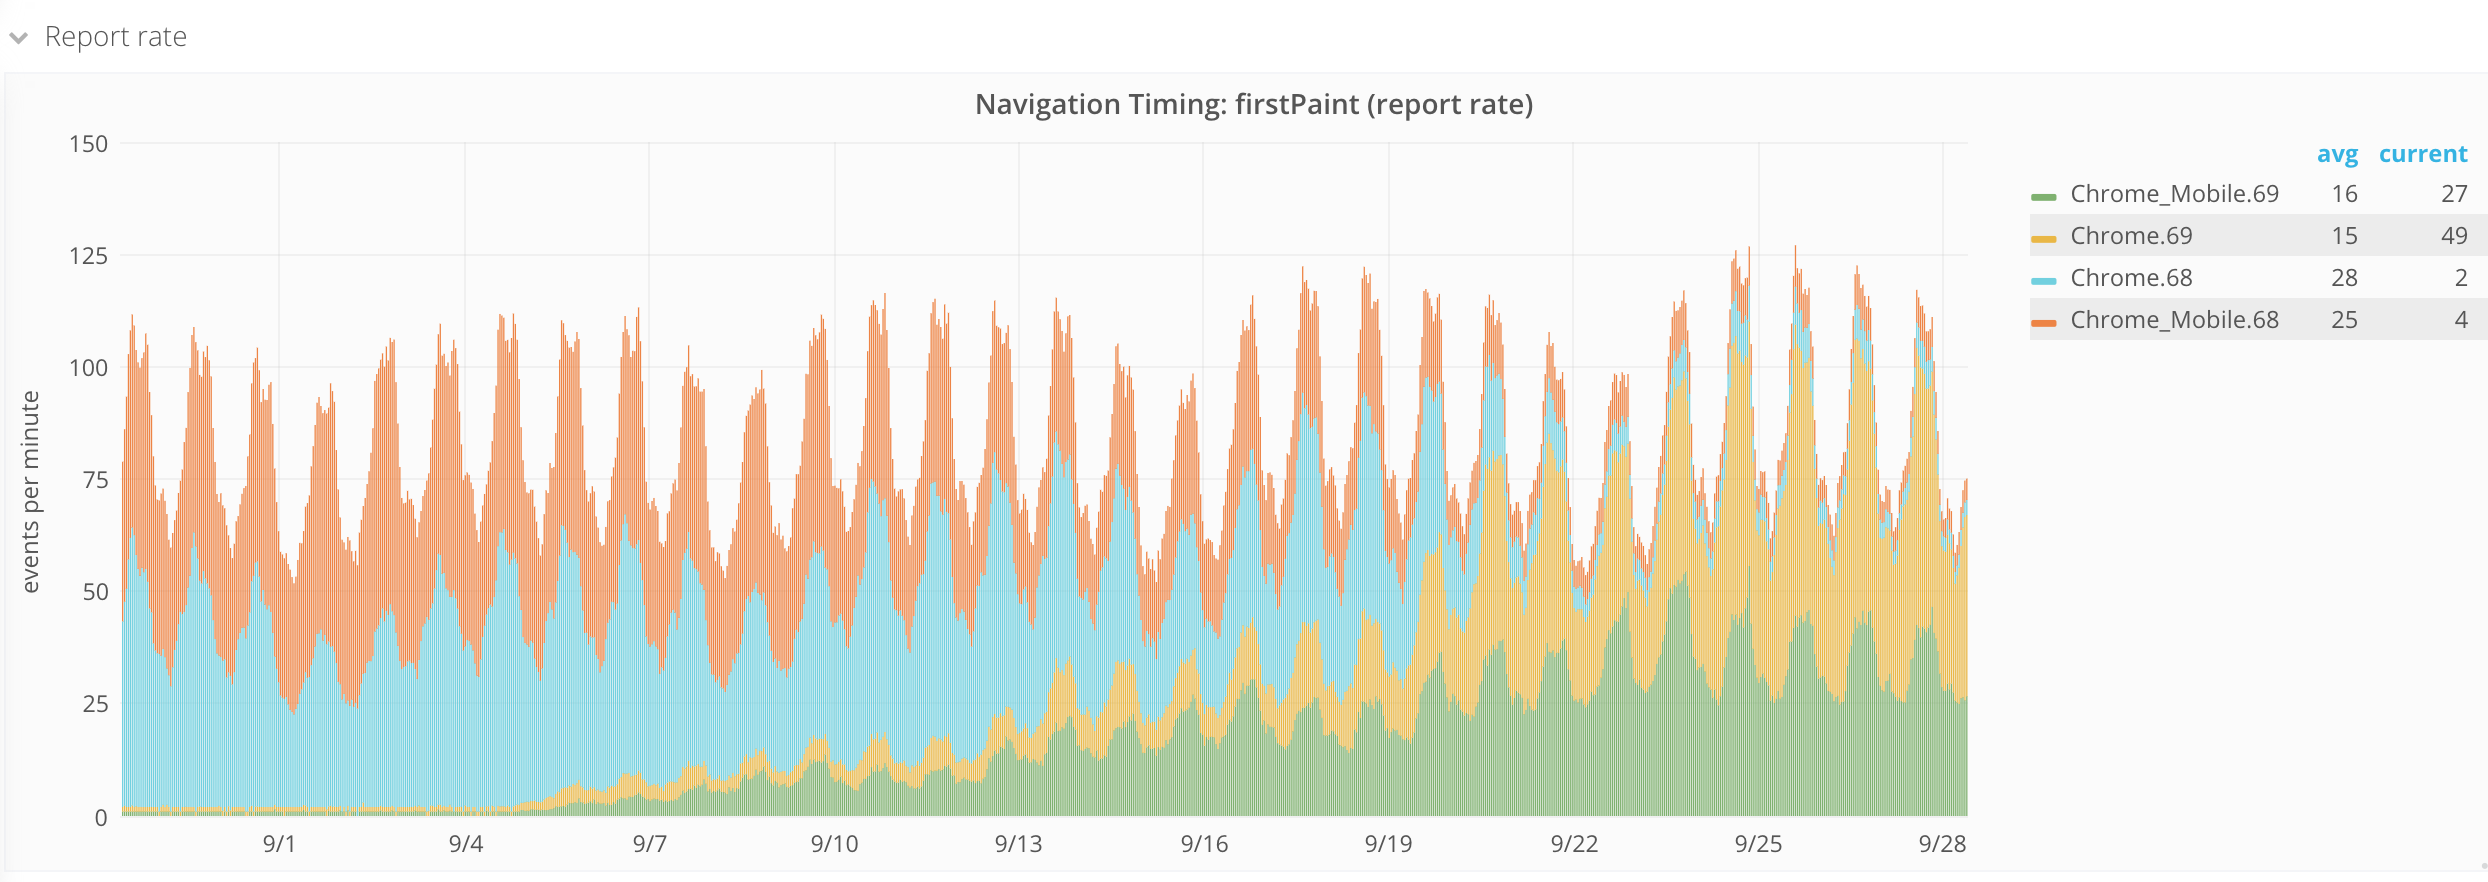
Is this the same regression as we see in RUM? Let us look again at when the majority of Chrome users switched from 68 to 69.
And then let’s go back to first paint metric. First, we look at our metric for desktop only. Around September 22nd almost all traffic was from 69, but you can also see that it was introduced in early September.
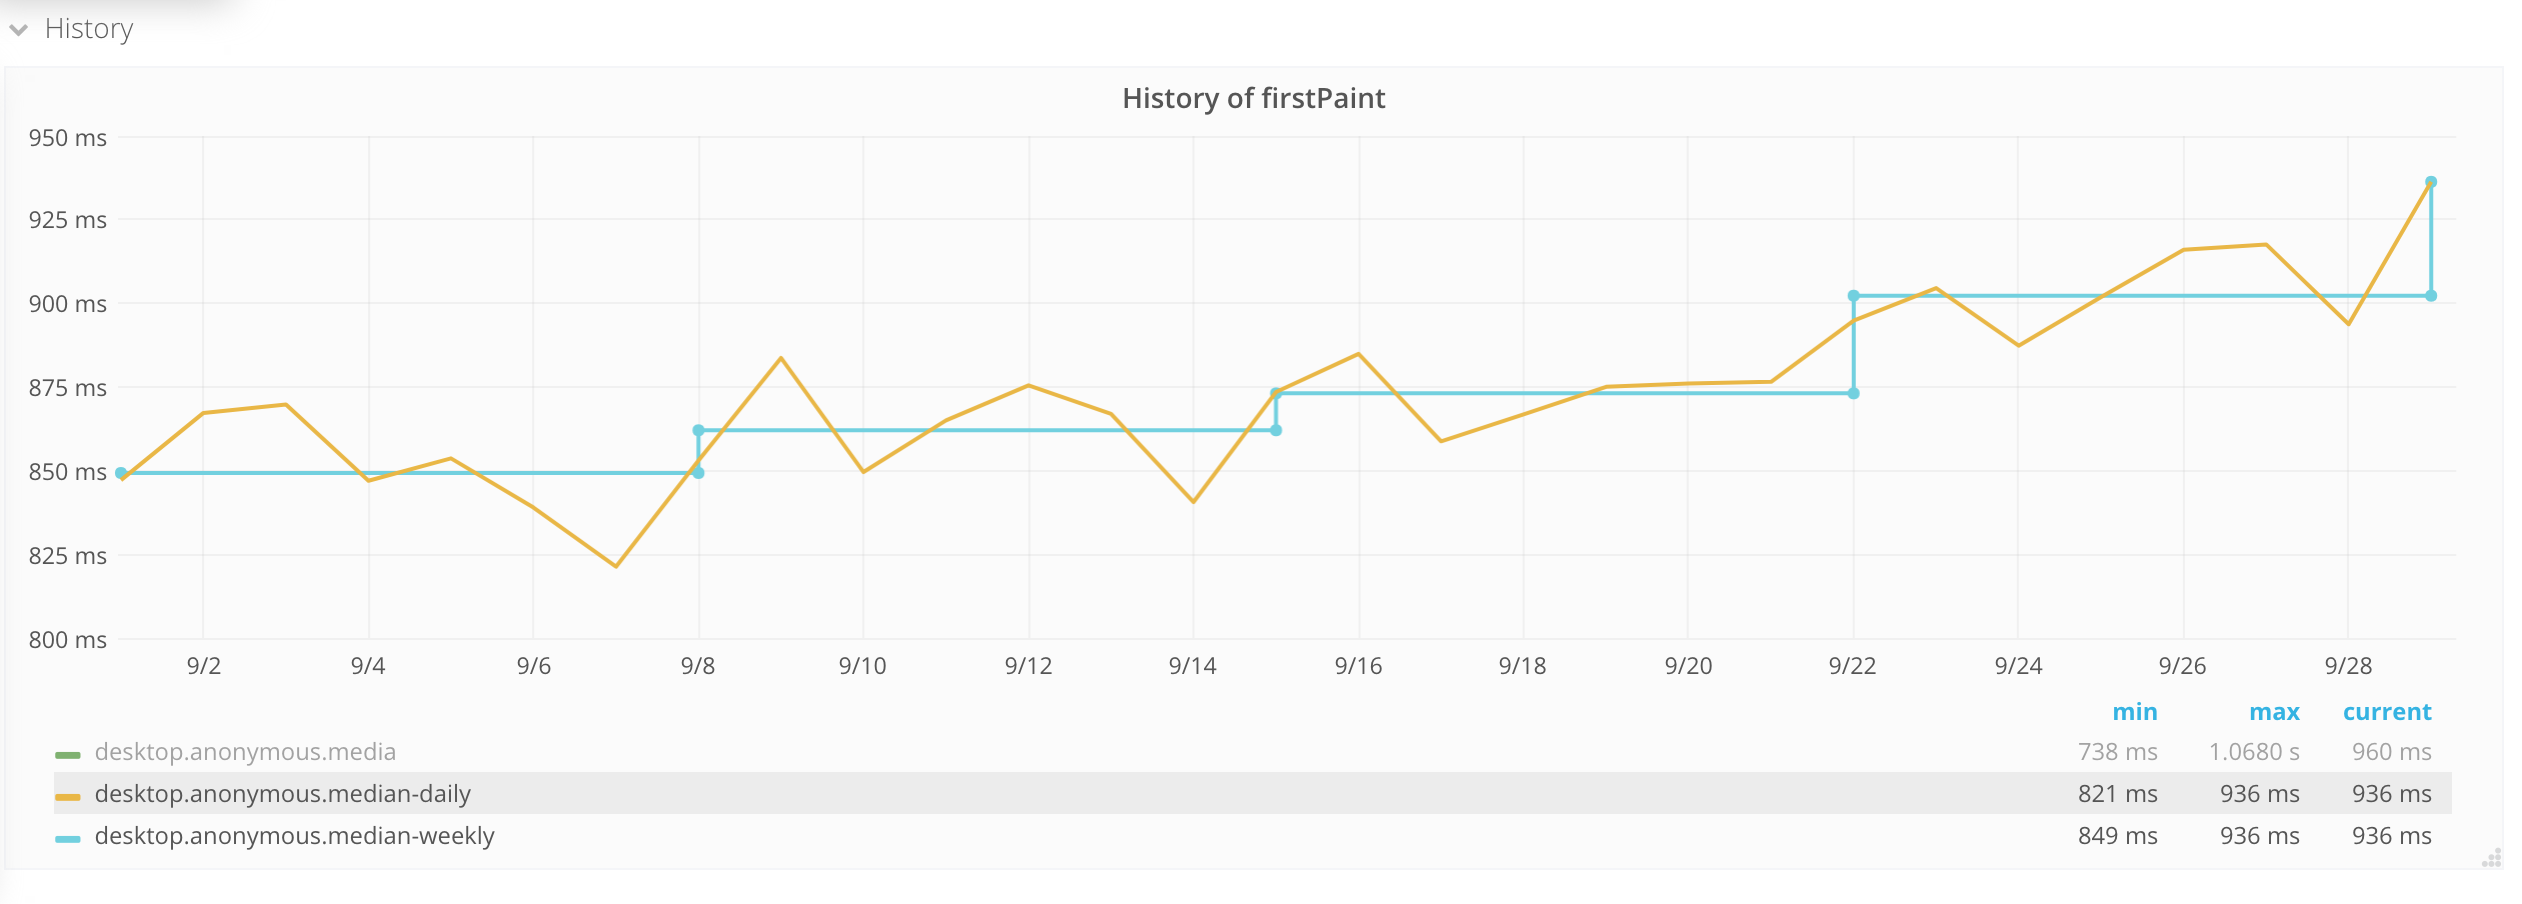
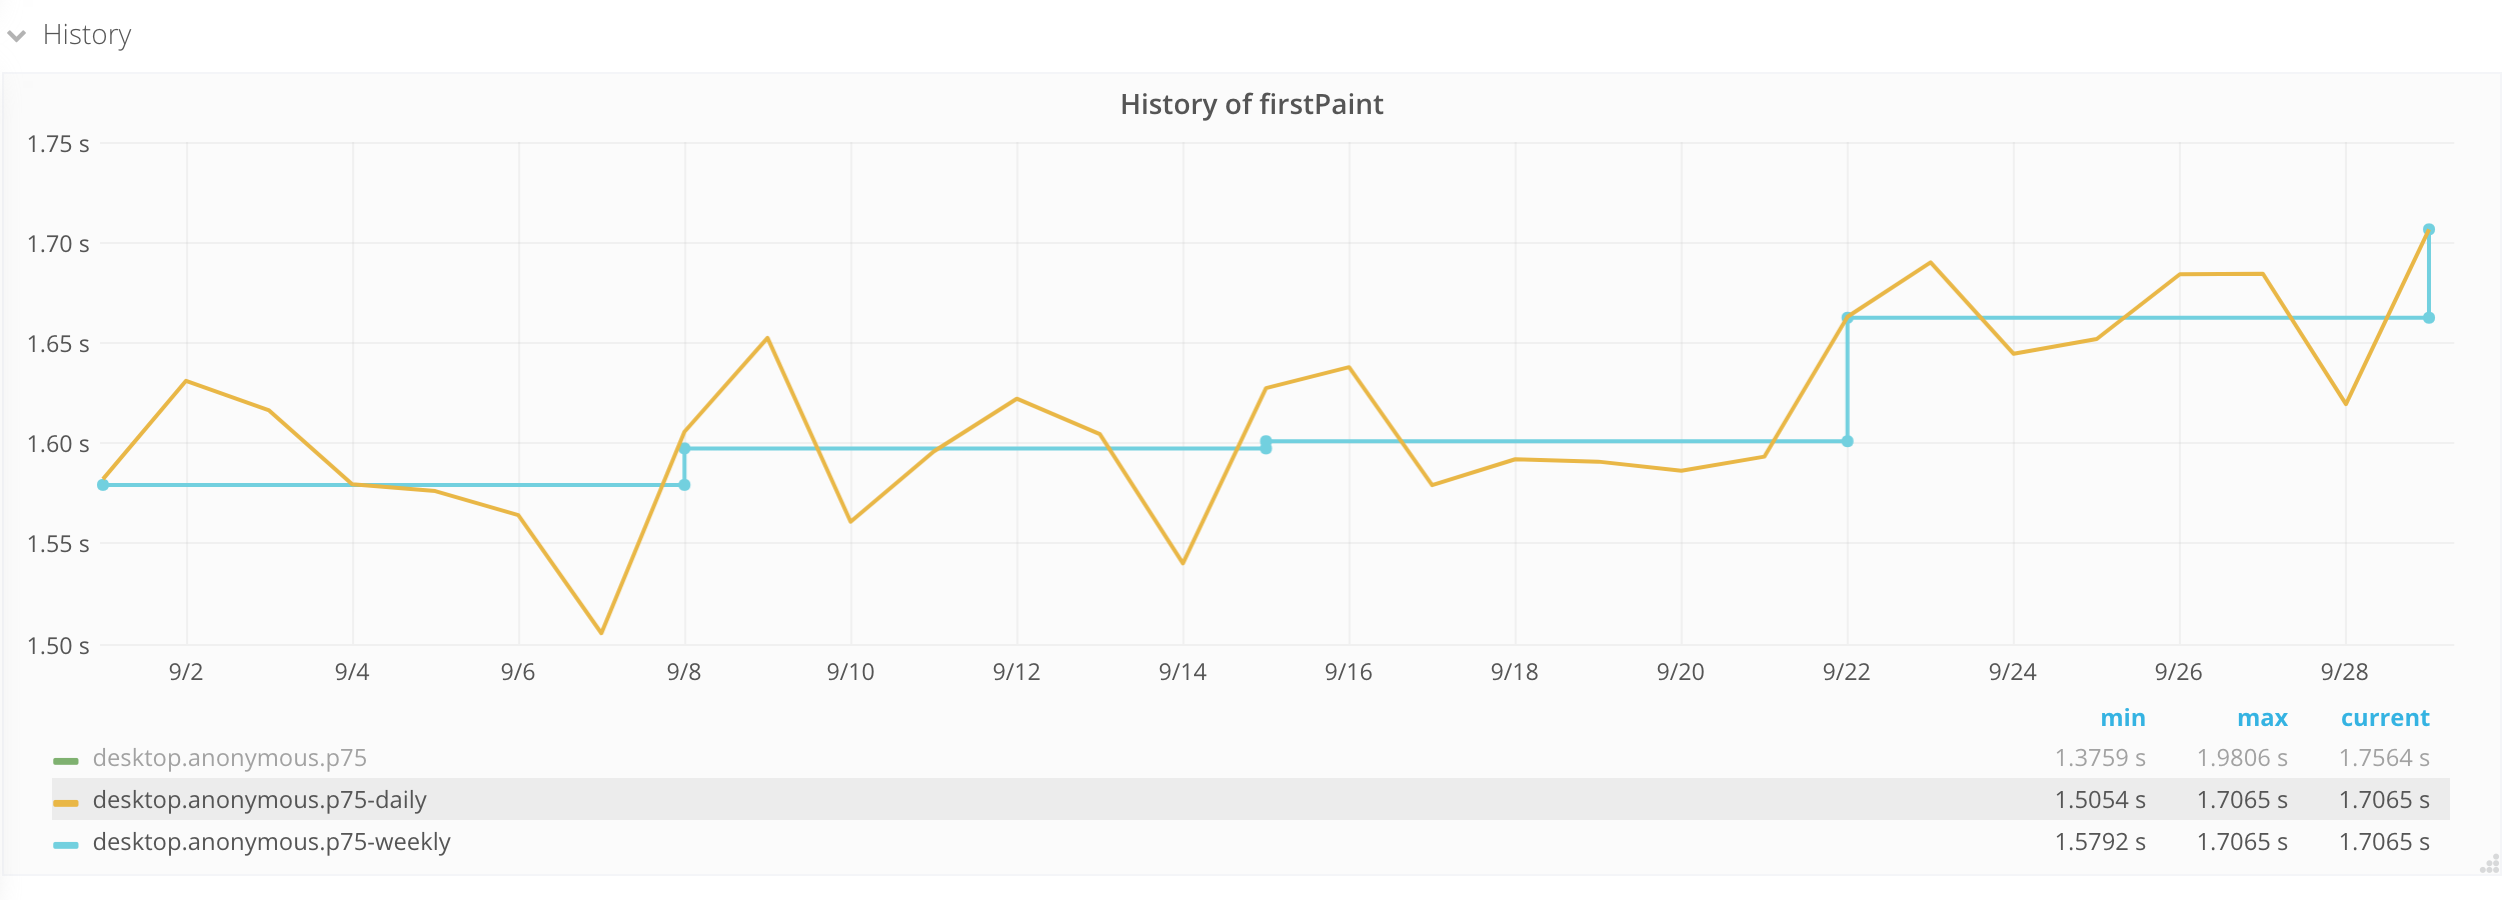
It looks like when Chrome 69 was introduced, first paint slowly rose and then when all our metrics were collected from 69, both median and 75th percentile were higher than with 68.
What does it look like for mobile?
We see the same pattern here. Let us check our synthetic testing at the same time, to see if we could have introduced a code change that affected first visual change. Our metrics on mobile are even more stable than desktop. We look at Swedish Wikipedia, because we didn’t deploy any change on that test server during this period.
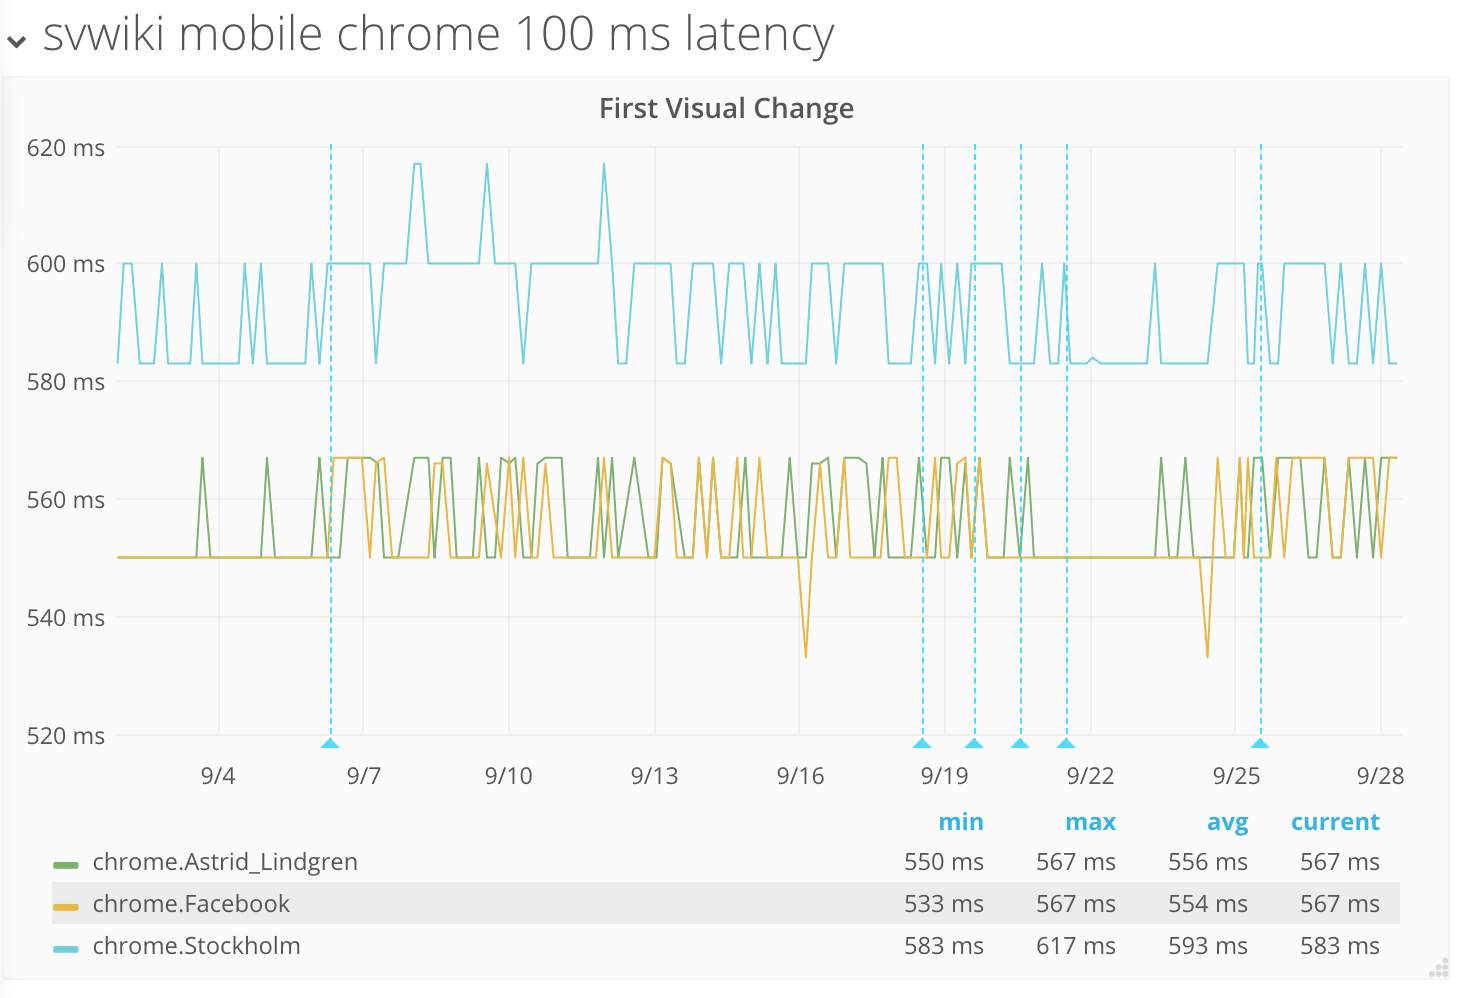
No regression there. It looks like this also could be a performance regression in Chrome.
Summary
Working with both synthetic metrics and metrics from real users, helps us to confirm issues. In this case, it helped us to find two browser regressions that impact our users. We hope that we can get help from the Chromium team to resolve these issues.
- Projects
- Subscribers
- MATRIXSHEREENLOMBARDI
- Tokens