Page MenuHomePhabricator

Tech community KPIs for the WMF metrics meeting
Closed, ResolvedPublic

Description

The next WMF Metrics and Activities meeting will be hosted on August 6, next Thursday. Let's try to bring our tech community KPIs. If we miss the deadline, then let's continue working to have this ready for the meeting in September.

Note that Quim still has to agree with Terry (owner of the meeting) what exactly should we provide. Updates about this will be published in this task as well.

The metrics agreed follow with some commentary. They will need to include the data from July.

Median age of open changesets

"Time from last patchset" at "Age of open changesets (monthly snapshots)" shows plausible values. Is that line credible today, or it is affected by T103292: Check whether it is true that we have lost 40% of (Git) code contributors in the past 12 months?

107562-1.png (273×652 px, 15 KB)

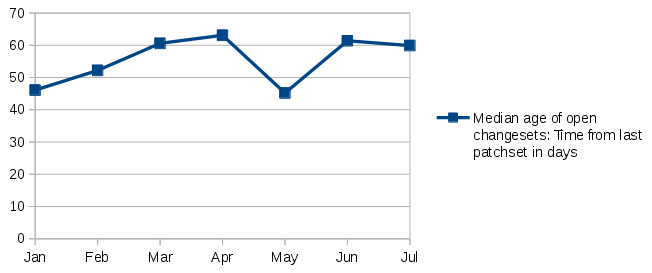
July 2015: 59.9 days

(Should we add Open changesets waiting for review?)

We didn't agree on this one before, but after putting together this list here it might make sense. The Gerrit Cleanup Day and following goals are all geared to reduce this queue. We'd better share a monthly update?

"Waiting for review" at "Backlog of open changesets (monthly snapshots)" shows plausible values. Is that line credible today, or it is affected by T103292: Check whether it is true that we have lost 40% of (Git) code contributors in the past 12 months?

107562-2.png (274×678 px, 20 KB)

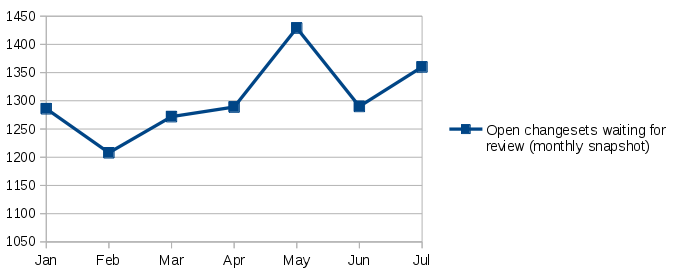
July 2015: 1360 changesets

New patches (changesets) submitted per month

The "submitted" line in "submitted vs. Merged changes vs. Abandoned" shows a relatively stable trend. Is that line credible today, or it is affected by T103292: Check whether it is true that we have lost 40% of (Git) code contributors in the past 12 months?

107562-3.png (278×670 px, 16 KB)

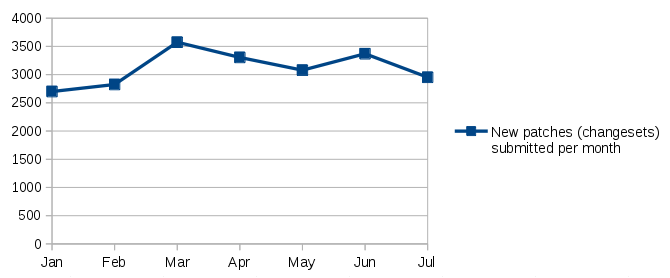
July 2015: 2953 changesets

Active Gerrit code review users per month

"Code review users" shows a trend for which we have no explanation today. The graph shows that current numbers are more or less as they were a year ago or before, but last Autumn and Winter there was a big growth of users that we have been losing since February.

Before getting into details, maybe we should simply demote this metric about Gerrit users and focus on Reviewers and Uploaders. http://korma.wmflabs.org/browser/scr.html shows more regular numbers. What is the useful contribution of users that log to Gerrit but don't upload or review patches? Are comments (with "0" vote) counted as reviews as well?

107562-4.png (271×693 px, 15 KB)

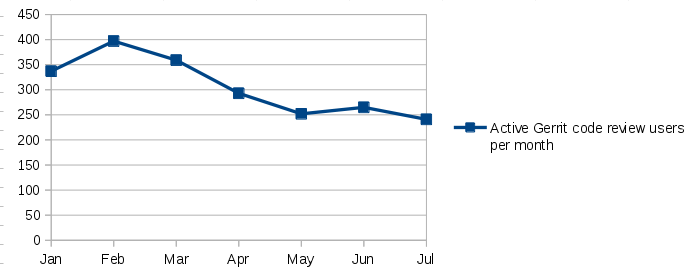
July 2015: 241 users

Related Objects

StatusSubtypeAssignedTask
ResolvedQgil
ResolvedAklapper
ResolvedLcanasdiaz
ResolvedLcanasdiaz
ResolvedLcanasdiaz
ResolvedDicortazar
ResolvedDicortazar
ResolvedDicortazar
ResolvedAklapper
ResolvedDicortazar
ResolvedDicortazar
ResolvedDicortazar
ResolvedDicortazar
ResolvedAklapper
ResolvedAklapper
ResolvedDicortazar
ResolvedDicortazar
ResolvedAcs
ResolvedDicortazar
InvalidDicortazar
ResolvedDicortazar
ResolvedDicortazar
ResolvedDicortazar
Resolvedjgbarah

Event Timeline

Qgil raised the priority of this task from to High.
Qgil updated the task description. (Show Details)
Qgil added subscribers: Qgil, Aklapper, Dicortazar and 2 others.

Dani is on vacation these days, and he is the most knowledgeable about those PKIs. We are already working on this, anyway. In particular, we're trying to see what's happening with T103292. We'll keep you informed.

This said, I guess September is going to be a more realistic timeframe.

I think both numbers about code changes and numbers about code review users still suffer to some extend from T103292 (e.g. I have that feeling that they also include activity from imported upstream repositories, like HHVM at that time).

So I don't think the numbers are 100% correct but I'd deter the decision whether that should stop us from using them this month already to others. But numbers should become more reliable in September, indeed.

I'm still waiting for the "final" July numbers to show up in korma before creating graphs of the last six months (which is what Terry proposed via email for the Metrics and Activity meeting).

Aklapper set Security to None.

(added charts and data for July month to initial task description)

@Aklapper, thank you, this is great. Terry wants me to present these metrics at the WMF Engineering management meeting on a monthly basis. This is another small step that should help increasing the awareness about these numbers and, hopefully, prioritize the work needed to improve them.

Let's see how these first events with these metrics go. Meanwhile, let's keep this task open to report any feedback.

I interpret the last comment as a "I'll change the assignee from Andre to Quim". :)

The casual presentation yesterday at the weekly WMF Engineering management meeting was interesting. They didn't dig much into the numbers because they reacted on previous considerations:

  • Are you saying that you are still not fully trusting these numbers?
  • Are these numbers good or bad? How do they compare with other large OSS projects?
  • Where is the documentation about the methodology used to get these numbers?

There were also arguments like whether thi isn't an intrinsic problem in any OSS project with a large history, and requests for a more specific description of the problem in order to know which kind of solutions should they implement.

All and all I was caught by surprise by this first reaction, which I found more defensive than expected. We need to do some homework and get past these first hurdles, so we can get to the next phase of this discussion: broad distribution of these numbers and a deeper discussion including self-critique and specific goals and plans to address the problems.

I will add bloques accordingly, and it would be great to solve them by the end of this month, or at least have a good enough progress not to get stuck at the same point in September.

I also wonder whether we should highlight the metrics specific to the MediaWiki Core repository. For several reasons:

  • It is easier to compare a single repository of a big OSS project like MediaWiki Core to other big OSS projects with long history sitting in a single repository.
  • It is fair to take MediaWiki Core as an internal reference for the rest. Projects showing worse code review metrics than our big complex project should receive special attention.
  • As of today MediaWiki Core is not centrally maintained by a single team or with a clear governance structure. Highlighting specific metrics for MediaWiki Core will help highlighting specific problems.

I have started "moving" content to https://www.mediawiki.org/wiki/Community_metrics#Key_performance_indicators. @Aklapper, unless you have a better idea, let's use that page for the next update in 1-2 weeks.

I welcome feedback about some open questions spread in this task (my bad):

  • "Active Gerrit code review users per month" keeps giving weird numbers. However, uploaders + reviewers + committers make a lot more sense. What about one graph with these three lines instead? These are the real active users. I'm still wondering whether people commenting without +1 -1 are not counted as reviewers, and whether that would be the explanation for the difference between "active users" and "reviewers".
  • Are these numbers good or bad? Especially the wait times to get a patch reviewed. How do they compare with other large OSS projects? Links welcome. I should check other users of Grimoire, maybe they have similar types of data i.e. median time. @jgbarah @Dicortazar, any pointers?

About adding MediaWiki core data (see above), I think it is a good idea. Now it is not easy to find, and it's very illustrative. On July 2014 the media age of open changesets was 22 days. Now it's 110!!! The amount of new changesets and changesets waiting for review is quite stable. This probably means that there is a pocket of patches getting older and rotting.

Right now the URL is http://korma.wmflabs.org/browser/gerrit_review_queue.html?page=10 but it might change. I'm adding a screenshot for convenience.

Screenshot from 2015-08-27 13-57-51.png (873×1 px, 125 KB)

The next Metrics meeting is next Thursday. @Aklapper, let's try to decide by our 1:1 on Monday what exactly we want to propose to Terry for that meeting.

I propose to post the data and graphs to https://www.mediawiki.org/wiki/Community_metrics#Key_performance_indicators instead. Even better if the graphs are vector based, or if you upload the source files (LibreOffice, I guess?) somewhere, so people (like) me can check the data, resuse/ improve the graph, etc.

I have started "moving" content to https://www.mediawiki.org/wiki/Community_metrics#Key_performance_indicators. @Aklapper, unless you have a better idea, let's use that page for the next update in 1-2 weeks.

No better idea until I fix T100978.
I've dropped the current korma data into that wikipage as on-wiki graphs. Need to recheck/update on-wiki data once T103984 etc is fixed.

Sounds good to me and currently more reliable (however I need to read the docs of the MediaWiki Graph extension how to have lines and put several lines into one graph).

I'm still wondering whether people commenting without +1 -1 are not counted as reviewers, and whether that would be the explanation for the difference between "active users" and "reviewers".

I hope the Bitergia folks can comment on that.

What about one graph with these three lines instead?

Done, though I still need to figure out how to set a proper offset for the x axis.

Even if Terry told us to show the data of the last 6 months, I think our curves are better understood with a 12 month cycle. No need to change anything now, but the data for the next month could include the 12 months. @Aklapper, does this make sense to you as well?

curves are better understood with a 12 month cycle.

I agree. Done.

Some progress: we are presenting solid metrics for the first time in a quarterly review, next Monday. The slides will be published after the review, but I have copied the data at https://www.mediawiki.org/wiki/Developer_Relations/Weekly_summary#Jul-Sep_2015

It looks nicer in tables with red/green indicators. :)

I'm closing this one. The incentive of the metrics meeting and the WMF Engineering meeting has been useful to get these KPIs running. We are updating them every month, we are featuring them in our Developer Relations Weekly News, and we are of course featuring them in our quarterly reviews. I think the mission has been accomplished.