too many false positives alarms are triggered at this time
Description
Description
Details
Details
| Subject | Repo | Branch | Lines +/- | |
|---|---|---|---|---|
| Change percentage in EventLogging validation alert | operations/puppet | production | +2 -2 |
Related Objects
Related Objects
Event Timeline
Comment Actions
Related to data not showing up in graphite at same rate.
Maybe making the alert check for past 5 minutes could at least solve of the issue ?
Comment Actions
Current hypothesis:
The metric's poor sync creates the false alerts.
The raw vs validated metric is a diff metric, this means it is a subtraction of two metrics: eventlogging.overall.raw.rate and eventlogging.overall.valid.rate. A common problem with diff metrics is that they do NOT update in sync. For example, eventlogging.overall.raw.rate may have its full value for its last measure, while eventlogging.overall.valid.rate is still 20% in its last 2 measures (this has been observed in graphite many times). When you subtract metrics out of sync, you get a corrupted diff metric.
To prove this hypothesis and potentially solve the problem the proposal is to modify the alert and make it resistant to poor sync.
Comment Actions
I think the simplest option is to modify the percentage of data points needed to trigger the alert.
Currently the alert is triggered when 3 out of the last 15 measurings go over the threshold. If we force it to be 4 out of the last 15 measures over the threshold, it will be more difficult to have a false alert. This could also make a real alert take more time to trigger, but it seems given the situation we are OK with being more conservative when raising alerts.
Comment Actions
Change 230825 had a related patch set uploaded (by Mforns):
Change percentage in EventLogging validation alert
Comment Actions
If we merge that, we should test that the alert is still working by for example:
Sending some invalid events to production using the test_load.py script.
Comment Actions
Responding to Josephs CR comments here, because it's easier to quote his lines, and the explanation may be of interest to others.
there is a 'from => 15min' value, but the metric is movingAverage over 10 points, so does that mean we count 10 points from 15 minutes back in time?
The 'from => 15min' parameter indicates that only last 15 minutes (of both metrics) should be retrieved from graphite to calculate the metric. After that, the alert's metric 'movingAverage(diffSeries(eventlogging.overall.raw.rate,eventlogging.overall.valid.rate),10)' is calculated over that initial data. So movingAverage will soften the initial 15 values by averaging their previous 10 values. Side effect: The latest values will have up to 10 previous values to be softened with. Oldest values will have a shorter window to be softened with. The oldest value won't be softened, because it has no previous values. After this softening is applied, the alert will be triggered, if and only if 3(4) of the 15 softened measures is above the threshold. Does this make sense?
Finally, I think we should add 'absolute' to the function for handling negative variations (even if they shouldn't occur).
I think that is a good idea :]
Comment Actions
Thanks for vocal explanations :)
Let's add the absolute function and try it as you suggest.
Comment Actions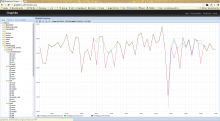
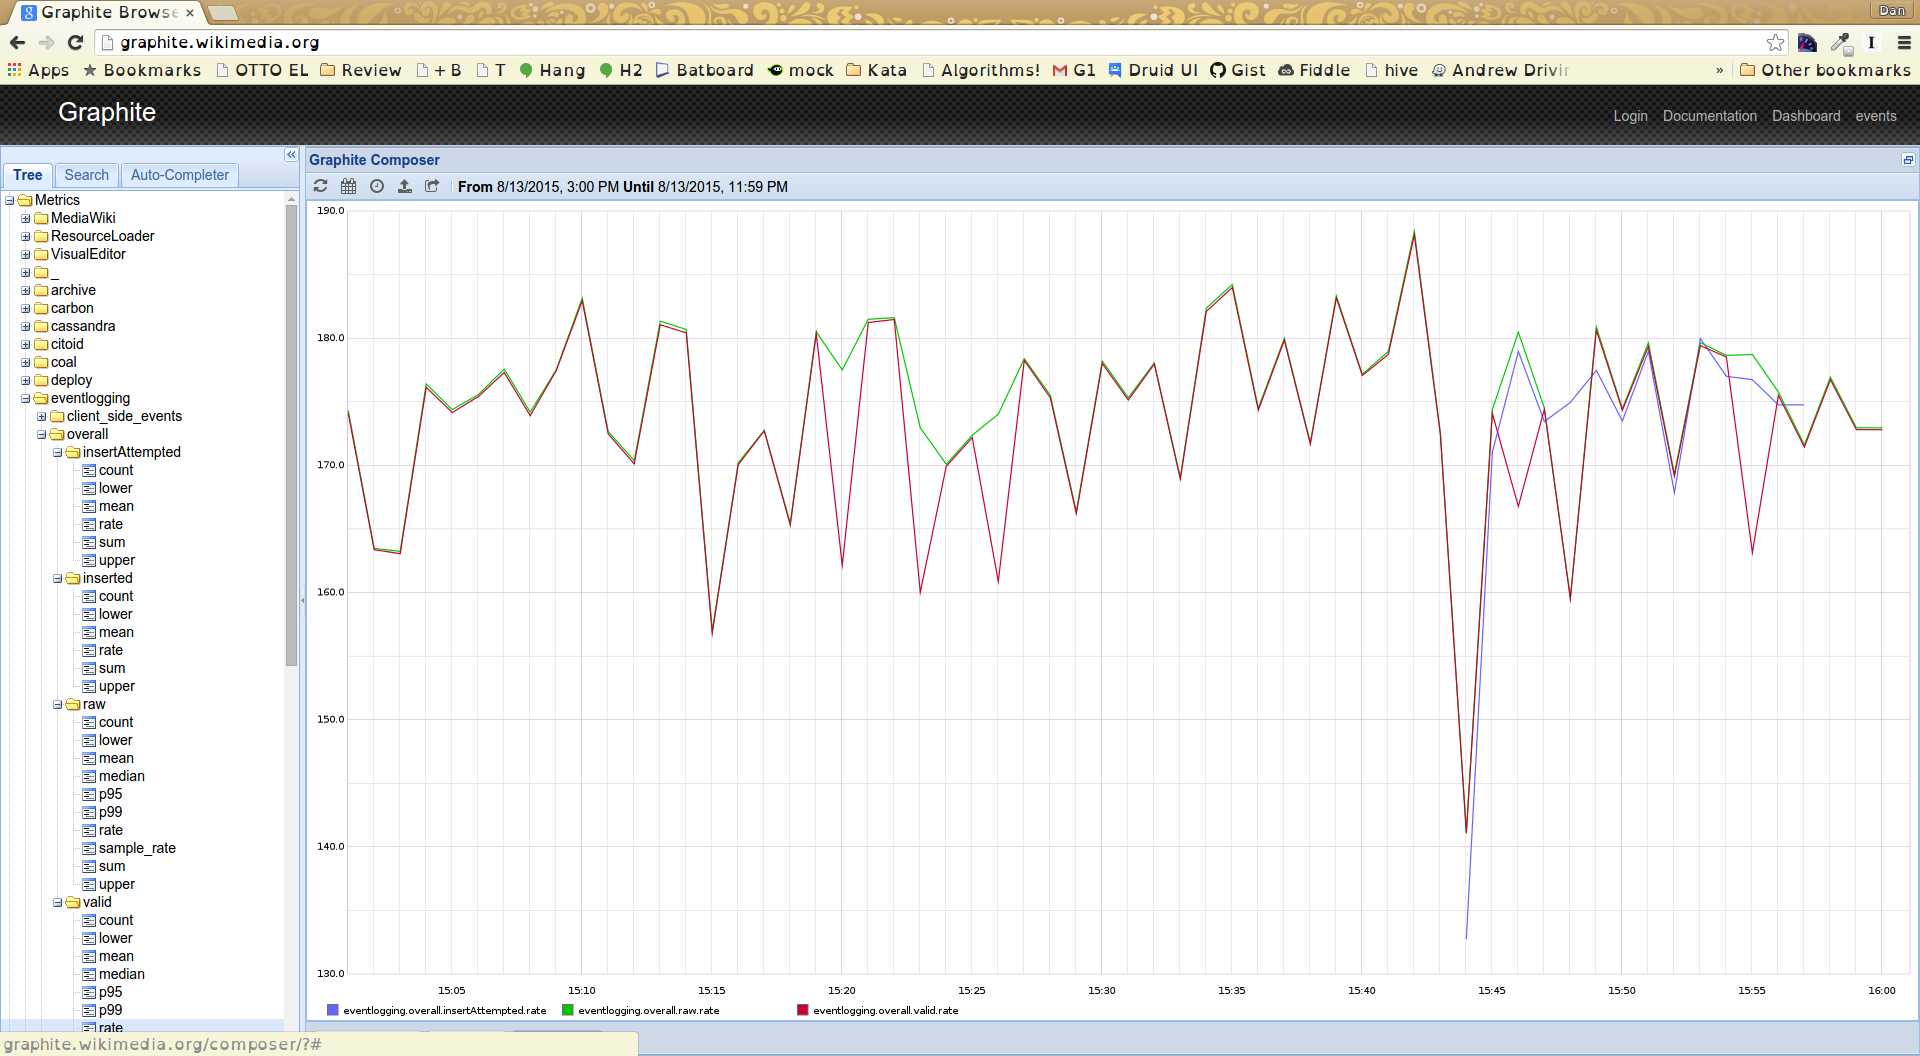
There's something else weird going on here. It seems to me some of these metrics are either reported incorrectly or at least graphed incorrectly by graphite. Check out the attached image. Valid is lower than Raw in some cases, but InsertAttempted is higher than Valid. That makes no sense, invalid events don't make it to insertion.
Comment Actions
Oh, that's interesting. It also seems to me that there's an error in reporting (or graphing).
There's a buffer between validation and insertion, so the two do not need to be exactly the same, but it seems clear that something weird is going on.
On the other hand, I think this may not necessarily be related to the alerts, because I can not match these peaks with the alert times... Dunno
Comment Actions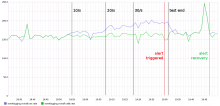
The alert was triggered 10 minutes after the number of invalid events went over the threshold.
And the recovery triggered 15 minutes after stopping the invalid event requests.
I think this is expected and OK.
The false alerts have ceased and the true alert test was successful, see the details here:
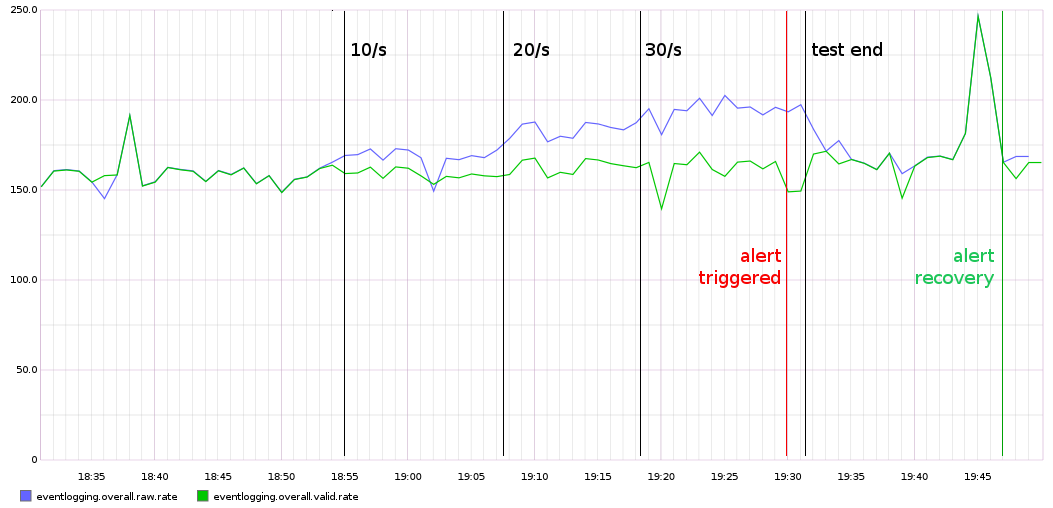
The alert was triggered 10 minutes after the number of invalid events went over the threshold.
And the recovery triggered 15 minutes after stopping the invalid event requests.
I think this is expected and OK.