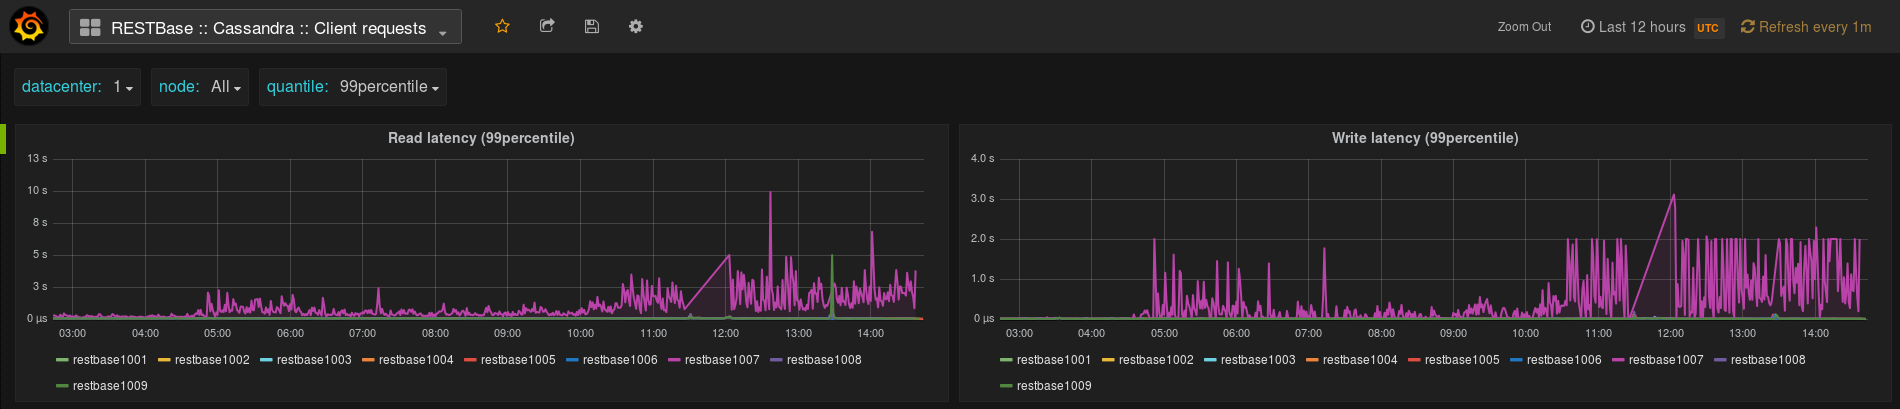
Earlier this morning Cassandra on restbase1007 OOMed unexpectedly. Grafana also shows elevated read latencies in the last seven days:
The Cassandra instance was restarted after the OOM, but read latencies are still elevated.
| • GWicke | |
| Oct 27 2015, 10:39 PM |
| F2897788: pasted_file | |
| Oct 30 2015, 2:28 PM |
| F2897798: pasted_file | |
| Oct 30 2015, 2:28 PM |
| F2892929: rx_tx.png | |
| Oct 29 2015, 6:25 PM |
| F2885569: cf-latency.png | |
| Oct 28 2015, 3:01 PM |
| F2885548: requests.png | |
| Oct 28 2015, 3:01 PM |
| F2885539: network.png | |
| Oct 28 2015, 3:01 PM |
| F2885532: latency.png | |
| Oct 28 2015, 3:01 PM |
| F2883284: pasted_file | |
| Oct 27 2015, 10:39 PM |
Earlier this morning Cassandra on restbase1007 OOMed unexpectedly. Grafana also shows elevated read latencies in the last seven days:
The Cassandra instance was restarted after the OOM, but read latencies are still elevated.
| Status | Subtype | Assigned | Task | ||
|---|---|---|---|---|---|
| Resolved | Eevans | T116859 Investigate recent Cassandra cluster performance issues | |||
| Resolved | • GWicke | T116861 Investigate OOM and elevated read latencies on 1007 | |||
| Resolved | • Pchelolo | T116933 Review mobile apps storage strategy, and look into retention policy select scaling | |||
| Resolved | • GWicke | T117115 Use Date-Tiered Compaction Strategy for time series and revisioned data | |||
| Resolved | Joe | T116739 restbase endpoints health checks timing out | |||
| Resolved | Joe | T116770 service_checker reports success even on endpoints timing out | |||
| Resolved | • mobrovac | T116911 restbase endpoint reporting incorrect content-encoding: gzip |
A couple more notes:
[15:52] <urandom> some angry red disk errors in dmesg
[15:52] <urandom> for ata2
[15:52] <gwicke> yeah, but those are very old
[15:53] <gwicke> latest timestamp is 7933825, last error at 4575459
[15:54] <gwicke> given 92 day uptime, that was about 38 days ago
Not sure if this is relevant, but it seems that the swap array is pending on 1007:
gwicke@restbase1007:~$ cat /proc/mdstat
Personalities : [raid0] [raid1]
md0 : active raid1 sdb1[1] sda1[0]
      29279232 blocks super 1.2 [2/2] [UU]

md2 : active raid0 sda3[0] sdb3[1]
      1939599360 blocks super 1.2 512k chunks

md1 : active (auto-read-only) raid1 sda2[0] sdb2[1]
      976320 blocks super 1.2 [2/2] [UU]
        resync=PENDING

unused devices: <none>Rebooted 1007 now, restarted instances, and ran sudo mdadm --readwrite md1 to get md1 back into read-write mode. Lets see if this changes anything about read latencies.
Cassandra on 1007 died yet again today at 11:35 UTC:
(11:35:01) icinga-wm: PROBLEM - service on restbase1007 is CRITICAL: CRITICAL - Expecting active but unit cassandra is failed
(11:36:00) icinga-wm: PROBLEM - Cassandra CQL query interface on restbase1007 is CRITICAL: Connection refused
Grafana shows elevated GC times.
Just to add to this: This was another OOM exception. It looks like things started going south at somewhere around 5a, and got progressively worse until the crash at 11:30a. Since heap dump files are not currently getting unique names, I've moved the heap dump to a sub-directory of my home on 1007 (/home/eevans/2015-10-28_OOM), and will begin an analysis.
Update:
I'm still working this problem, and don't yet have an answer, but thought it might be helpful to summarize where we are.
The read request latency metric seems to be worsening, and write latency is looking quite bad as well.
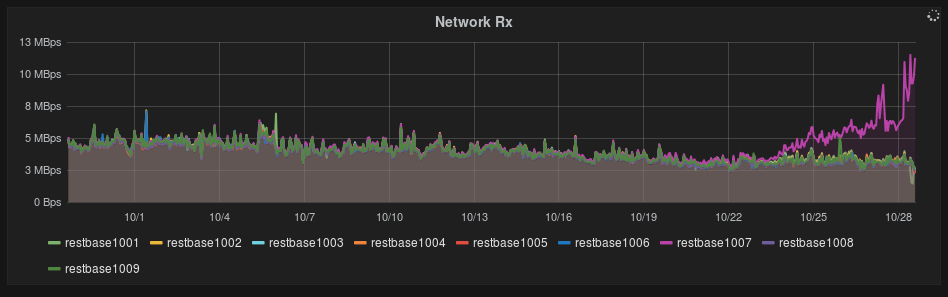
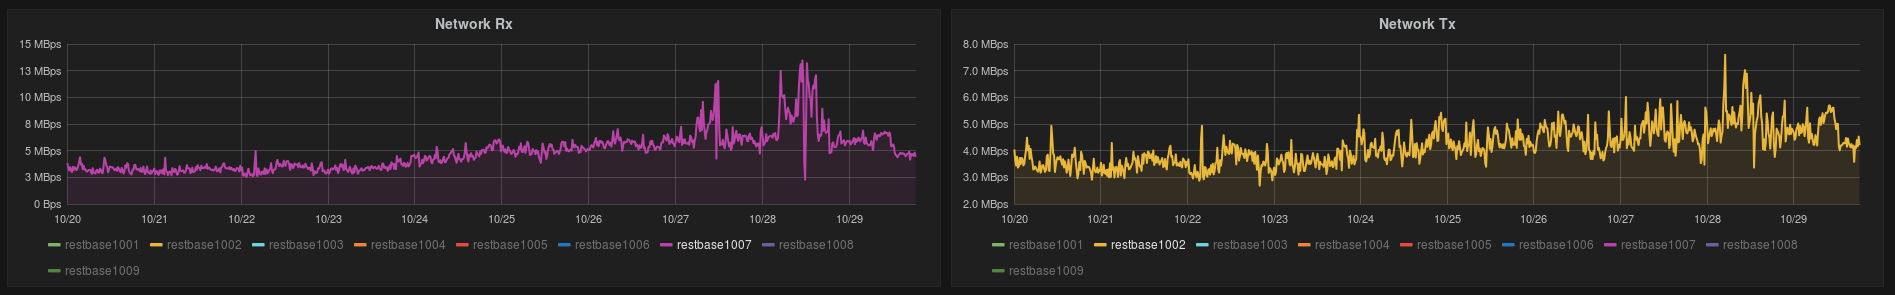
Interestingly, received bytes on this node is higher too, and the timing correlates with the increased latency.
This additional traffic does not appear to be explained by additional requests, those seem on par with the other nodes.
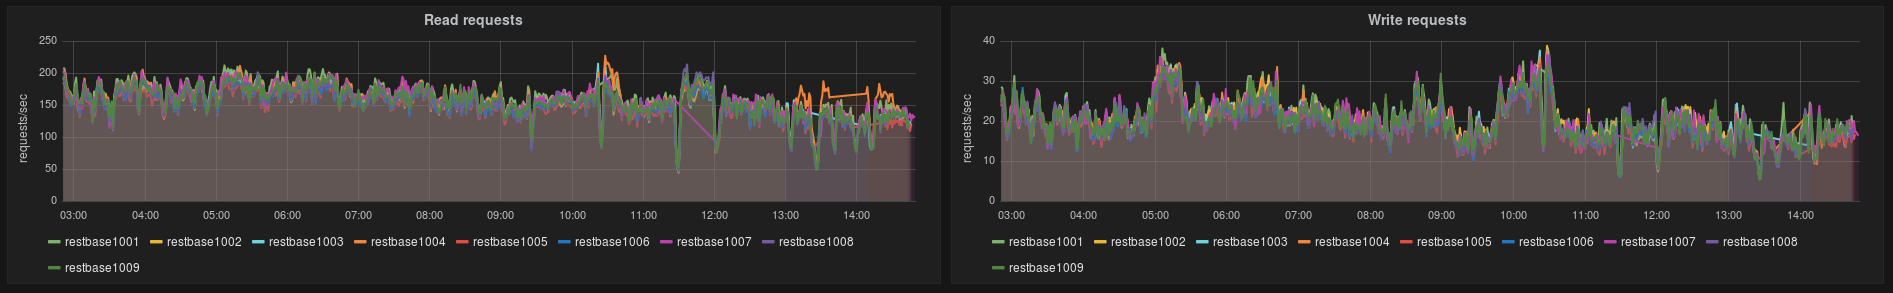
Also of note, the request latency metric comes from Cassandra's StorageProxy#read, basically, it's timing how long it takes for the local and remote reads. Local reads don't seem to be the issue...
... so next steps will by to try to isolate which non-local parts of read() are the issue.
As for the heap dumps:
Yesterdays (3.8G) dump is... inconclusive. I can't make sense of what I'm seeing. Today's (16G) dump has proven too large for me to open, so @fgiunchedi is presently transferring the dump to his machine, so we can try to analyze it there.
I have restarted 1007 with a 20G heap, as well as a sligthly lower initiation threshold (30%) and target latency (150ms). The hope is that this will buy us time and possibly lower latencies, while we establish what exactly is causing the memory shortage. https://gerrit.wikimedia.org/r/#/c/248960/ also just lowered the heap size from 16G to 12G; we might want to re-consider the heap size change.
The increased inbound traffic is interesting.
It doesn't seem to be matched by an equivalent outbound traffic increase. This would make it less likely that the Cassandra driver selects restbase1007 more often as the coordinator node, as that should also result in an increase in outgoing traffic.
A change in request sizes could perhaps explain this. The gradual increase in incoming traffic would suggest that it's an accumulative effect. We had a bug causing repetitive escaping before, so I wonder if a similar issue could be at work here. On the other hand, the effect seems to be localized to one node, which would be less likely if this was a general bug across the cluster.
FTR that is a mdadm mode where the underlying devices haven't been written to yet, in the md1 case that's because the machine hasn't touched swap yet but it'll go readwrite by itself as soon as that happens, it isn't related to cassandra latencies in any way
Something of note, the 'aberrant data/one-bad-row' theory seemed to be contradicted by a lack of corresponding outbound bandwidth on other nodes. However, (courtesy of @fgiunchedi), there does appear to be a corresponding increase on 1002, 1004, and 1006. It's easier to see this in a per-host breakdown on Ganglia.
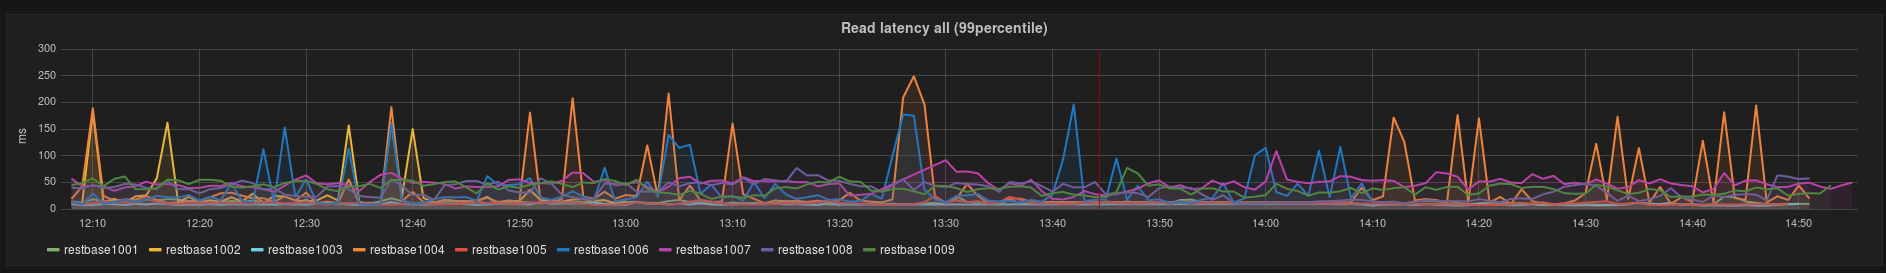
You can see this in Grafana as well, if you fiddle with scale, and isolate the hosts:
As of about 5:30 am (UTC) this morning, client read latency has nearly converged (though while it would appear that 1007's latency has lowered somewhat, the other 8 machines seem to have increased some).
Received bytes have similarly converged.
Here is a recollection of what I learned while looking into this:
Because of a bug, the page_revisions table got a write on each re-render, accumulating hundreds of thousands of revision entries per title over time. The write rate was around 200-300/s, with some articles being re-rendered about once per minute on average. An additional bug in the monitoring spec deployed earlier in the week (requests with no-cache) caused the page 'Foobar' to be re-rendered on each monitoring script run, on any node.
Reads and compaction of those very wide rows caused high IO load, which in turn caused compaction to fall behind a little, leading to a higher density of tombstones (except in the revision table) & a higher number of SSTables involved in reads. Range reads for revisions were accessing a high number of entries from many SSTables, resulting in large memory consumption.
Steps we took to resolve this:
Created T118524 for proactively alerting on similar anomalous storage trends in the future.