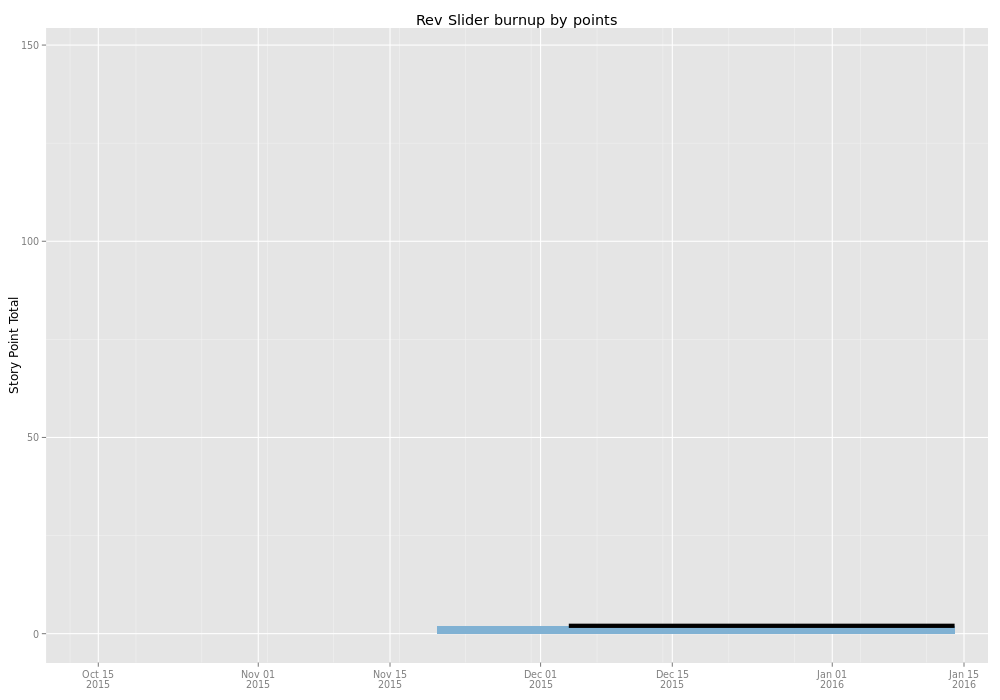
This is a burnup chart from the CT Rev Slider tranche as of 2016-01-13, shows a graph which is very difficult to interpret. I'm thinking if the Y axis only went up to 10, instead of 150, I might be able to distinguish the scope line (blue?) from the done line (black?).
OPTIONS:
- leave as-is. Allows comparison between burnups.
- Scale each one indepnedently. Ensures each burnup is readable, but they aren't at the same scale for comparison.
- Both, somehow. This would require new dev work (1 and 2 wouldn't).