Page MenuHomePhabricator

Investigate massive increase in htmlCacheUpdate jobs in Dec/Jan
Closed, ResolvedPublic

Description

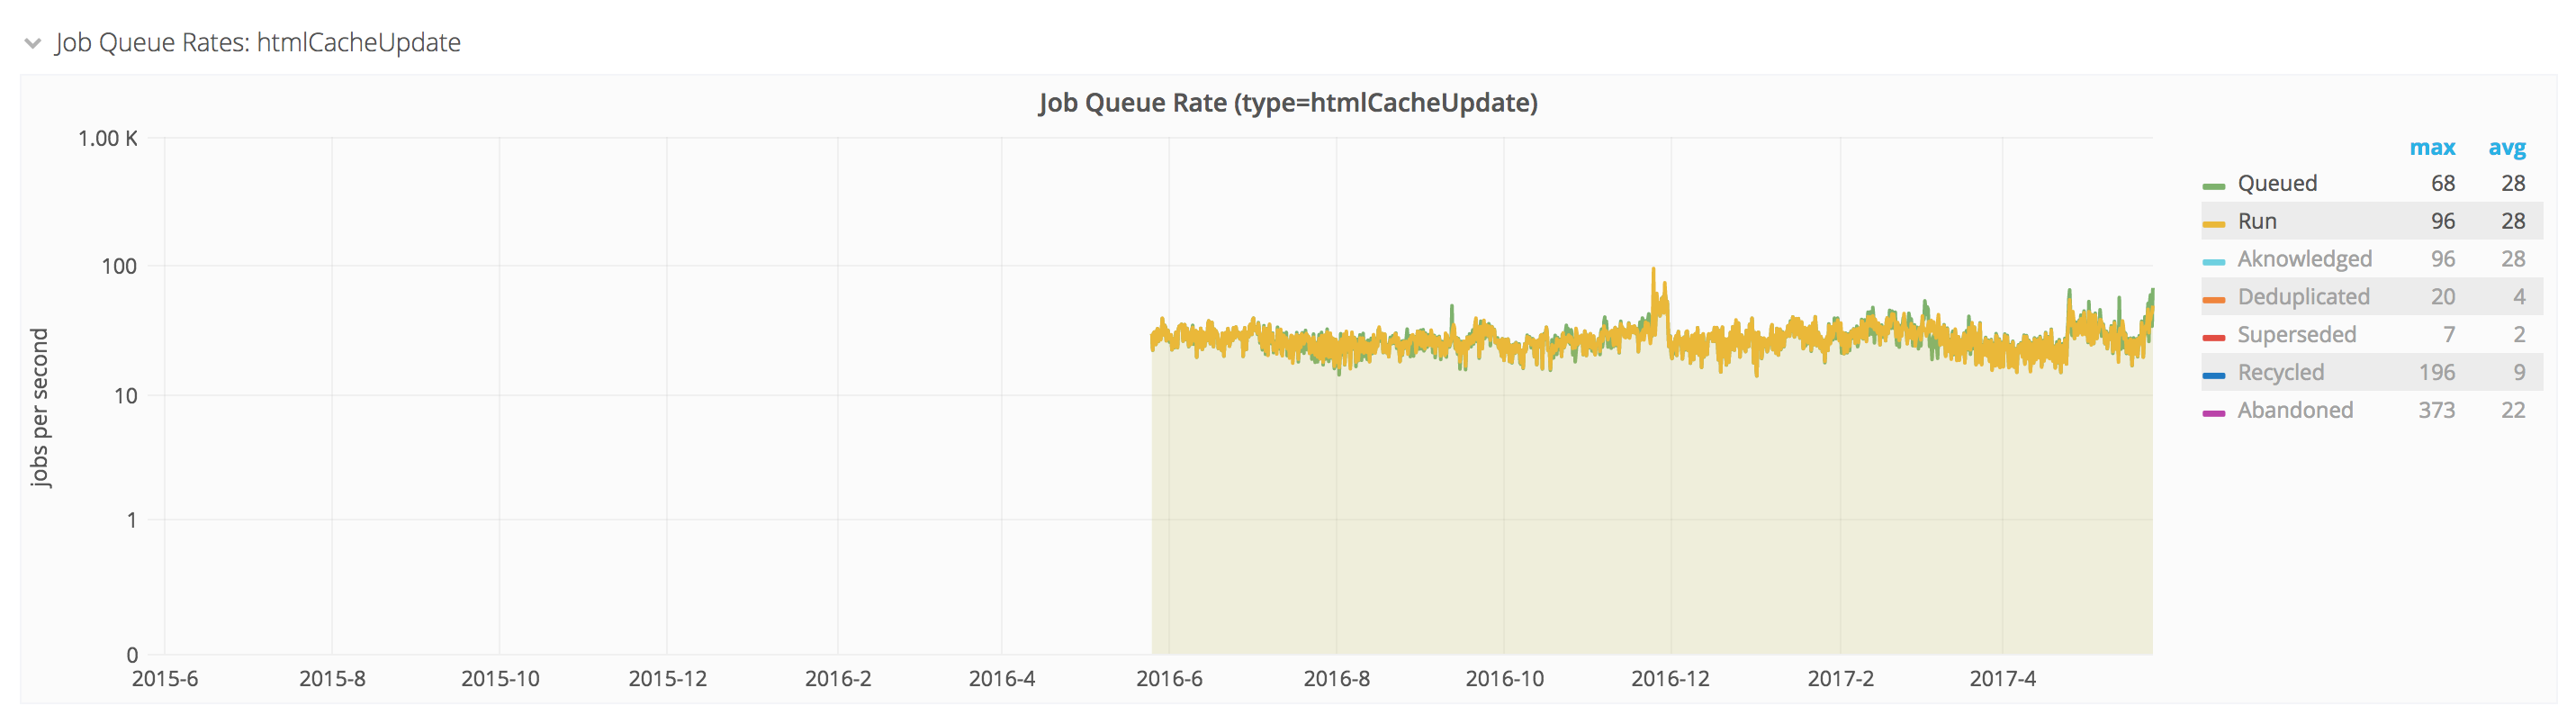
tl;dr - What are the causes for the multiple steps of massive rate increase in the insertion of htmlCacheUpdate jobs shown here? http://graphite.wikimedia.org/render/?width=586&height=308&_salt=1453466175.547&target=MediaWiki.jobqueue.inserts_actual.htmlCacheUpdate.rate&from=-180days

Known background:

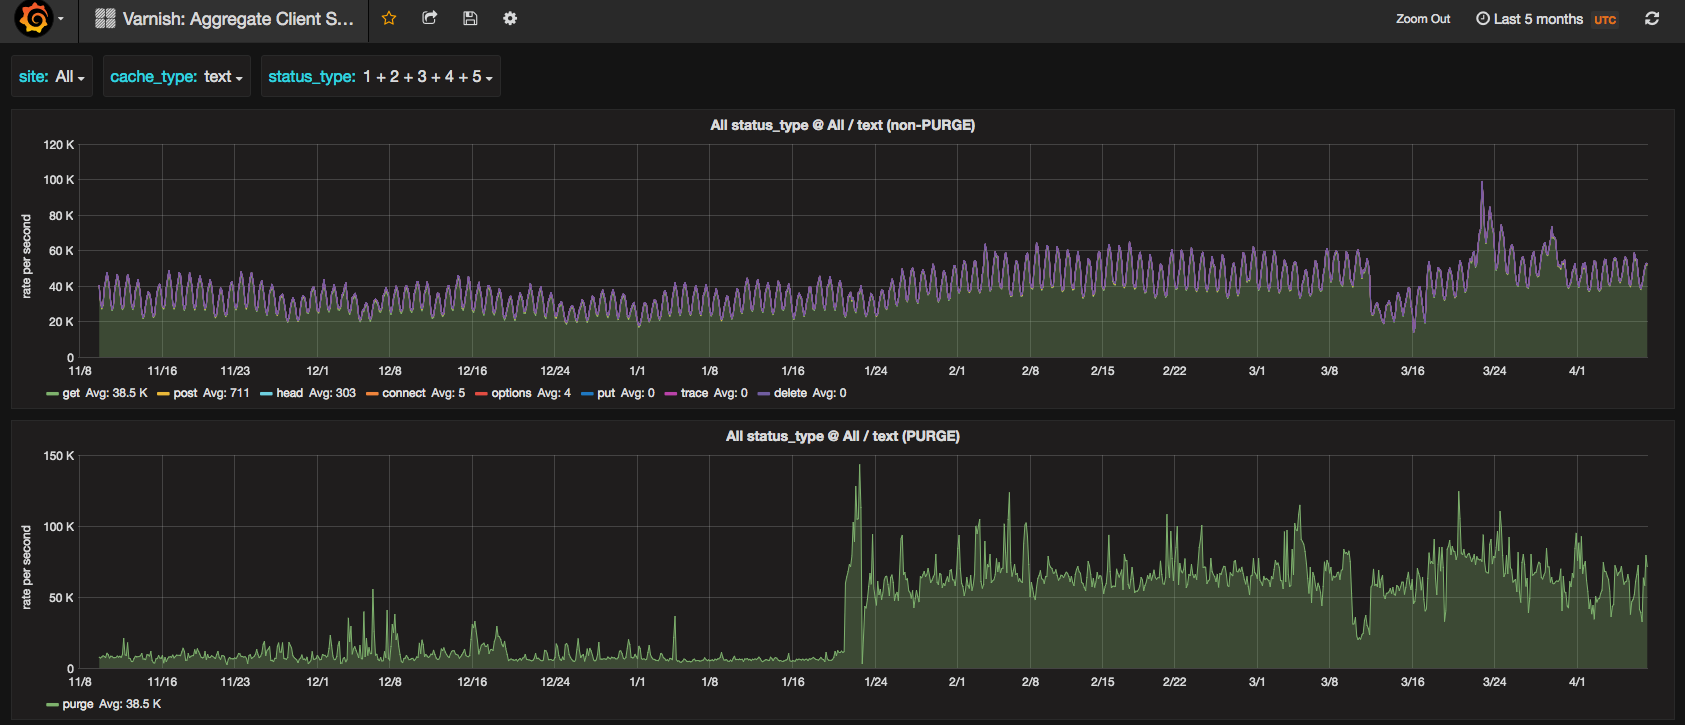
  1. Grafana shows massive increase in PURGE methods hitting varnishes starting circa 02:00 UTC on Jan 21: https://grafana.wikimedia.org/dashboard/db/varnish-aggregate-client-status-codes?from=1453148402001&to=1453463631092&var-site=All&var-cache_type=All&var-status_type=1&var-status_type=2&var-status_type=3&var-status_type=4&var-status_type=5&theme=dark
  2. Seems to correlate with T123815 + T124194#1951071 , which is when a job backlogging/throttling issue was "fixed" by making a separate runner for htmlCacheUpdate, which opened the floodgates on those jobs generating cache purges.
  3. But that leaves the question: when did it start piling up in the job queues in the first place and why? Which leads back to the graph linked at the top showing significant and seemingly permanent rate bumps in htmlCacheUpdate job inserts circa Dec 4, Dec 11, and then Jan 20.

Related Objects

Event Timeline

There are a very large number of changes, so older changes are hidden. Show Older Changes

What is that dashboard supposed to be showing? It is very hard to make sense of.

I added it so I can look at the things related to this ticket in one graph (queue size, htmlCacheUpdate pop, htmlCacheUpdate insert/push, purge, scap). I looked at a few other stats related to Wikidata initiated purges. I found nothing more yet than what was already mentioned in this ticket. Found neither evidence for or against as opposed to my guess that these are Wikidata initiated purges. It seems we don't have stats for how many purges Wikidata creates, as similar to templates 1 edit can trigger 100000 or more purges in rare cases with so many inclusions.

Yeah but the rate increase we're looking at is actually in the htmlCacheUpdate job insertion rate, regardless of magnification due to pages-affected-per-update. I'm surprised that we don't have any logs/data as to the source of those jobs.

As far as I can tell in Wikibase....

  • WikiPageUpdater::scheduleRefereshLinks creates RefreshLinksJobs.
  • These jobs call Content::getSecondaryDataUpdates and AbstractContent which can create LinksUpdates
  • These in turn can create HTMLCacheUpdates

Tracking the number of times wikibase calls scheduleRefreshLinks would be possible but might be rather pointless.
Also these are also currently logged:

wfDebugLog( __CLASS__, __FUNCTION__ . ": scheduling refresh links for " . $title->getText() );

I might be missing somemore HTMLCacheUpdates in wikibase but if I am they are very well hidden!

Distribution of purge URLs by hostname:

[fluorine:/a/mw-log] $ field 7 AdHocDebug.log | sed 's/\.m\./\./' | sort | dist | head
                  Key|Ct     (Pct)    Histogram
    en.wiktionary.org|893075 (18.66%) █████████████████████████████████████████████████████████████████████████████████████████████████████
     fr.wikipedia.org|836392 (17.48%) ██████████████████████████████████████████████████████████████████████████████████████████████▋
commons.wikimedia.org|758195 (15.84%) █████████████████████████████████████████████████████████████████████████████████████▊
     en.wikipedia.org|435543  (9.10%) █████████████████████████████████████████████████▍
     it.wikipedia.org|260668  (5.45%) █████████████████████████████▌
     zh.wikipedia.org|184594  (3.86%) █████████████████████
     ar.wikipedia.org|174000  (3.64%) ███████████████████▊
    ko.wiktionary.org|148310  (3.10%) ████████████████▉
     ko.wikipedia.org| 76192  (1.59%) ████████▋
     th.wikipedia.org| 72084  (1.51%) ████████▎

FYI: Wiktionary isn't supported yet by Wikidata so at least that part can't come from us.

Distribution of (indirect) callers of HTMLCacheUpdate::__construct for the past 20 minutes:

[fluorine:/a/mw-log] $ python /home/ori/cacheUpdateGrepper.py | dist
                                                       Key|Ct   (Pct)    Histogram
         Wikibase\Repo\Api\ModifyEntity->attemptSaveEntity|6764 (27.07%) ██████████████████████████████████████████████████████████████████
                                        SubmitAction->show|6311 (25.26%) █████████████████████████████████████████████████████████████▋
                   ApiMain->executeActionWithErrorHandling|6291 (25.18%) █████████████████████████████████████████████████████████████▌
          Wikibase\Repo\Api\ModifyClaim->attemptSaveEntity| 940  (3.76%) █████████▎
                                          ApiMain->execute| 803  (3.21%) ███████▉
                                  MediaWiki->performAction| 579  (2.32%) █████▊
                         LoadBalancer->commitMasterChanges| 392  (1.57%) ███▉
                                          EditAction->show| 331  (1.32%) ███▎
                                    ApiMain->executeAction| 197  (0.79%) ██
                                      FormlessAction->show| 150  (0.60%) █▌
 Wikibase\Repo\Interactors\ItemMergeInteractor->mergeItems| 120  (0.48%) █▎
               Wikibase\Repo\UpdateRepo\UpdateRepoJob->run| 106  (0.42%) █

Well, we have 3 different stages of rate-increase in the insert graph, so it could well be that we have 3 independent causes to look at here. And it's not necessarily true that any of them are buggy, but we need to understand what they're doing and why, because maybe something or other can be tweaked or tuned to be less wasteful. Fundamentally nothing really changed in the past month or two; it's not like we gained a 5x increase in human article editing rate...

Continuing with some stuff I was saying in IRC the other day. At the "new normal", we're seeing something in the approximate ballpark of 400/s articles purged (which is then multiplied commonly for ?action=history and mobile and ends up more like ~1600/s actual HTCP packets), whereas the edit rate across all projects is something like 10/s. That 400/s number used to be somewhere south of 100 before December.

it's not like we gained a 5x increase in human article editing rate...

If templates have been updated to use arbitrary access from Wikidata, one edit to an item on Wikidata can easily require updates to hundreds of pages...

Another data point from the weekend: In one sample I took Saturday morning, when I sampled for 300s, the top site being purged was srwiki, and something like 98% of the purges flowing for srwiki were all Talk: pages (well, with Talk: as %-encoded something in Serbian). When I visited random examples of the purged Talk pages, the vast majority of the ones I checked were content-free (as in, nobody had talked about the given article at all yet, it was showing the generic initial blob). These had to be coming from a job obviously, the question is what kind of job wants to rip through (probably) every talk page on a wiki, blank ones included, for purging (or alternatively, it was ripping through the entire page list, and I just happened to catch it on a batch of Talk: ones)? @faidon suggested a template used in those pages, but then what's triggering the template? Surely not wikidata on a template for blank talk pages?

Very strange. Wikidata use on templates on talk pages isn't impossible but I'd consider it pretty unlikely. Hmmmm. @Addshore said he'd look into some stats as well on our side.

@BBlack can you give a few examples of such pages on srwiki? Were these non-existant talk pages, or talk pages emptied by an archival process? Maybe someone on srwiki messed with their talkpage archive header template? That would purge a *lot* of pages...

@daniel - Sorry I should have linked this earlier, I made a paste at the time: P2547 . Note that /%D0%A0%D0%B0%D0%B7%D0%B3%D0%BE%D0%B2%D0%BE%D1%80: is the Serbian srwiki version of /Talk:.

Thanks. I looked at one of them and the only thing in the page is the template for the header they have. This was also the only edit ever to that page. In the header template itself however there was an edit on the 30th: https://sr.wikipedia.org/w/index.php?title=%D0%A8%D0%B0%D0%B1%D0%BB%D0%BE%D0%BD:%D0%A1%D1%82%D1%80%D0%B0%D0%BD%D0%B8%D1%86%D0%B0_%D0%B7%D0%B0_%D1%80%D0%B0%D0%B7%D0%B3%D0%BE%D0%B2%D0%BE%D1%80&diff=11598672&oldid=11292766 This might be responsible for a serious number of purges.

Yea, looks like the srwiki talk pages wasn't us, but an edit to a much-used template.

Regardless, the average rate of HTCP these days is normally-flat-ish (a few scary spikes aside), and is mostly throttled by the jobqueue. The question still remains: what caused permanent, large bumps in the jobqueue htmlCacheUpdate insertion rate on ~Dec4, ~Dec11, and ~Jan20?

Regardless, the average rate of HTCP these days is normally-flat-ish (a few scary spikes aside), and is mostly throttled by the jobqueue. The question still remains: what caused permanent, large bumps in the jobqueue htmlCacheUpdate insertion rate on ~Dec4, ~Dec11, and ~Jan20?

I think it was rMWd03c5be5e340: Make HTMLCacheUpdate always use the job queue. I am not sure how I missed that change until now. The change made all purging go through the job queue, whereas previously if the number of backlinks was less than 100, the purges would be dispatched synchronously, in the main request context.

@ori - yeah that makes sense for the initial bump, and I think there may have even been a followup to do deferred purges, which may be one of the other multipliers, but I haven't found it yet (as in, insert an immediate job and also somehow insert one that fires a little later to cover race conditions).

Good find. That commit was first deployed in wmf8 which was branched on Dec 8 (rMWb2404ca2c3d3), so it probably explains the one on ~Dec 11.

Distribution of (indirect) callers of HTMLCacheUpdate::__construct for the past 20 minutes:

[fluorine:/a/mw-log] $ python /home/ori/cacheUpdateGrepper.py | dist
                                                       Key|Ct   (Pct)    Histogram
         Wikibase\Repo\Api\ModifyEntity->attemptSaveEntity|6764 (27.07%) ██████████████████████████████████████████████████████████████████

So Wikibase appearing at the top of the list of callers for HTMLCacheUpdate::__construct is to be expected.
In the last 20 minutes we had roughly 7000 edits

In the last 20 minutes we had roughly 7000 edits

...and every such edit naturally causes at least one HTMLCacheUpdate on wikidata.org.

Well then apparently the 10/s edits to all projects number I found before is complete bunk :)

http://wikipulse.herokuapp.com/ has numbers for wikidata edits that approximately line up with yours, and then shows Wikipedias at about double that rate (which might be a reasonable interpretation of the distribution shown).

So, current thinking is that at least one of (maybe two of?) the bumps are from moving what used to be synchronous HTCP purge during requests to JobRunner jobs which should be doing the same thing. However, assuming it's that alone (or even just investigating that part in isolation), we're still left with "why did the resulting rate of HTCP purges go up by unexpected multiples just from moving them to the jobqueue?".

Change 268588 had a related patch set uploaded (by Addshore):
Count calls to WikiPageUpdater methods

https://gerrit.wikimedia.org/r/268588

Change 268588 merged by jenkins-bot:
Count calls to WikiPageUpdater methods

https://gerrit.wikimedia.org/r/268588

For easy access from the ticket the dashboard for the above patchset is at https://grafana.wikimedia.org/dashboard/db/wikipageupdater-calls

So when I look at http://graphite.wikimedia.org/render/?width=586&height=308&_salt=1453466175.547&target=MediaWiki.jobqueue.inserts_actual.htmlCacheUpdate.rate&from=-180days it recently got even worse. But Adam says https://grafana.wikimedia.org/dashboard/db/wikipageupdater-calls might indicate it is actually not Wikidata.
Does anyone have further info? Otherwise I am not sure how to move this forward.

I really don't think it's specifically Wikidata-related either at this point. Wikidata might be a significant driver of update jobs in general, but the code changes driving the several large rate increases were probably generic to all update jobs.

Breakdown of 10,718,138 PURGEs, captured on 2016-06-01 between 18:00 and 22:00 UTC:

Top PURGE issuers by wiki

WikiPercent
svwiki24.64%
itwiki12.05%
enwiki11.46%
frwiki9.44%
enwiktionary8.00%
dewiki4.91%
arwiki4.66%
commonswiki4.58%
cawiki2.54%
shwiki1.81%

Top PURGE issuers by host

HostPercent
mw10117.85%
mw11635.95%
mw11655.75%
mw10135.74%
mw11675.73%
mw10035.71%
mw11695.68%
mw10055.66%
mw10155.66%
mw10015.64%

Top PURGE issuers by entrypoint

EntrypointPercent
RunJobs.php91.48%
api.php5.05%
index.php3.46%
MWScript.php0.01%

Top PURGE issuers by user (anonymized)

User (anonymized)Percent
127.0.0.191.57%
<User 5e55>0.88%
<User 0366>0.49%
<User 7616>0.42%
<User 77d5>0.33%
<User bf50>0.20%
<User e9ff>0.18%
<User d942>0.16%
<User e62e>0.13%
<User 2f65>0.10%

Top PURGE issuers by job type

Job typePercent
htmlCacheUpdate78.82%
ChangeNotification11.98%
(not a job)8.52%
LocalGlobalUserPageCacheUpdateJob0.42%
MassMessageJob0.13%
flaggedrevs_CacheUpdate0.10%
cirrusSearchLinksUpdatePrioritized0.01%
refreshLinksPrioritized0.01%
UpdateRepoOnMove0.01%
LocalPageMoveJob0.01%

Top PURGE issuers by job + wiki pair

Job + wiki pairPercent
htmlCacheUpdate / svwiki23.70%
htmlCacheUpdate / itwiki10.76%
htmlCacheUpdate / enwiki9.77%
htmlCacheUpdate / enwiktionary7.97%
htmlCacheUpdate / frwiki6.08%
htmlCacheUpdate / arwiki4.34%
htmlCacheUpdate / commonswiki3.87%
ChangeNotification / frwiki3.09%
ChangeNotification / dewiki2.81%
htmlCacheUpdate / cawiki2.50%

@EBernhardson made it so when a job fragments into a number of child jobs, each child job has the same request ID as its parent. This also makes it possible to aggregate PURGEs by individual parent job:

Top PURGE issuers by orig. request id

Orig. request idPercent
V07acApAEK4AAA-p8t4AAACK24.43%
V09G2wpAIDEAAAoe07kAAABE10.05%
V0xKtwpAEK8AAFSGAicAAACI3.59%
V0xKtQpAEIEAAAvjcJIAAAAY3.45%
V08jWwpAEK4AAHA7yEsAAAAV3.44%
V08P2QpAADUAABlSU9sAAAAB2.49%
V08o4QpAICwAABlKSrUAAACJ2.39%
fe4a69ca01a1c0e76f782cd92.34%
73fd09f28d554f56484bed951.97%
ceeea6f37cefae6a4a86478b1.90%

This tells us that of the 10,718,138 PURGEs issued during the observation period, approximately 2,618,441 PURGEs were issued by a single htmlCacheUpdate job for svwiki.

svwiki only has 6,464,684 pages in total (of which 3,199,790 are content pages), so that means nearly half of svwiki was purged over the course of four hours.

My hunch is that purges are not getting correctly de-duplicated, so a single page can get purged multiple times by children of a single root job.

I wonder whether we correctly de-duplicate the case when a template is indirectly included on a page via two or more different intermediate templates. For example, on enwiki, [[Template:Navbox]] is included in [[Barack Obama]] both through [[Template:US Presidents]] and [[Template:Current U.S. Governors]].

We are definitely sending duplicate purges. I added some debug logging and saw URLs get purged a half dozen times for the same job.

Change 294876 had a related patch set uploaded (by Aaron Schulz):
Improve HTMLCacheUpdate job CDN purge de-duplication

https://gerrit.wikimedia.org/r/294876

Change 295027 had a related patch set uploaded (by GWicke):
For discussion: Reduce purge volume by moving dependent purges to RefreshLinksJob

https://gerrit.wikimedia.org/r/295027

@aaron and @GWicke - both patches sound promising, thanks for digging into this topic!

Change 294876 merged by jenkins-bot:
Improve HTMLCacheUpdate job CDN purge de-duplication

https://gerrit.wikimedia.org/r/294876

Krinkle assigned this task to aaron.

Not resolved, as the purge graphs can attest!

aaron removed aaron as the assignee of this task.May 19 2017, 8:02 PM

Not resolved, as the purge graphs can attest!

Which graphs?

This issue is about a "massive increase" observed between December 2015 and January 2016, however our graphs don't go back far enough. It seems data prior to June 2016 has been wiped.

https://grafana-admin.wikimedia.org/dashboard/db/job-queue-rate?orgId=1&var-Job=htmlCacheUpdate&from=now-2y&to=now

Screen Shot 2017-05-25 at 16.40.47.png (794×2 px, 193 KB)

From a quick look through this task I also couldn't find any absolute numbers from before this point to compare against, so I don't know what we're aiming for or what we're investigating here.

Also, how does this relate to T164173: Cache invalidations coming from the JobQueue are causing lag on several wikis?

The lack of graph data from falling off the history is a sad commentary on how long this has remained unresolved :(

Some salient points from earlier within this ticket, to recap:

Continuing with some stuff I was saying in IRC the other day. At the "new normal", we're seeing something in the approximate ballpark of 400/s articles purged (which is then multiplied commonly for ?action=history and mobile and ends up more like ~1600/s actual HTCP packets), whereas the edit rate across all projects is something like 10/s. That 400/s number used to be somewhere south of 100 before December.

Regardless, the average rate of HTCP these days is normally-flat-ish (a few scary spikes aside), and is mostly throttled by the jobqueue. The question still remains: what caused permanent, large bumps in the jobqueue htmlCacheUpdate insertion rate on ~Dec4, ~Dec11, and ~Jan20?

Re; the outstanding patch that's been seeing some bumps ( https://gerrit.wikimedia.org/r/#/c/295027/ ) - The situation has evolved since that patch was first uploaded. Our current maximum TTLs are capped at a single day in all cache layers. However, they can still add up across layers if the race to refresh content plays out just right, with the worst theoretical edge case being 4 total days (fetching from ulsfo when eqiad is the primary).

Those edge cases are also bounded by the actual Cache-Control (s-)max-age, but that's currently at two weeks still, I believe, so they don't really come into play. We should probably look at moving the mediawiki-config wgSquidMaxAge (and similar) down to something around 5-7 days, so that it's more reflective of the reality of the situation on the caches.

We'll eventually get to a point where we've eliminated the corner-case refreshes and can definitely say that the whole of the cache infrastructure has a hard cap at one full day, but there's more work to do there in T124954 + T50835 (Surrogate-Control) first.

I think even now, and especially once we reach that point later, we're starting to reach a point where purging Varnish for mass invalidations like refreshLinks and templating doesn't make sense. Those would be spooled out over a fairly long asynchronous period anyways. They can simply get updated as the now-short TTLs expire, reserving immediate HTCP invalidation for actual content edits of specific articles. Those kinds of ideas may need to be a separate discussion in another ticket?

Continuing with some stuff I was saying in IRC the other day. At the "new normal", we're seeing something in the approximate ballpark of 400/s articles purged (which is then multiplied commonly for ?action=history and mobile and ends up more like ~1600/s actual HTCP packets), whereas the edit rate across all projects is something like 10/s. That 400/s number used to be somewhere south of 100 before December.

Regardless, the average rate of HTCP these days is normally-flat-ish (a few scary spikes aside), and is mostly throttled by the jobqueue. The question still remains: what caused permanent, large bumps in the jobqueue htmlCacheUpdate insertion rate on ~Dec4, ~Dec11, and ~Jan20?

Just to confirm, you're saying before December 2015, the purge rate was below 100/s, and has since then been around ~ 400/s. It'd be nice to have some recent numbers as well, created using the same method as then.

Some of my own from two Varnish instances:

cp4008:~$ varnishtop -I 'ReqMethod:PURGE' -p 1
cp1055:~$ varnishtop -I 'ReqMethod:PURGE' -p 1

I found numbers typically to be between 900 and 3000 per second.

We can get broader averages by dividing the values seen in the aggregate client status code graphs using eqiad's text cluster (the remote sites would expect fewer due to some of the bursts being more likely to be dropped by the network)

This shows the past week's average at 33.6K/s avg PURGE rate for text@eqiad: https://grafana.wikimedia.org/dashboard/db/varnish-aggregate-client-status-codes?panelId=6&fullscreen&orgId=1&var-site=eqiad&var-cache_type=text&var-status_type=1&var-status_type=2&var-status_type=3&var-status_type=4&var-status_type=5

There are 7 active servers there the past week (cp1053 has been depooled for the past couple of weeks), so that puts us at ~4800/sec raw rate of HTCP purges. The numbers from before (100, 400) were htmlCacheUpdate numbers though, before they're multiplied by 4 (desktop/mobile, action=history) for actual HTCP purging. So the comparable number now would be something like ~1200/sec.

It's a little blurrier than that now, though, because in the meantime we've added RB purges as well (e.g. for the mobile content sections). I think these are 3x per article for mobile-sections, mobile-sections-lead, mobile-sections-remaining, and I'm not sure exactly how it hooks into the updating pipeline. I would suspect that, indirectly, all 3 of those are triggered for many of the same conditions as regular wiki purges, so we may be seeing a ~7x HTCP multiplier overall for title->URLs, which would divide the 4800/s down to 685/s on the htmlCacheUpdate side as perhaps a more-comparable number to the earlier 100 and 400 numbers?

Would the use of xkey help here? It sounds like a single user action currently generates several purge requests.

Yeah that was the plan, for XKey to help here by consolidating that down to a single HTCP / PURGE per article touched. It's not useful for the mass-scale case (e.g. template/link references), as it doesn't scale well in that direction. But for the case like "1 article == 7 URLs for different formats/variants/derivatives" it should work great. The varnish module for it is deployed, but we haven't ever found/made the time to loop back to actually using it (defining standards for how to transmit it over the existing HTCP protocol or the new EventBus and pushing developers to make use of it). I think last we talked we were going to move cache-purge traffic over to EventBus before tackling this (with kafka consumers on the cache nodes pulling the purges), but I'm not sure what the relative timelines on all related projects look like anymore.

@BBlack I have looked into XKey before, and have been wanting to work on this for a while (see T152425). Whoever does, please get in touch with me. Or wait until I get around to it...

Krinkle assigned this task to aaron.
Krinkle moved this task from Watching to Perf issue on the Performance-Team (Radar) board.

Marking as resolved for now given the new JobQueue based on EventBus. If the rate remains an issue, or becomes an issue again, we should file a new task for that.

Change 295027 abandoned by Krinkle:
Reduce purge volume by moving dependent purges to RefreshLinksJob

Reason:
Not currently on the roadmap for performance. T230025 does some refactoring on this. If still interesting, we can file a follow-up task.

https://gerrit.wikimedia.org/r/295027