Page MenuHomePhabricator

Investigate difference in metrics for Firefox on different WebPageTest instances
Closed, ResolvedPublic

Assigned To
Authored By
Peter
Mar 9 2016, 9:55 AM
Referenced Files
F3901628: ff.png
Apr 21 2016, 8:43 AM
F3888375: Screen Shot 2016-04-18 at 8.59.12 AM.png
Apr 18 2016, 11:12 AM
F3773807: larger-instance.png
Mar 29 2016, 6:17 AM
F3764065: Screen Shot 2016-03-28 at 8.17.09 PM.png
Mar 28 2016, 6:20 PM
F3574602: Screen Shot 2016-03-09 at 10.45.24 AM.png
Mar 9 2016, 9:55 AM
F3574608: Screen Shot 2016-03-09 at 10.45.36 AM.png
Mar 9 2016, 9:55 AM

Description

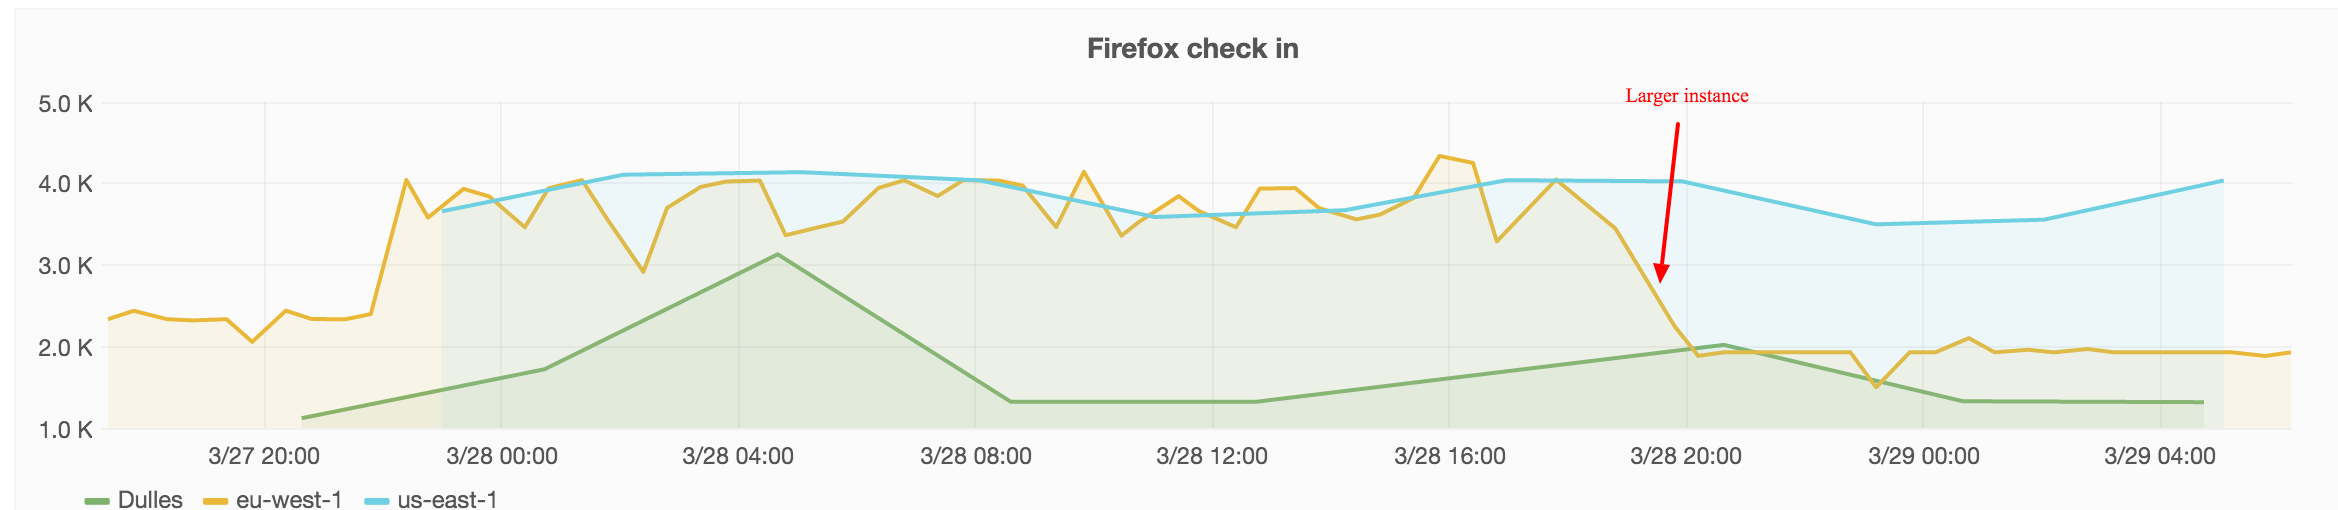
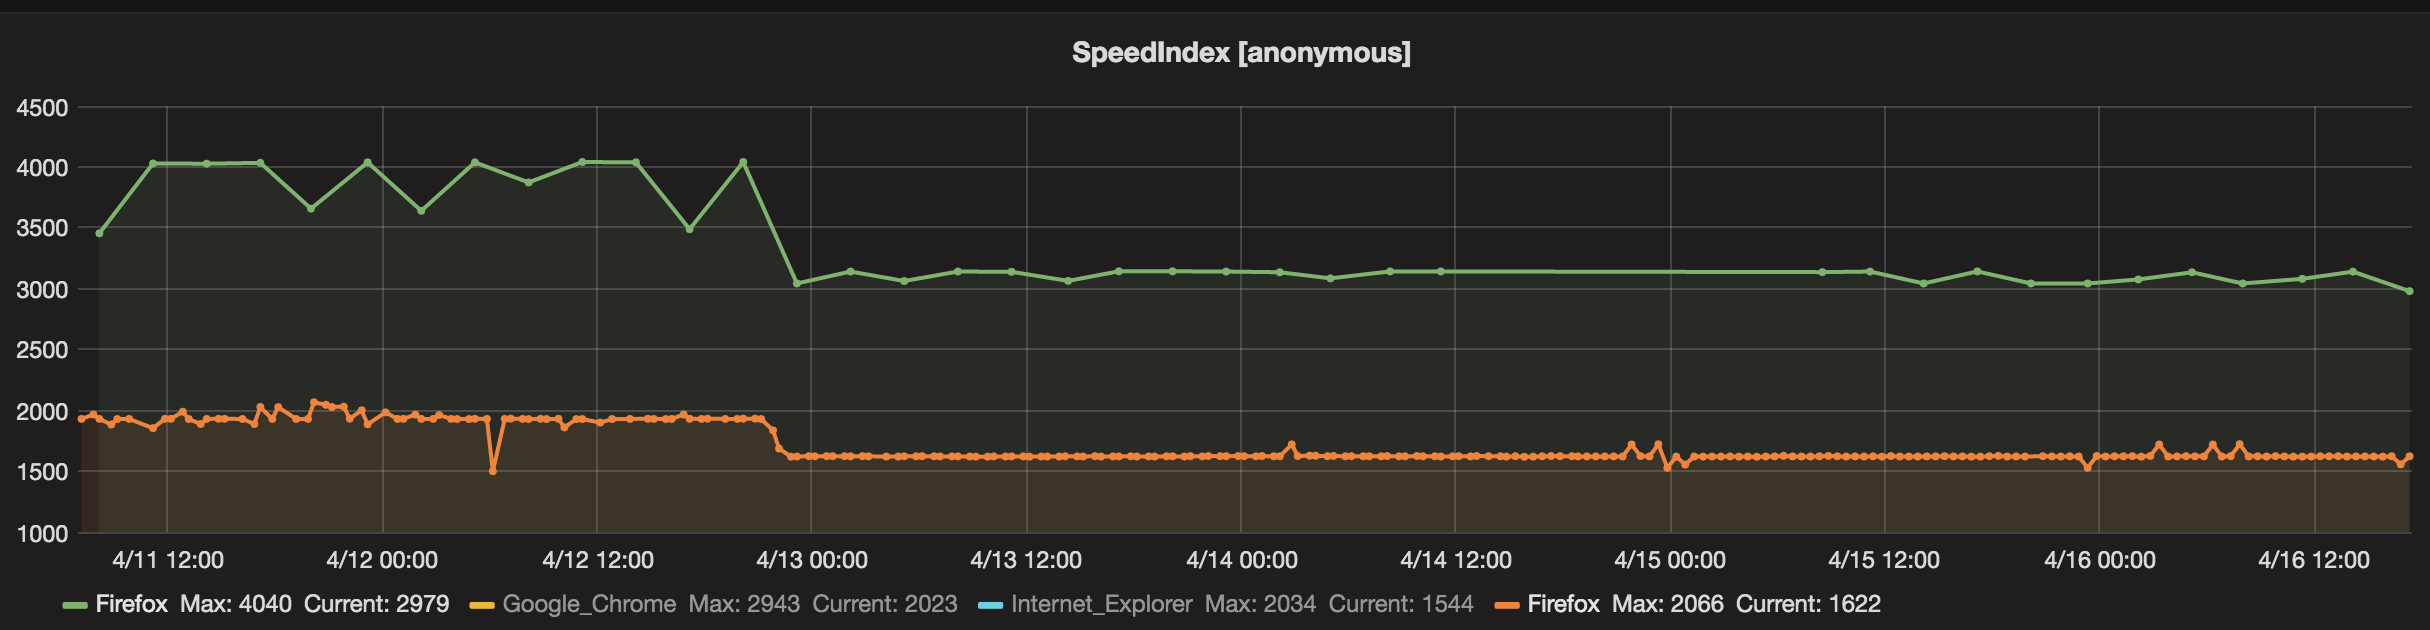
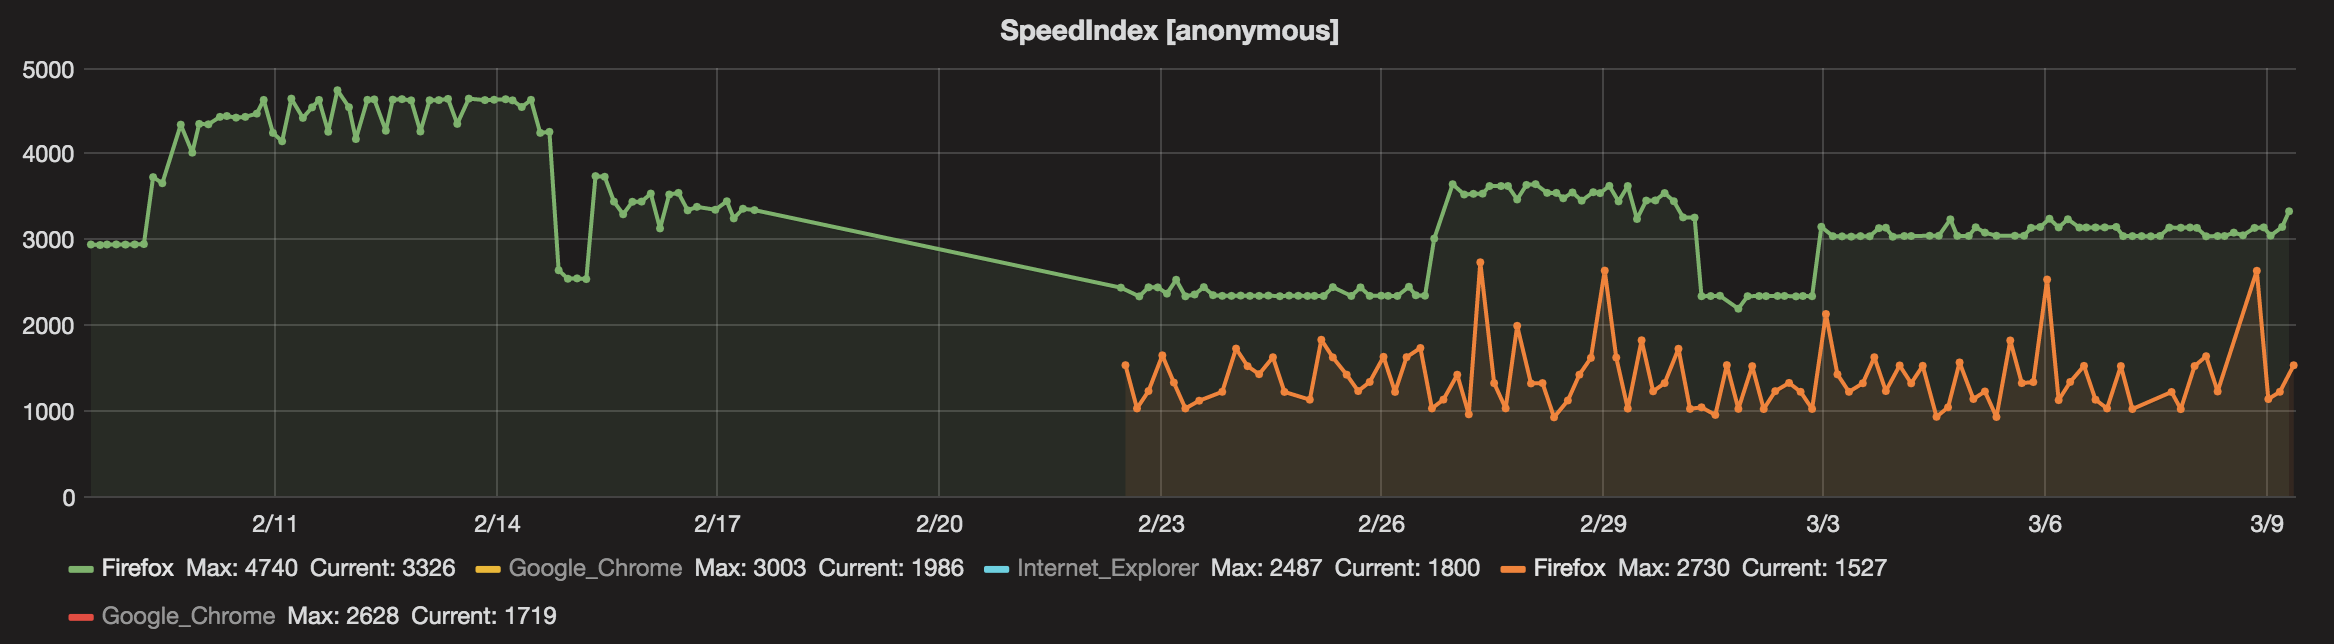
We test the Facebook page on Firefox both on out own instance and on WebPageTest.org. The green lines are from our own instance and the orange is on WebPageTest:

Screen Shot 2016-03-09 at 10.45.24 AM.png (644×2 px, 190 KB)

Screen Shot 2016-03-09 at 10.45.36 AM.png (644×2 px, 205 KB)

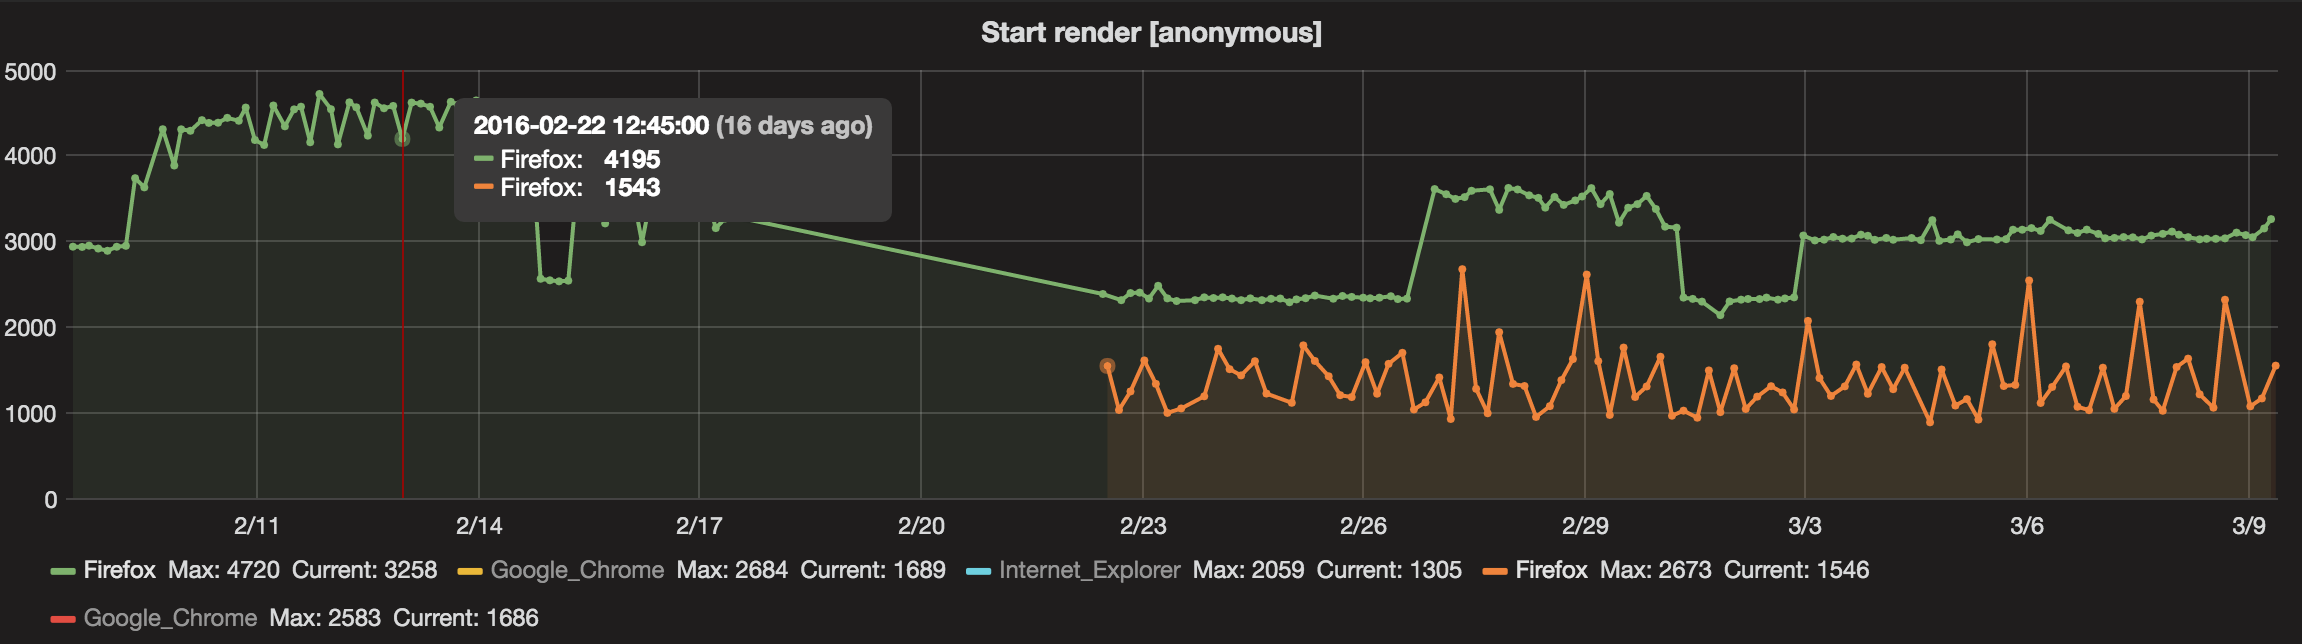
On our local instance the metrics are pretty stable but sometimes they increase with almost 1 second and stays that way for some time. I want to know that these jumps really reflects the page being slower and not something that happens on our WPT server (and I hoped testing using WPT.org would help us with that).

It's hard to say that the numbers from WPT.org shows us the same picture. When we run on WebPageTest.org we don't specify exactly which server that will run the test, that can make the metrics differ between runs.

The first step should be to check that we runs the tests the exact same way on WPT.org and our own server.

Event Timeline

Peter renamed this task from Investigate difference in metrics for Firefix to Investigate difference in metrics for Firefox.Mar 9 2016, 9:55 AM
Peter renamed this task from Investigate difference in metrics for Firefox to Investigate difference in metrics for Firefox on different WebPageTest instances.Mar 9 2016, 10:02 AM

Been tracking this in two different tasks so merged it now.

The configuration os the same, only difference is that on our own instance we track only first run. I've changed that for WebPageTest.org in https://gerrit.wikimedia.org/r/#/c/277196/

A couple of things we can do to move forward:

  • Test on another amazon instance: EU or somewhere else with more latency and see if we get the same numbers there. We can do that by setting up a different job in Jenkins and let it run for a couple days.
  • It could be that our instance is too small. We could try to increase CPU & memory by getting a larger instance. That's should only be a configuration on the main server. We could test that first and see if the numbers change, however that could impact all the metrics (but maybe for the good if our instance is too small). We run on the one recommended (medium) but who know exactly if it's a problem just for Firefox?

I have added another amazon instance (eu-west-1) that is started from the crontab every 50 minutes (to make sure it uses the same instance) on the wpt server. Lets see what kind of numbers we get from that. I'll add a graph when we have some numbers.

We got the same thing on the other instance:

Screen Shot 2016-03-28 at 8.17.09 PM.png (516×2 px, 118 KB)

The yellow and the blue lines are WPT on a Amazon instances, the green one is WPT.org. Lets see if there's a way to increase CPU/memory on one of them. I think configuring the main server, and then drop the agent running on Ireland should do the trick.

I've changed now (I hope) so we will use m3.large for Ireland. There's no documentation but it looks like this is the place: https://github.com/WPO-Foundation/webpagetest/blob/908f9dde6a5ba560dfdfe30865874930f9038ebf/www/settings/ec2_locations.ini

We got the larger instance up and running yesterday and it made a difference.

larger-instance.png (510×2 px, 104 KB)

I want to keep it up and running for a while just to see if we get medium size agent going down and see what happens to the larger one at that moment.

We have had a change again where the SpeedIndex & start render went down. The orange line is the large server and the green line is our default:

Screen Shot 2016-04-18 at 8.59.12 AM.png (630×2 px, 143 KB)

On our default server the change in SpeedIndex goes from 4040 -> 3140 and start rendering from 4000 - > 3000.
The beefed up server change in SpeedIndex is 1923 -> 1623 and start render 1900 -> 1600.

@ori helped me out and looked at the metrics we collect from real users. But first: I did check some other things in WPT:

For FF and SPDY waterfall graphs and number of requests and sizes are 0, so we cannot use that. But I checked the same for Chrome to see if I could see some changes in the pages at the same moment that we see the changes in timing metrics. I could not see anything that's correlated. But I could see that other metrics also are affected, our own user timings too (mwLoadStart and mwLoadEnd).

So @ori checked mediaWikiLoadComplete during the time when we have seen the problem in WPT:

ff.png (1×2 px, 125 KB)

We cannot see the same thing in our RUM data.

Let me summarize:
During a couple of months we have had four peaks that continues between a couple of days or a week when we measuring our Facebook page using Firefox. I've added an extra WPT agent running in Ireland, and we got the same behaviour there. I've increased the cpu/memory size of the agent and got the same pattern (but the difference in timings isn't so big).

There's a couple of things I wanna do:

  • We keep the same setup till we change to HTTP2. Then we can collect the waterfall graphs and have more to see.
  • I want to change the size on our default agent to a larger one (the same we run in Ireland right now). I can see that at least for Chrome we hit CPU almost all the time for our pages with a lot of content. When we do that, most of our metrics will change, so we need communicate it before we do that.
  • I want to focus more on the second page. Today we only test that on Facebook using Chrome. We have had problem with WPT/SPDY/second page, the metrics are not correct (we have seen wrong SpeedIndex, render etc T129735). When we do the switch to HTTP2 it will be easier to have good metrics and they will correlate more with the traffic we have.
  • We should start trying to measure how much of our traffic that have empty caches (see T130228). That would be cool and can help us with WPT to measure in a more realistic way.

Ok, I think the problem could be that our instances (even the one running on Ireland, the large one) is too small, check out the CPU and the waterfall graph on this run:
http://wpt.wmftest.org/result/160511_YT_20/1/details/

It doesn't look healthy and I hope the long pause in the graph never happens IRL.

Peter claimed this task.

We updated the agent instance site I think that will do it. If this happens again, lets re-open the task.