Page MenuHomePhabricator

Portal: investigate on how long a "typical" session is
Closed, ResolvedPublic4 Estimated Story Points

Description

This ticket is in response to a meeting the Portal team had about the last A/B test and the possible differences in clickthrough rates for the first visit vs overall rates.

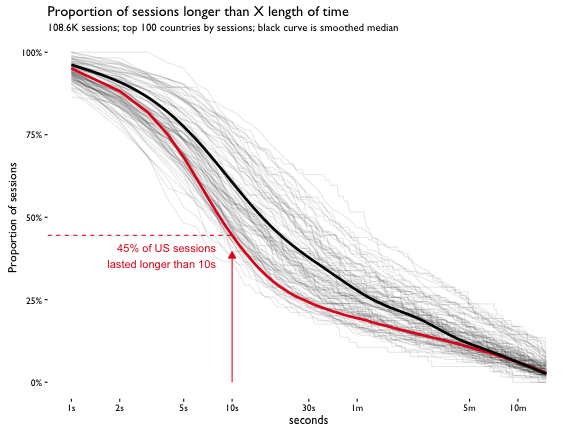
This ticket is to investigate how long a typical session is for our wikipedia.org portal visitors. Based on this information, we might make changes in the future to how we track (or not) these longer sessions.

Event Timeline

mpopov set the point value for this task to 2.
mpopov moved this task from Backlog to In progress on the Discovery-Analysis (Current work) board.
debt changed the point value for this task from 2 to 4.May 31 2016, 8:05 PM

Half of my day was spent in meetings but I'm almost done (https://github.com/wikimedia-research/Discovery-Research-Portal/tree/master/Analyses/Session%20Length). I've got a pretty good idea of how long a typical session is by country, now just need to re-run the code but look at language preference instead of country and put together the report explaining what the heck these plots actually tell us.

Preview of the said plots:

survival_by_country.png (864×1 px, 190 KB)
survival_median.png (432×576 px, 101 KB)

First draft:

Some of the plot types I used may be new and/or confusing at first, no matter how much labelling there is, so I'd love to get into a Hangout and go over how to read those. I am always down to help people with statistical graph literacy!