Page MenuHomePhabricator

"MediaWiki exceptions and fatals per minute" alarm is too slow (half an hour delay!)
Closed, ResolvedPublic

Description

We have an Icinga check that looks at the rate of MediaWiki fatals and exceptions in Graphite and alarms whenever a threshold is passed.

I found out today that the alarm on IRC seems to have kick of 30 minutes after the spike seen in logstash. From the IRC logs at http://bots.wmflabs.org/~wm-bot/logs/%23wikimedia-operations/20160728.txt

[12:46:28] <icinga-wm>	 PROBLEM - MediaWiki exceptions and fatals per minute on graphite1001 is CRITICAL: CRITICAL: 20.00% of data above the critical threshold [50.0]
[12:50:18] <icinga-wm>	 RECOVERY - MediaWiki exceptions and fatals per minute on graphite1001 is OK: OK: Less than 1.00% above the threshold [25.0]
[12:58:18] <icinga-wm>	 PROBLEM - MediaWiki exceptions and fatals per minute on graphite1001 is CRITICAL: CRITICAL: 60.00% of data above the critical threshold [50.0]
[13:02:27] <icinga-wm>	 RECOVERY - MediaWiki exceptions and fatals per minute on graphite1001 is OK: OK: Less than 1.00% above the threshold [25.0]

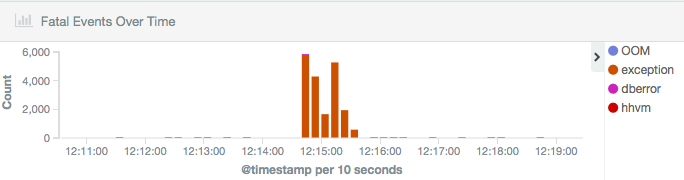
The spike of exceptions happened at 12:15 as can be seen in logstash:

20160728-spike-of-exceptions.png (180×684 px, 28 KB)

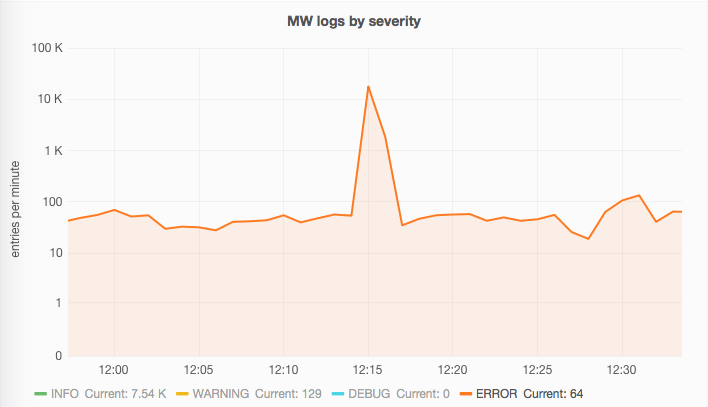
Or in Grafana Production Logging dashboard centered at 12:15 as well:

20160728-spike-grafana.png (407×708 px, 42 KB)


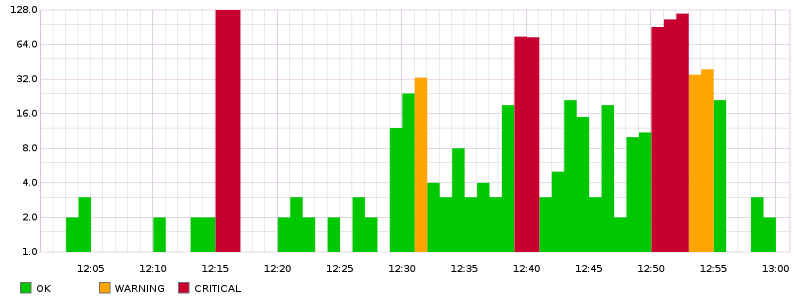
The Grafana metric being checked is transformNull(sumSeries(logstash.rate.mediawiki.fatal.ERROR.sum, logstash.rate.mediawiki.exception.ERROR.sum), 0) with warnings at 25 and critical at 50. Represented with OK state in green, Warning in orange and Critical in red from 12:00 to 13:00:

render-15.png (300×800 px, 17 KB)

Graphite link for last six hours.

The Icinga logs

TimeLevelStateState countMessage
2016-07-28 12:08:58WARNINGSOFT120.00% of data above the warning threshold [25.0]
2016-07-28 12:10:57OKSOFT2Less than 1.00% above the threshold [25.0]
2016-07-28 12:22:38CRITICALSOFT140.00% of data above the critical threshold [50.0]Spike detected after 7 minutes
2016-07-28 12:24:38OKSOFT2Less than 1.00% above the threshold [25.0] Erroneously cleared?
2016-07-28 12:36:38WARNINGSOFT120.00% of data above the warning threshold [25.0]
2016-07-28 12:38:38OKSOFT2Less than 1.00% above the threshold [25.0]
2016-07-28 12:42:28CRITICALSOFT120.00% of data above the critical threshold [50.0]First notice
2016-07-28 12:44:28CRITICALSOFT240.00% of data above the critical threshold [50.0]Second
2016-07-28 12:46:27CRITICALHARD320.00% of data above the critical threshold [50.0]Third -> HARD == 1st IRC notification (PROBLEM)
2016-07-28 12:50:18OKHARD3Less than 1.00% above the threshold [25.0]2nd IRC notification (RECOVERY)
TimeLevelStateState countMessage
2016-07-28 12:54:18CRITICALSOFT140.00% of data above the critical threshold [50.0]
2016-07-28 12:56:18CRITICALSOFT240.00% of data above the critical threshold [50.0]
2016-07-28 12:58:18CRITICALHARD360.00% of data above the critical threshold [50.0]Third -> HARD = 3rd IRC notification (PROBLEM)
2016-07-28 13:00:18WARNINGHARD320.00% of data above the warning threshold [25.0]
2016-07-28 13:02:27OKHARD3Less than 1.00% above the threshold [25.0]4th IRC notification (RECOVERY)

Event Timeline

hashar updated the task description. (Show Details)

Ori is out for family reasons right now, but since he helped craft this alert I'm adding him here for his thoughts.

The alarm is not delayed by half an hour. It is delay but not as much as I thought.

Looking at the green/orange/red graph, one can see the huge spike at 12:15 which correlate with Icinga:

2016-07-28 12:22:38CRITICALSOFT140.00% of data above the critical threshold [50.0] minutes

There are two issues with this one:

  1. it is 7 minutes late
  2. it is in SOFT state indicating that Icinga is set to retry this X (actually 3) times before becoming HARD and triggering notification

The state got cleared exactly 2 minutes later when the spike ended.

The 1st IRC notification we received (at 12:50:18) is unrelated to the spike at 12:15. It is a second spike that occured at 12:40. It prompted me to look at the log and I thought it was for the previous spike hence complaining about more than half an hour of delay.

From Icinga we can see there are 3 retries each 2 minutes apparts before emitting the notification:

2016-07-28 12:42:28CRITICALSOFT1
2016-07-28 12:44:28CRITICALSOFT2
2016-07-28 12:46:27CRITICALHARD3

The things to look at are:

  • reduce the amount and or delay of retries
  • figure out why even the first step change is lagged out.

From the three spikes, one got unnotified and the two others delayed by 10 minutes.

hashar triaged this task as Medium priority.Jul 28 2016, 7:47 PM
fgiunchedi claimed this task.
fgiunchedi subscribed.

I believe nowadays the alert is based on metrics from logstash and appears on IRC in a timely fashion, resolving but please do reopen if it occurs again.

I explained it in the task, the issue is in Icinga configuration and is still occuring.

On the first critical, Icinga flag the service as SOFT and raise a counter to 1. In our configuration Icinga retries 2 times with a 2 minutes delay between retries (each raising the counter). If the counter reaches 3 the service is escalated to HARD state which triggers the notification.

That is fine to avoid flapping alarm, but often it causes unnecessary delay in the notification (due to the retries) and cause extra checks on the Icinga host (due to the retries).

A random example from today:

History for analytics1064 > DPKG

Service Critical[2019-12-10 15:11:33] SERVICE ALERT: analytics1064;DPKG;CRITICAL;SOFT;1;DPKG CRITICAL dpkg reports broken packages
Service Critical[2019-12-10 15:13:19] SERVICE ALERT: analytics1064;DPKG;CRITICAL;SOFT;2;DPKG CRITICAL dpkg reports broken packages
Service Critical[2019-12-10 15:15:05] SERVICE ALERT: analytics1064;DPKG;CRITICAL;HARD;3;DPKG CRITICAL dpkg reports broken packages
Service Ok [2019-12-10 15:16:51] SERVICE ALERT: analytics1064;DPKG;OK;HARD;3;All packages OK

Notifications for analytics1064 > DPKG:

analytics1064 DPKG CRITICAL 2019-12-10 15:15:05 irc notify-service-by-irc DPKG CRITICAL dpkg reports broken packages
analytics1064 DPKG OK 2019-12-10 15:16:51 irc notify-service-by-irc All packages OK

The issue has been detected at 15:11:33, reached hard state at 15:15:05 which triggered the notification. That is a 3m30s delay, which is what this task is about.

Unassigning from me since I'm not working directly on this, anecdotally the "mediawiki exceptions" alert now is working as intended (including the soft -> hard transition)

Indeed, there is a bit of delay due to retries and the default retry_interval of 1 (minute) which seems appropriate for most cases.

@hashar does this still need looked at/addressed? If so, how much delay do you think is acceptable or appropriate?

lmata claimed this task.
lmata subscribed.

Hello,

3M delay seems like a short but acceptable window for alerting. If there is a need to shorten this down we can discuss.. Closing this ticket, please reopen if you'd like to revisit the conversation.

In a nutshell the first issue is that the first spike of error at 12:15 was large in number of events but happened on a very short window. The statsd check was made on a larger window and less than 50 % of the points were failing so it did not trigger an error.

Assuming a spike that spans 3 units of time, and a statsd check that spans 7 units:

errors
|          x
|          x
|         xxx
|         xxx
+---->0000111<

There are 3 points flagged as error (1 above), 4 which are fine (0 above) that less than 50% of data points in error state and the spike is left unnoticed.

The second issue is similar, the spike is noticed a bit late since it has to occupy the statsd check window until 50% of data points are erroring out but on top of that there are the Icinga retries that further delay the SOFT > HARD state which will eventually trigger the notification. There was 3 checks 2 minutes apart so the notification is send 6 minutes after the statsd window is marked in error.

I guess this task was to have Icinga to issue the notification immediately (0 retries) since the statsd window acts a buffer already. Then all of that was more than 4 years ago so should probably be entirely revisited and indeed we can just ignore the issue unless that becomes a concern again.