We would like to get a better understanding of the top API user agents, for both the REST & Action APIs. These statistics should cover both cache misses & hits.
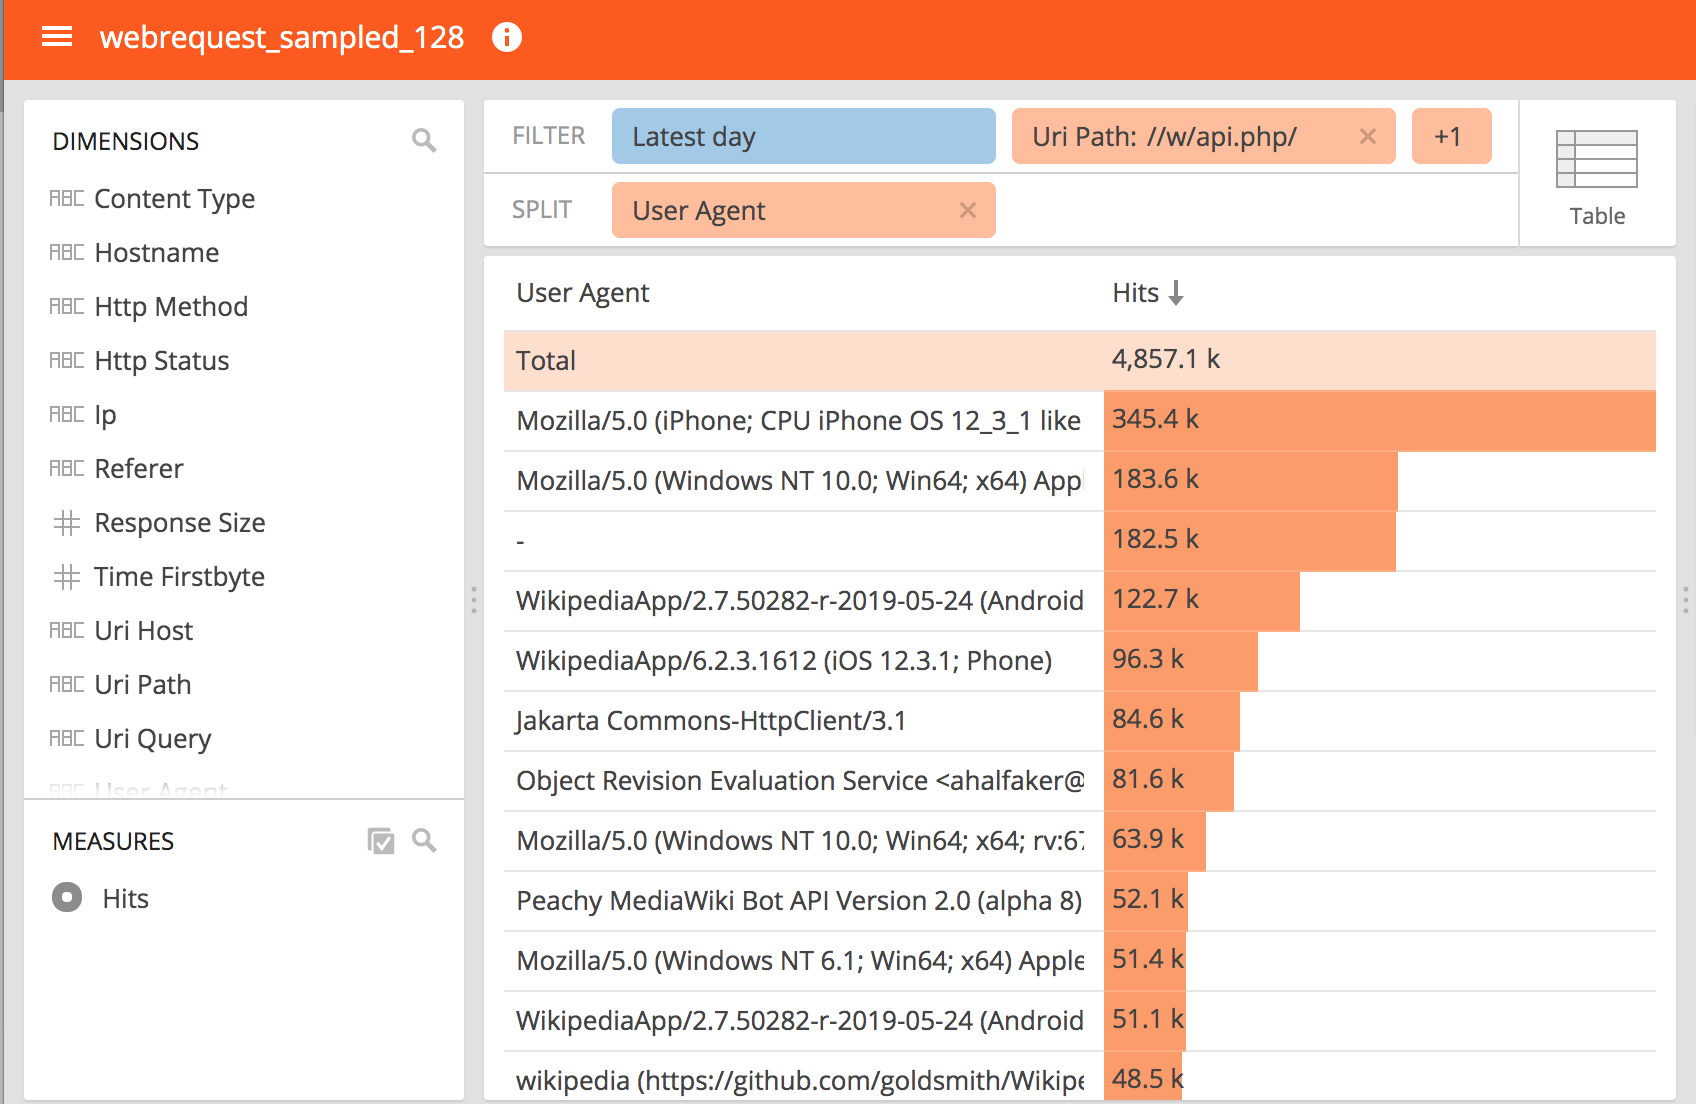
We do have user agents in web request logs, but as far as I know we currently only expose UA stats aggregated across all requests. Would it be possible to set up separate UA stats for requests matching /w/api.php and /api/rest_v1/ (separately + combined)?
See also: T122245: REST API entry point web request statistics at the Varnish level