Page MenuHomePhabricator

Find out how new anti-copyvio abusefilters are affecting uploads
Closed, ResolvedPublic

Assigned To
Authored By
matmarex
Sep 7 2016, 7:09 PM
Referenced Files
F4509186: crosswiki.png
Sep 21 2016, 4:39 PM
F4509184: crosswiki.csv
Sep 21 2016, 4:39 PM
F4509187: crosswiki.ods
Sep 21 2016, 4:39 PM
F4509185: crosswiki.sql
Sep 21 2016, 4:39 PM
F4495800: crosswiki.csv
Sep 20 2016, 11:01 PM
F4495794: newusers.ods
Sep 20 2016, 11:01 PM
F4495150: newusers.csv
Sep 20 2016, 11:01 PM
F4495802: crosswiki.ods
Sep 20 2016, 11:01 PM

Description

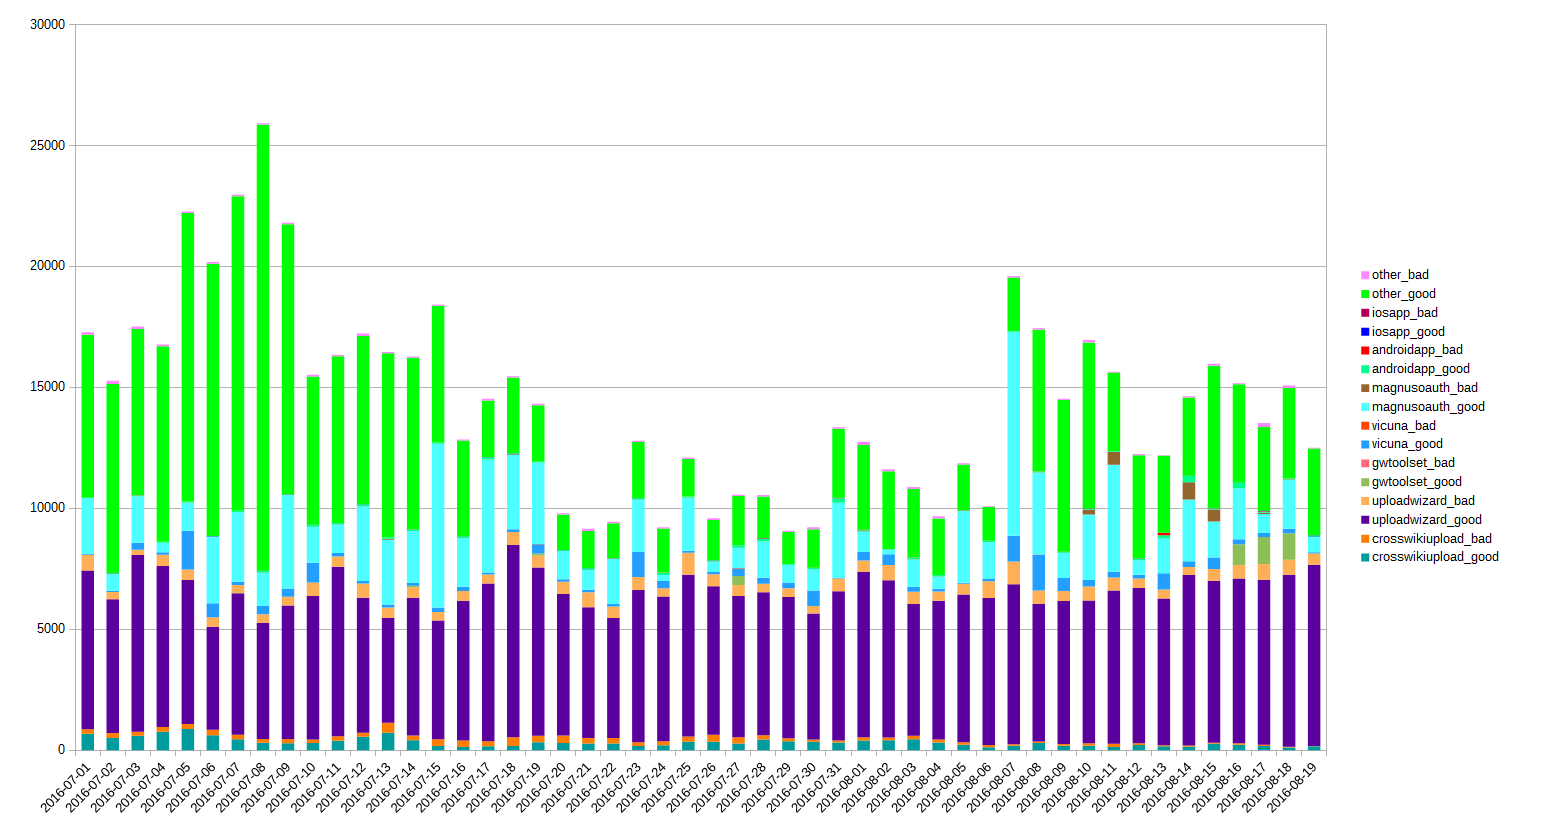
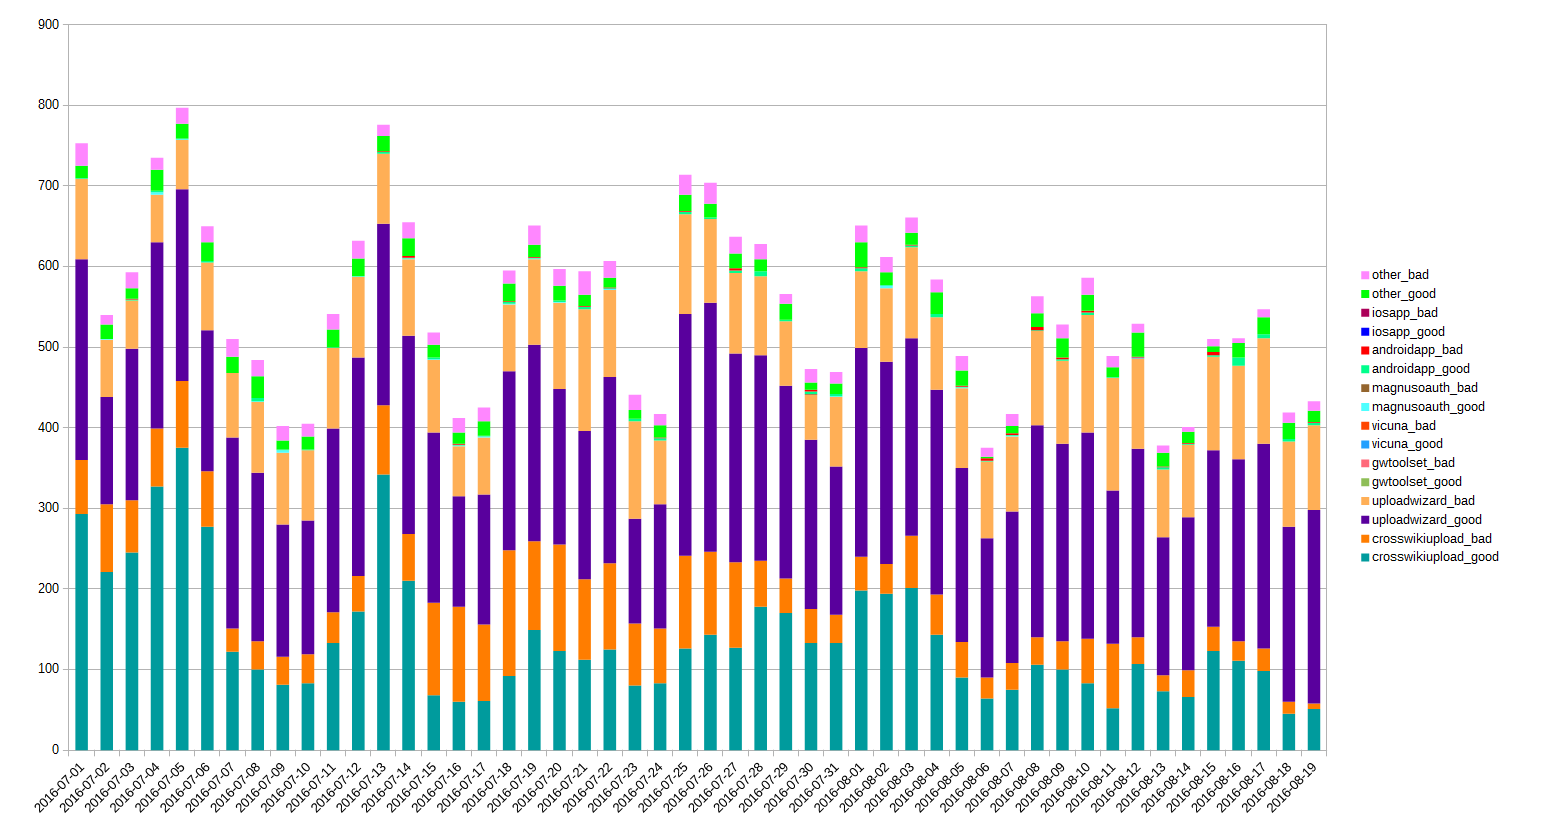
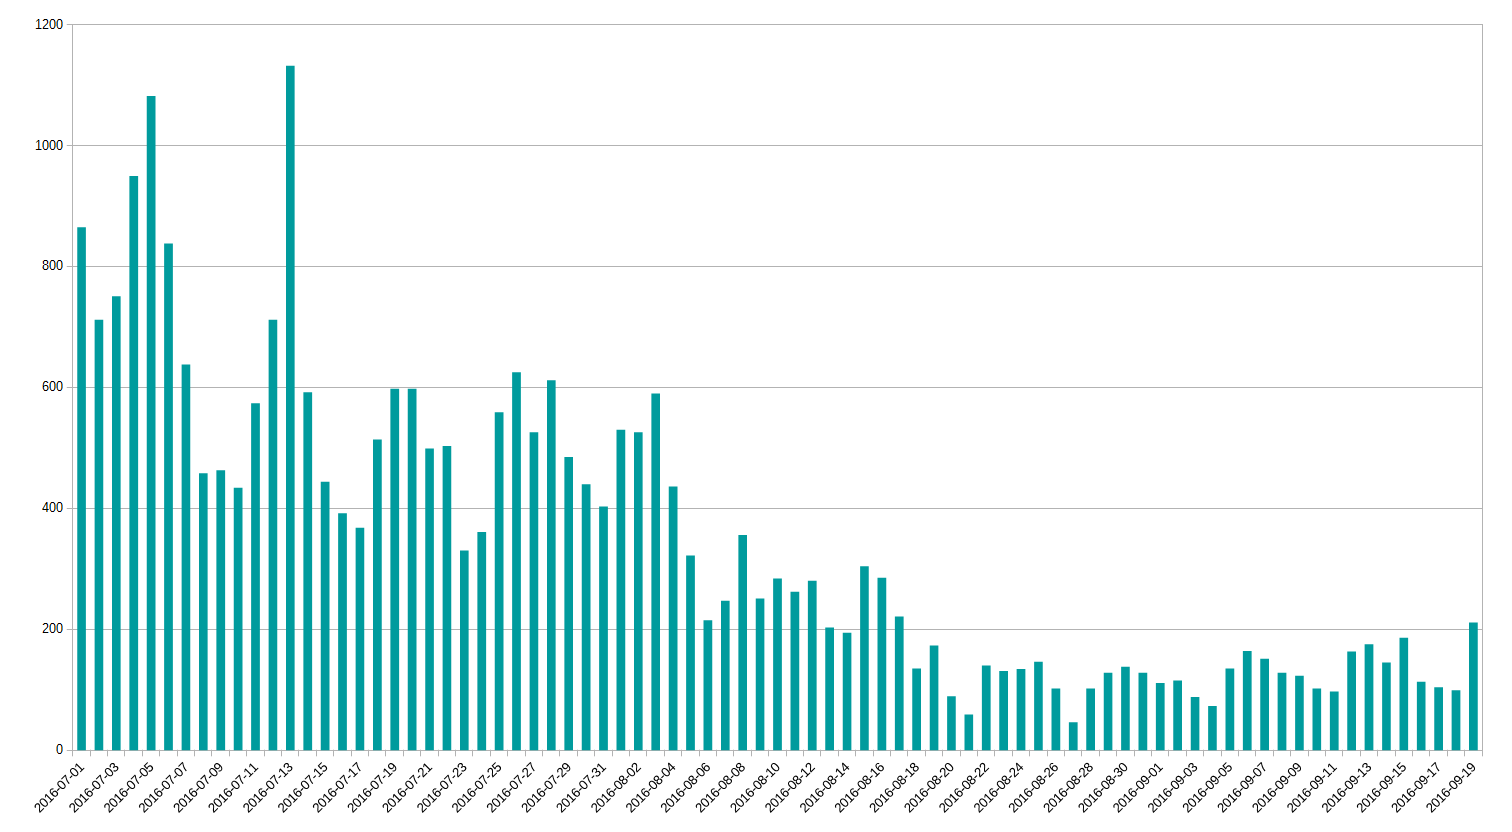
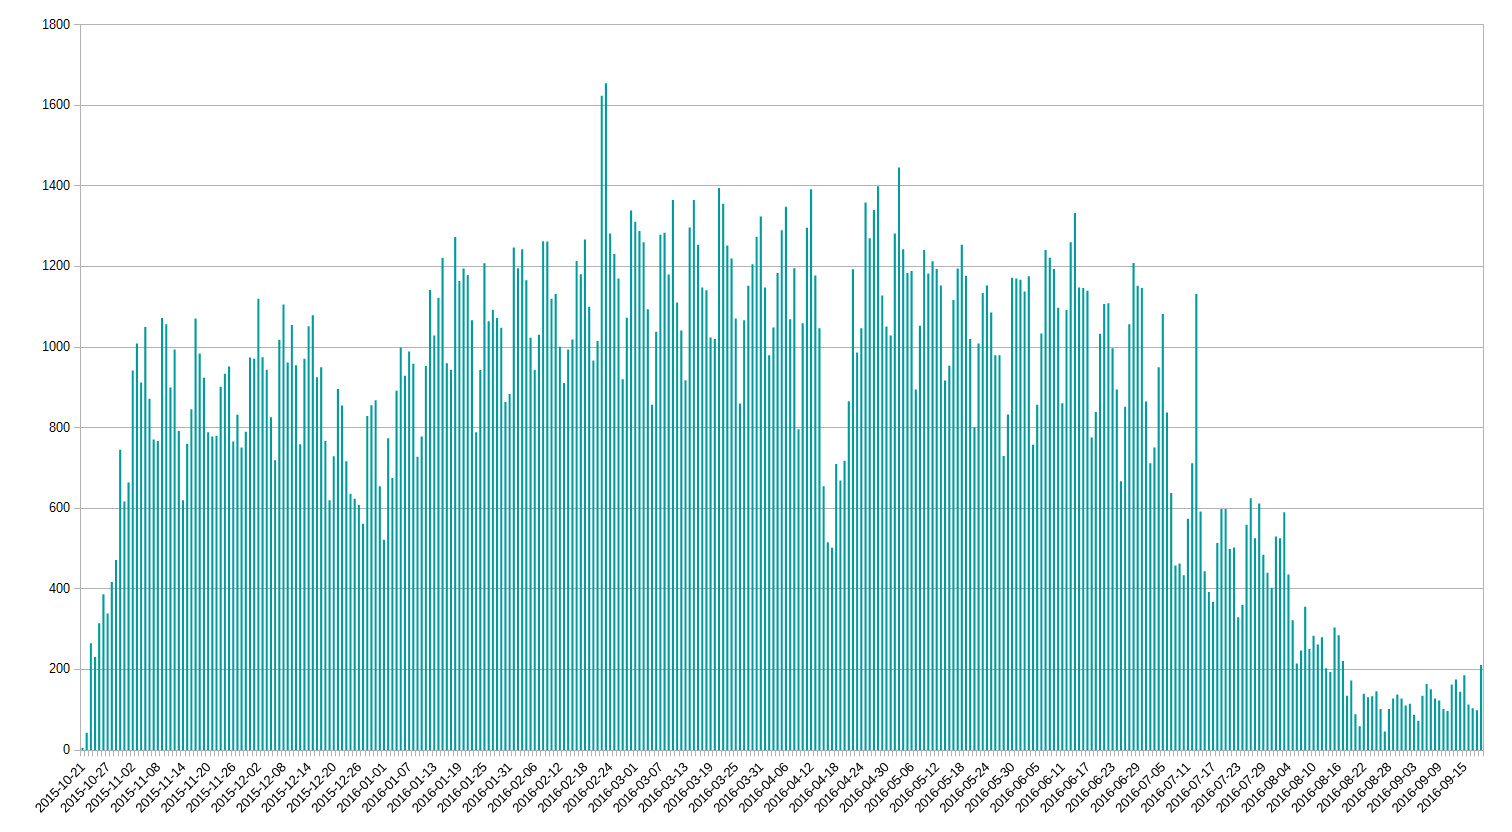
We should find out how exactly the new anti-copyvio abusefilters on Commons (https://commons.wikimedia.org/wiki/Commons:Abuse_filter/Automated_copyvio_detection) are affecting uploads (how many fewer uploads there are by each tool, and how much the percentage of "good" (=not deleted) uploads improved). And maybe close T120867 is the effect is nice.

I'll dig up my old code from T120867 (https://github.com/MatmaRex/commons-crosswiki-uploads) and try to rewrite it into something that can be run more quickly (fewer big API downloads with results parsed by bespoke scripts, more SQL queries).

Event Timeline

So here's the stuff, the graphs are mostly the same as T120867#1870223 and T120867#1876785 a while ago – with a few differences:

  • Fewer tools are identified, because most just had really small number of uploads and it just makes the chart too busy
  • First-time uploaders are more correctly identified (deleted uploads a long time ago count and non-upload contributions don't anymore; shouldn't be a big change)
  • Only deletions within a month of uploading are considered to make an image "bad"; if an image was deleted more than a month after uploading, it's still "good". I think this allows us to more sanely compare the quality of recent and older uploads; obviously, older uploads have a bigger chance of being deleted, because there was more time to scrutinize them, and that skewed the results a bit. So, to repeat, "bad" is not an absolute number of how many of the uploads were deleted, but the ratios between different upload types and different dates are more comparable.

My queries are for the period of 2016-07-01 to 2016-08-20 (a month ago). This is to not show recently uploaded files which have not been triaged yet. (And conveniently it avoids the WLM contest, which results in new users uploading two times more files than normal and messing up my stats.)

The big anti-copyvio filters were enabled:


And now here's the stuff for real:

From bottom to top: cross-wiki uploads, UploadWizard, GWToolset, VicuñaUploader, Magnus' tools (mostly Flickr2Commons), Android and iOS apps, and everything else (including Special:Upload).

All uploads, by all users

everyone.png (832×1 px, 57 KB)


/

This one is really rather uninteresting. I'm mostly including it to show the relative magnitude of cross-wiki uploads, UploadWizard uploads and everything else. But you can see the number of cross-wiki uploads (teal and orange slivers at the bottom) decrease. UploadWizard uploads look unaffected, and other uploading tools already have huge variances (presumably people mostly use them for big batch uploads).

First-time uploads

This only includes files which were the very first file uploaded by a given user. Note the different scale from the previous chart.

newusers.png (832×1 px, 66 KB)


/

So yes, number of cross-wiki uploads decreases noticeably, and their quality also noticeably increases. It doesn't seem to line up very well with the dates that the filters changed though? Probably just random noise.

Uploads by UploadWizard and other tools don't seem to be affected.

Once again I'd like to note that the quality of the upload is mostly independent of the tool which was used to upload it. New users just upload copyvios, no matter how many steps they have to click through and how many big red warnings they are shown.

Cross-wiki upload counts

crosswiki.png (832×1 px, 38 KB)


/

Just in case previous charts did not convince you, here's a simple query to just count the number of cross-wiki uploads. It has decreased a lot. (This one goes up to today.)

@matmarex: Actually, from the last graph I see there is a slight change of trend just around the cutoff date for the rest of the graphs (from abruptly down to slightly up). Is it related to WLM or some other software change that was made around that time?

I don't think there were any software changes which could cause that, perhaps one of the abusefilters was relaxed a little bit and I missed that. Perhaps it's just caused by the normal long-term growth of the number of users. Or perhaps it's a seasonal change. Or perhaps it is indeed WLM. Or perhaps someone worked out what the filters reject and how to work around it. Or maybe it's just random. I honestly don't know :)

If you're curious, I extended that query to all the time that cross-wiki uploads have been live (almost a year now, the feature was deployed on 2015-10-21). (Big dip near April 13 was caused by T132612.)

crosswiki.png (832×1 px, 52 KB)


/

An interactive visualization of the CSV files that @matmarex shared - https://prtksxna.github.io/upload-stats/. Clicking around will show that bad uploads are correlated with new users no matter the tool. Hope it helps.

Let me know if you we want a different dataset on this

An interactive visualization of the CSV files that @matmarex shared - https://prtksxna.github.io/upload-stats/. Clicking around will show that bad uploads are correlated with new users no matter the tool. Hope it helps.

Let me know if you we want a different dataset on this

Cool stats. Thanks!