Page MenuHomePhabricator

Investigate seemingly random Gerrit slow-downs
Closed, ResolvedPublic

Assigned To
Authored By
Paladox
Oct 17 2016, 10:57 PM
Referenced Files
F6320360: cobalt_mem_use.png
Mar 8 2017, 9:37 AM
F5628900: cobalt_disk_io_7days.png
Feb 14 2017, 11:14 AM
F5628886: cobalt_memory_7days.png
Feb 14 2017, 11:14 AM
F5628818: t.tar.gz
Feb 14 2017, 11:03 AM
F5231081: jvm_gc.pid38898.log.4.current
Jan 5 2017, 12:02 AM
F5076613: gerrit-spikes-20161216.png
Dec 16 2016, 9:49 PM
F5076667: jvm_gc.pid58754.log.8.current
Dec 16 2016, 9:49 PM
F5073037: Capture d’écran 2016-12-16 à 17.08.46.png
Dec 16 2016, 4:10 PM
Tokens
"Like" token, awarded by jcrespo."Burninate" token, awarded by MarcoAurelio.

Description

On October 17 2016, gerrit slowed down to the point the website wasn't loading or was taking a long time to load.

Firsts reports

<cwd> gerrit down?
<paladox> gerrit.wikimedia.org is not loading for me

<p858snake|L2_> mutante: ERR_TIMED_OUT for me, seemed to hanged at "Establishing secure connection" for me

@Dzahn restarts gerrit

<mutante> !log restarted gerrit on cobalt

<mutante> so yea, just restarted the service
<mutante> with the normal init.d script

and it works again.

18/10/2016

<andrewbogott> _joe_: they look fine to me — I'm going to leave the submit and merge to you because my gerrit is super slow for some reason
<andrewbogott> (maybe yours is too :/ )
<_joe_> andrewbogott: heh indeed
<mutante> andrewbogott: do you mean jenkins/zuul or actual gerrit
<andrewbogott> actual gerrit
<andrewbogott> like when I try to change views there's a 30-second or so pause
<mutante> interesting, i cant confirm that
<mutante> yet
<mutante> seems fast to me
<mutante> it had this slow down yesterday where i had to restart it, but now it seems normal
<mutante> now i see what Andrew means.. hmmm

gerrit after that then went down at 19:20pm bst time

<mutante> now i see what Andrew means.. hmmm

On October 21 2016

<Nikerabbit> gerrit web interface not responding atm
<AndyRussG> Nikerabbit: it's working for me, but excruciatingly slowly...
<Dereckson> Nikerabbit: Gerrit back at normal speed for me

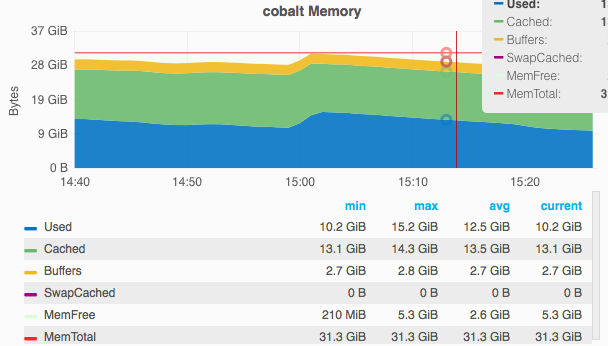
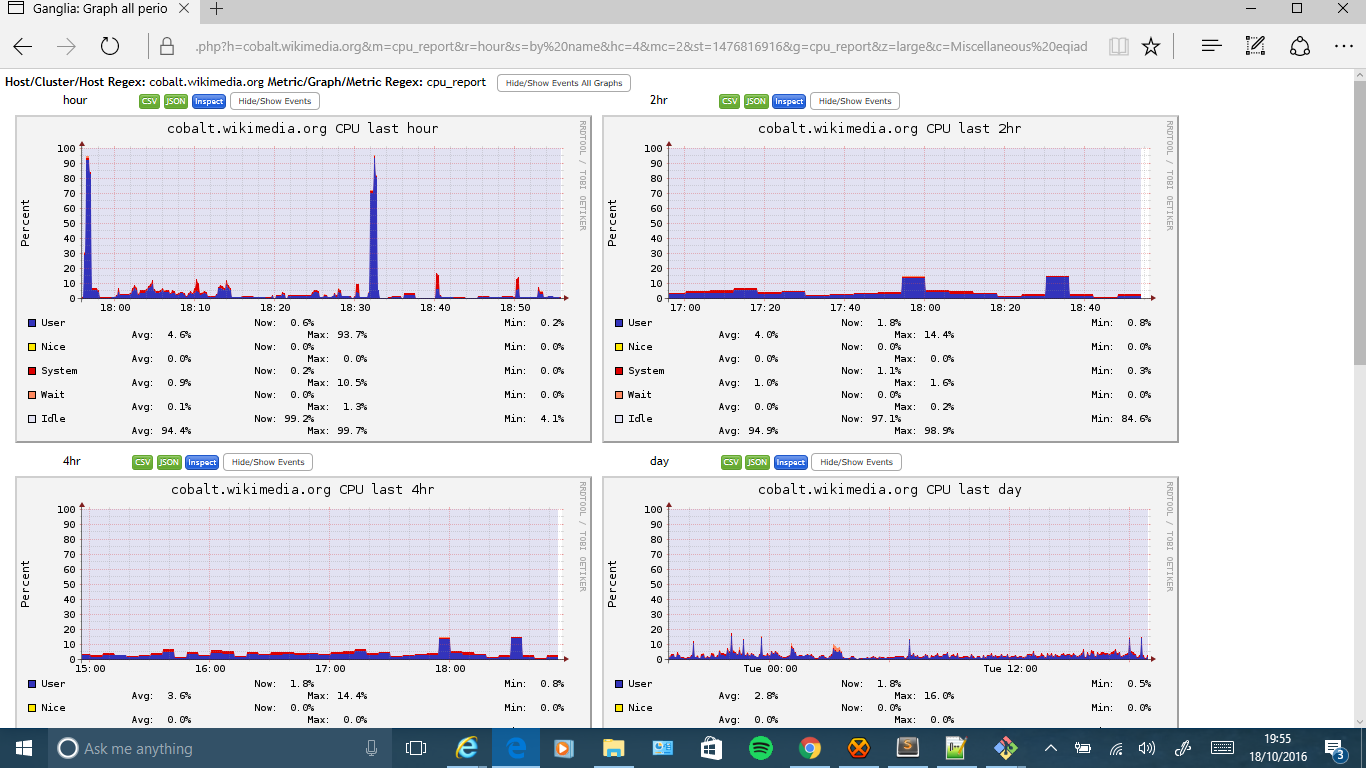
But when it slowed down on October 21 2016 there was no indications that gc was running and no high cpu either nor ram.


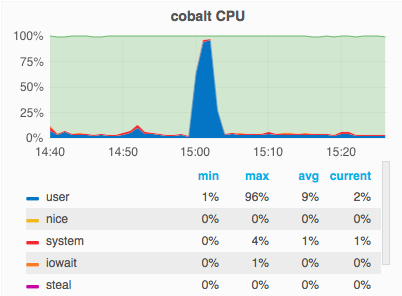
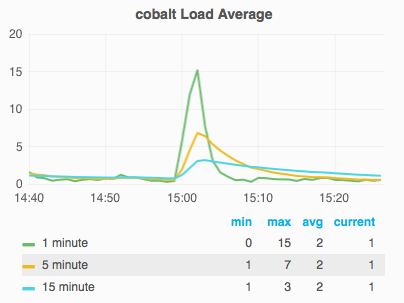
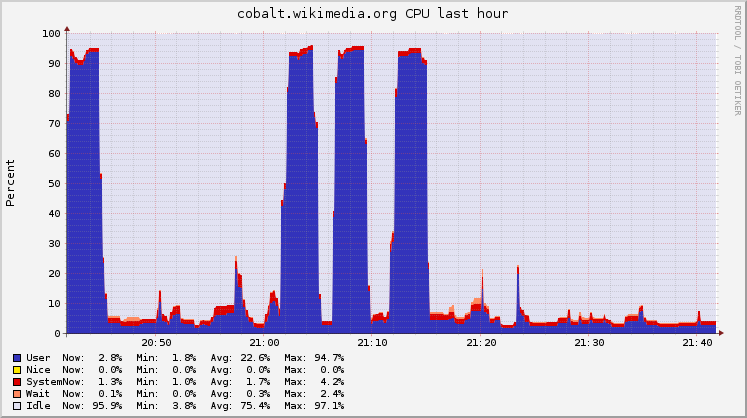
High cpu usage around the time the problem starts

Screenshot (1).png (768×1 px, 140 KB)


Problem started at around 3pm

Gerrit was reported by @hashar to not be working properly on the 16/12/2016. The cpu was very high at the time of the report

<hashar> I think Gerrit has exploded

@Krenair found the web service was broken but ssh was fine

<Krenair> gerrit sshd is fine
<Krenair> web server is broken

The new report from 16/12/2016 is after gc was disabled so maybe an aftermath of the problem or another problem just we were thinking it was gc for the other reports?

Investigate the following dates:

  • 17/10/2016 (October 17, 2016)
  • 18/10/2016 (October 18, 2016)
  • 21/10/2016 (October 21, 2016)
  • 30/11/2016 (November 30, 2016)
  • 16/12/2016 (December 16, 2016)
  • 01/01/2017 (January 1, 2017)
  • 04/01/2017 (January 4, 2017)
  • 10/02/2017 (February 10, 2017)

Event Timeline

There are a very large number of changes, so older changes are hidden. Show Older Changes

The cpu seems to be still very high https://ganglia.wikimedia.org/latest/?r=hour&cs=&ce=&m=cpu_report&c=Miscellaneous+eqiad&h=cobalt.wikimedia.org&tab=m&vn=&hide-hf=false&mc=2&z=medium&metric_group=NOGROUPS_%7C_network

Also at the same times gerrit slows down, just for a second, but today it was really slow and it just stopped working. Possibly because of jgit gc but something else is using 92% cpu on the server and it is not gc as we have disabled it today.

Paladox renamed this task from Investigate why gerrit slowed down on 17/10/2016 / 18/10/2016 / 21/10/2016 30/11/2016 to Investigate why gerrit slowed down on 17/10/2016 / 18/10/2016 / 21/10/2016 / 30/11/2016 / 16/12/2016.Dec 16 2016, 4:02 PM
Paladox updated the task description. (Show Details)
Paladox added subscribers: Krenair, hashar.
Paladox renamed this task from Investigate why gerrit slowed down on 17/10/2016 / 18/10/2016 / 21/10/2016 / 30/11/2016 / 16/12/2016 to Gerrit: Investigate why gerrit slowed down on 17/10/2016 / 18/10/2016 / 21/10/2016 / 30/11/2016 / 16/12/2016.Dec 16 2016, 4:05 PM
Paladox updated the task description. (Show Details)

For the December 16th issue, there were multiple threads at 100% CPU and HTOP reported ~ 1500% CPU usage. The web interface was not responsive. It lasted for roughly 5 minutes at 15:00 UTC.

Apparently nothing suspicious in the logs. By the time we tried to get a thread dump, the issue self resolved.

From https://grafana.wikimedia.org/dashboard/file/server-board.json?var-server=cobalt&var-network=eth0&from=1481899251125&to=1481901929206

Capture d’écran 2016-12-16 à 17.08.26.png (296×402 px, 31 KB)

Capture d’écran 2016-12-16 à 17.08.33.png (303×404 px, 32 KB)

Capture d’écran 2016-12-16 à 17.09.01.png (243×400 px, 42 KB)

Capture d’écran 2016-12-16 à 17.08.38.png (290×407 px, 42 KB)

Capture d’écran 2016-12-16 à 17.08.46.png (346×608 px, 49 KB)

@hashar that sounds like the prevous problems described on here, i noticed gerrit's cpu gets high every couple of hours and sometimes that leads into gerrit being paused. This sounds like's java's gc not the jgit gc.

Also note that when all the ram is used, java's gc normaly kicks in.

https://ganglia.wikimedia.org/latest/graph_all_periods.php?h=cobalt.wikimedia.org&m=cpu_report&r=hour&s=by%20name&hc=4&mc=2&st=1481904276&g=mem_report&z=large&c=Miscellaneous%20eqiad

Change 327763 had a related patch set (by Paladox) published:
Gerrit: Enable g1 gc as we now use java 8

https://gerrit.wikimedia.org/r/327763

@Paladox pointed out these spikes today

gerrit-spikes-20161216.png (418×747 px, 40 KB)

Here is the newest of the custom gc log files we write to /srv/gerrit/jvmlogs/

as of now.

Mentioned in SAL (#wikimedia-operations) [2017-01-05T00:00:33Z] <mutante> gerrit slowdown reported around 23:55 UTC, was back to normal after 2 minutes (T148478) - attaching latest jvm_gc log

Paladox renamed this task from Gerrit: Investigate why gerrit slowed down on 17/10/2016 / 18/10/2016 / 21/10/2016 / 30/11/2016 / 16/12/2016 to Gerrit: Investigate why gerrit slowed down on 17/10/2016 / 18/10/2016 / 21/10/2016 / 30/11/2016 / 16/12/2016 / 04/01/2017 / 05/01/2017.Jan 5 2017, 12:26 AM
Paladox renamed this task from Gerrit: Investigate why gerrit slowed down on 17/10/2016 / 18/10/2016 / 21/10/2016 / 30/11/2016 / 16/12/2016 / 04/01/2017 / 05/01/2017 to Gerrit: Investigate why gerrit slowed down on 17/10/2016 / 18/10/2016 / 21/10/2016 / 30/11/2016 / 16/12/2016 / 04/01/2017.

should the priority be set to high so we can figure out what is really actually causing it then come up with a fix? We know that it is the gc, but it could be something else but most likely the gc at this time.

BTW, there was a short gerrit outage (icinga timeouts, at least), around 1am on 2017-01-01, maybe related. The working theory (which would match at least the last 2 incidents) is that it would happen at the same time than HHVM high rate of errors, which would point to logstash/logging issues.

Paladox renamed this task from Gerrit: Investigate why gerrit slowed down on 17/10/2016 / 18/10/2016 / 21/10/2016 / 30/11/2016 / 16/12/2016 / 04/01/2017 to Gerrit: Investigate why gerrit slowed down on 2016 / 2017.Jan 5 2017, 12:30 AM
Paladox updated the task description. (Show Details)

BTW, there was a short gerrit outage (icinga timeouts, at least), around 1am on 2017-01-01, maybe related.

Most likely

BTW, there was a short gerrit outage (icinga timeouts, at least), around 1am on 2017-01-01, maybe related.

Thanks, most likely related.

Check my comment update if that can give a clue^

We were planning to make Gerrit log to logstash, but it's not doing it just yet, a patch for that was waiting to be done during tomorrow's maintenance window, actually.

greg renamed this task from Gerrit: Investigate why gerrit slowed down on 2016 / 2017 to Investigate seemingly random Gerrit slowdowns.Feb 10 2017, 10:54 PM
JustBerry raised the priority of this task from Medium to Unbreak Now!.EditedFeb 10 2017, 10:55 PM
JustBerry added subscribers: greg, JustBerry.

@greg Important enough. Been affecting several users on IRC.

Paladox lowered the priority of this task from Unbreak Now! to High.Feb 10 2017, 10:56 PM

Happened again. This time it is different as we have switched gc off. But cpu looks high.

Happened every 2 minutes in the last 20 mins.

Paladox raised the priority of this task from High to Unbreak Now!.Feb 10 2017, 10:56 PM

@Andrew @daniel mentioned similar issues over IRC not long ago.

Task seems important in that it is affecting users' (such as andrew's) abilities to upload critical patches, such as patches relevant to the issues highlighted by shinken-wm in -labs earlier.

17:49 shinken-wm: RECOVERY - Puppet run on tools-exec-1417 is OK: OK: Less than 1.00% above the threshold [0.0]
17:50 shinken-wm: RECOVERY - Puppet run on tools-exec-1406 is OK: OK: Less than 1.00% above the threshold [0.0]
17:51 shinken-wm: RECOVERY - Puppet run on tools-webgrid-lighttpd-1205 is OK: OK: Less than 1.00% above the threshold [0.0]
17:52 shinken-wm: RECOVERY - Puppet run on tools-webgrid-lighttpd-1412 is OK: OK: Less than 1.00% above the threshold [0.0]
17:52 shinken-wm: RECOVERY - Puppet run on tools-exec-1217 is OK: OK: Less than 1.00% above the threshold [0.0]
17:52 shinken-wm: RECOVERY - Puppet run on tools-webgrid-lighttpd-1408 is OK: OK: Less than 1.00% above the threshold [0.0]
17:53 shinken-wm: RECOVERY - Puppet run on tools-exec-1409 is OK: OK: Less than 1.00% above the threshold [0.0]
17:53 shinken-wm: RECOVERY - Puppet run on tools-bastion-02 is OK: OK: Less than 1.00% above the threshold [0.0]
17:53 shinken-wm: RECOVERY - Puppet run on tools-webgrid-lighttpd-1409 is OK: OK: Less than 1.00% above the threshold [0.0]
17:53 shinken-wm: RECOVERY - Puppet run on tools-exec-gift is OK: OK: Less than 1.00% above the threshold [0.0]
17:54 shinken-wm: RECOVERY - Puppet run on tools-webgrid-lighttpd-1210 is OK: OK: Less than 1.00% above the threshold [0.0]
17:54 shinken-wm: RECOVERY - Puppet run on tools-webgrid-lighttpd-1209 is OK: OK: Less than 1.00% above the threshold [0.0]
17:54 shinken-wm: RECOVERY - Puppet run on tools-webgrid-lighttpd-1416 is OK: OK: Less than 1.00% above the threshold [0.0]
17:54 shinken-wm: RECOVERY - Puppet run on tools-exec-1412 is OK: OK: Less than 1.00% above the threshold [0.0]
17:55 shinken-wm: RECOVERY - Puppet run on tools-exec-1410 is OK: OK: Less than 1.00% above the threshold [0.0]
17:55 shinken-wm: RECOVERY - Puppet run on tools-exec-1220 is OK: OK: Less than 1.00% above the threshold [0.0]
17:56 shinken-wm: RECOVERY - Puppet run on tools-bastion-03 is OK: OK: Less than 1.00% above the threshold [0.0]
17:57 shinken-wm: RECOVERY - Puppet run on tools-webgrid-generic-1402 is OK: OK: Less than 1.00% above the threshold [0.0]
17:58 shinken-wm: RECOVERY - Puppet run on tools-webgrid-lighttpd-1202 is OK: OK: Less than 1.00% above the threshold [0.0]
17:58 shinken-wm: RECOVERY - Puppet run on tools-webgrid-lighttpd-1410 is OK: OK: Less than 1.00% above the threshold [0.0]
17:58 shinken-wm: RECOVERY - Puppet run on tools-cron-01 is OK: OK: Less than 1.00% above the threshold [0.0]
17:58 shinken-wm: RECOVERY - Puppet run on tools-exec-1420 is OK: OK: Less than 1.00% above the threshold [0.0]
17:58 shinken-wm: RECOVERY - Puppet run on tools-webgrid-lighttpd-1415 is OK: OK: Less than 1.00% above the threshold [0.0]

Times in EST...

Just to get an idea of the issue's scope:

18:03 DanielK_WMDE: greg-g: it has been slow for at least half an hour, seems to be getting worse
...
18:03 greg-g: DanielK_WMDE: yep
18:03 mafk: yup

Times in EST...

Seems to be server-side rather than client-side.

Seems to be gerrit?

18:06 icinga-wm: PROBLEM - Unmerged changes on repository puppet on labcontrol1001 is CRITICAL: CHECK_NRPE: Socket timeout after 10 seconds.
18:06 icinga-wm: PROBLEM - Unmerged changes on repository puppet on puppetmaster1001 is CRITICAL: CHECK_NRPE: Socket timeout after 10 seconds.
18:06 icinga-wm: PROBLEM - Unmerged changes on repository puppet on puppetmaster2001 is CRITICAL: CHECK_NRPE: Socket timeout after 10 seconds.
18:06 icinga-wm: PROBLEM - Unmerged changes on repository puppet on rhodium is CRITICAL: CHECK_NRPE: Socket timeout after 10 seconds.
18:07 icinga-wm: PROBLEM - Unmerged changes on repository puppet on labtestcontrol2001 is CRITICAL: CHECK_NRPE: Socket timeout after 10 seconds.
18:07 icinga-wm: PROBLEM - Unmerged changes on repository puppet on puppetmaster1002 is CRITICAL: CHECK_NRPE: Socket timeout after 10 seconds.

Times in EST...

Some observations: pushing takes about a minute, but gets through eventually. Auto-compelte for reviewers is broken in the UI (times out, i guess). Everything just takes forever.

also this just popped up

<icinga-wm> PROBLEM - Check whether ferm is active by checking the default input chain on cobalt is CRITICAL: ERROR ferm input drop default policy not set, ferm might not have been started correctly

now it has done

<icinga-wm> RECOVERY - Check whether ferm is active by checking the default input chain on cobalt is OK: OK ferm input default policy is set

Quick update, if I may:

18:10 icinga-wm: RECOVERY - Unmerged changes on repository puppet on rhodium is OK: No changes to merge.
18:10 icinga-wm: RECOVERY - Unmerged changes on repository puppet on puppetmaster1001 is OK: No changes to merge.
18:10 icinga-wm: RECOVERY - Unmerged changes on repository puppet on labcontrol1001 is OK: No changes to merge.
18:10 icinga-wm: RECOVERY - Unmerged changes on repository puppet on puppetmaster2001 is OK: No changes to merge.
18:10 icinga-wm: RECOVERY - Unmerged changes on repository puppet on puppetmaster1002 is OK: No changes to merge.
18:10 icinga-wm: RECOVERY - Unmerged changes on repository puppet on labtestcontrol2001 is OK: No changes to merge.
18:11 icinga-wm: RECOVERY - Unmerged changes on repository puppet on puppetmaster2002 is OK: No changes to merge.

Times in EST...

Seems similar.

Yes, that's a cascading issue. We routinely get puppet failures when Gerrit/Git is down

Those most likely are using gerrit to clone repo's. Which means if gerrit goes down then puppet fails on those hosts as they will be unable to clone.

Paladox renamed this task from Investigate seemingly random Gerrit slowdowns to Investigate seemingly random Gerrit slow-downs.Feb 10 2017, 11:14 PM

+ 2017-02-10 23:12 RainbowSprinkles: gerrit: restarting service to https://wikitech.wikimedia.org/wiki/Server_Admin_Log. After the restart, a handful of users have indicated that the service seems to be working for them now.

Paladox lowered the priority of this task from Unbreak Now! to High.Feb 10 2017, 11:29 PM

As it is fixed now we can lower it to high.

I've got a pretty strong suspicion that this will fix the overall issue.

2 observations after doing a short dive into GC logs:

  • it looks like most of the time (looking at logs over the past several days) the heap after GC is between 2 and 6 Go, but we have a configured heap size of 28 Go. It looks to me like the heap is very much oversized, which would make any GC issue worse.
  • looking specifically at the logs for Feb 10 17:11 to 23:12 with gceasy (the time mentioned in the issues above), there are a few strange looking things:
    • 2 cluster of major GC activity 21:15 to 21:30 and 22:30 to 23:10.
    • It looks like memory is recovered after full GC, but heap usage climbs again much faster than usual. This indicates a much higher memory allocation rate than usual.
    • even in that period, the maximum full GC time is 2470 ms (not great, but does not explain the issue on its own)
    • this looks to me like this is not a GC issue, but it looks more like a specific behaviour of gerrit, which allocates much more memory than the GC can reasonably collect. This might be related to specific user activity, specific gerrit maintenance tasks, or some weird bug.

Next step of investigation might be to collect regular thread dumps and see if we can see something strange during the next issue.

The 28G heap was for something that @demon was planning IIRC. Perhaps he can weigh in.

Happening again right 39.1 G of VIRT and 27.4G of RES. ps -eLf shows that Gerrit has ~ 200 threads.

Some thread dumps were collected:

Note: fastThread.io can help with the analysis.

Preliminary findings:

  • most thread (~150) seems to be parked in their respective queues. We might want to reduce the size of a few thread pools (this would require data over a longer period of time to validate).
  • most activity seems to be related to git-upload-pack
  • there might be a live lock issue, some upload pack requests are blocked on others ( org.eclipse.jgit.internal.storage.file.PackFile)
  • on the 14 thread dumps taken, I don't see any long lasting issue (no thread in the same code for more than a few seconds, no lock held for longer than a few seconds, ...). This would tend to indicate that the actual issue is an increase of traffic (or an increase of the cost of traffic). The multiple git-upload-pack and the increase IO on /srv seem to correlate.

Another potential issue is the memory usage Grafana board for cobalt. A view for the last 7 days:

cobalt_memory_7days.png (594×1 px, 145 KB)

I have no idea why the user memory (blue) surged recently, but the cached (green) is down to just 1 GBytes. If I understand memory properly, that would indicate there is only little memory the Linux disk cache can rely on. With the repositories ( /srv/gerrit/git ) being 15-20GBytes that would reflect in more disk I/O ?

Then that barely reflects in the Grafana board for cobalt disk I/O over 7 days:

cobalt_disk_io_7days.png (599×1 px, 120 KB)

gerrit show-caches takes roughly 45 seconds to complete:

Gerrit Code Review        2.13.4-13-gc0c5cc4742      now    11:26:37   UTC
                                                 uptime    3 days 11 hrs

  Name                          |Entries              |  AvgGet |Hit Ratio|
                                |   Mem   Disk   Space|         |Mem  Disk|
--------------------------------+---------------------+---------+---------+
  accounts                      |  1024               |  43.7ms | 99%     |
  accounts_byemail              |  1024               |   8.6ms | 99%     |
  accounts_byname               |  1024               |   1.7ms | 98%     |
  adv_bases                     |                     |         |         |
  change_notes                  |                     |         |         |
  changes                       |                     |         |         |
  groups                        |  1024               |   9.3ms | 84%     |
  groups_byinclude              |   636               |   8.4ms | 99%     |
  groups_byname                 |                     |         |         |
  groups_byuuid                 |  1024               |   9.6ms | 56%     |
  groups_external               |     1               |  10.7ms | 99%     |
  groups_members                |   385               |  13.6ms | 99%     |
  ldap_group_existence          |     4               |  50.9ms | 75%     |
  ldap_groups                   |   159               |  56.9ms | 99%     |
  ldap_groups_byinclude         |                     |         |         |
  ldap_usernames                |    11               |   5.7ms | 89%     |
  permission_sort               |  1024               |         | 99%     |
  plugin_resources              |     2               |         | 77%     |
  project_list                  |     1               |  49.8ms | 99%     |
  projects                      |  1024               |   3.3ms | 86%     |
  sshkeys                       |   153               |  49.0ms | 99%     |
  static_content                |    41               |   2.3ms | 83%     |
D change_kind                   | 16959 113393  51.41m|   5.8ms | 59%  99%|
D conflicts                     |  3624  10221   9.16m|         | 81% 100%|
D diff                          |  1778 187751 323.02m|  16.0ms | 51%  42%|
D diff_intraline                |  2014   6867   8.91m|  19.9ms | 40% 100%|
D git_tags                      |                0.00k|         |  0%     |
D mergeability                  |  8736 175033 116.06m|    3.4s | 42%  71%|
D oauth_tokens                  |                0.00k|         |         |
D web_sessions                  |   204    407 167.02k|         | 96%   0%|

SSH:      6  users, oldest session started   0 ms ago
Tasks:    4  total =    3 running +      0 ready +    1 sleeping
Mem: 26.54g total = 18.87g used + 6.97g free + 710.70m buffers
     26.54g max
        4096 open files

Threads: 16 CPUs available, 187 threads

@hashar and @Gehel thanks for all your traces :). Looks like the i/o issue we had on friday. Though we also found gc was the problem on friday. Does gc cause i/o problems?

@Paladox looking at the GC logs from last Friday (Feb 10) I don't really see a GC issue, but more a memory allocation issue. That is, I see the multiple full GC as a consequence, not as an indication that GC is behaving in a bad way and should be tuned. We see multiple full GC (see my earlier comment), but they seem to complete in almost reasonable time (max ~ 2 seconds) and they seem to be able to release memory.

High IO wait might have an influence on GC time (longer time needed to reach a safe point), but I'm not entirely sure.

My hypothesis is more that the high IO load is an indication of a lot of data going through gerrit (probably uploads, see other comment). To process this high IO gerrit most probably needs to allocate objects on the heap. And this allocation rate is getting higher than what the GC can reclaim in a reasonable time.

This is all about going up the causality chain. GC is a symptom, most probably caused by memory allocation rate issue. Now the question is: "what is causing all this allocation and can we do something about it".

Oh, would using ssd alleviate these problems as ssd are faster then hdd?

We didn't have this problem with gerrit's old server ytterbium. I believe ytterbium had an ssd, but I'm not really sure.

We didn't have this problem with gerrit's old server ytterbium. I believe ytterbium had an ssd, but I'm not really sure.

No, it didn't.

Oh, I wonder why ytterbium didn't have this problem. Could this be a bug in gerrit that is not really noticeable because upstream use google servers so they probly have a ton of storage and ram.

Oh, would using ssd alleviate these problems as ssd are faster then hdd?

Faster / better IO never hurts! Especially since we seem to have a bottleneck on IO.

That being said, we might trade an IO bottleneck for a memory allocation rate bottleneck (it looks like we might be close to the limit on both). What I would do:

  • dramatically reduce the amount of heap allocated to the JVM (probably to < 10Gb, but needs to be tested / validated)
  • find a way to correlate user activity with those issues (access logs, instrumentation, ...) and see if we can identify and block / limit the problematic activity (I suspect large uploads being the issue)

Faster / better IO never hurts! Especially since we seem to have a bottleneck on IO.

The new machine in Dallas will have SSDs. That will be an interesting benchmark to test against.

  • dramatically reduce the amount of heap allocated to the JVM (probably to < 10Gb, but needs to be tested / validated)

Sounds good, let's move towards that.

The docs contain all the info on heap size and various thread pools.

Change 337609 had a related patch set (by Paladox) published:
Gerrit: Lower heap size to 10gb

https://gerrit.wikimedia.org/r/337609

Change 337609 abandoned by Hashar:
Gerrit: Lower heap size to 10gb

Reason:
Paladox please let Chad/ Gehel handle this one :-} thx!

https://gerrit.wikimedia.org/r/337609

https://gerrit.wikimedia.org/r/#/c/341701/ lowered the heap from 28GB to 20GB

Graph of memory usage can be seen above T148478#3024661

For the last 7 days on cobalt:

cobalt_mem_use.png (606×872 px, 137 KB)

So with a lower java heap (used/blue), there will be more space for the OS disk cache (~10 G min).

Who knows why we sometime have huge memory demand that is not freed. Eg the used memory (blue) step on March 3th or 5th ~ 9am UTC or

The JVM makes no promises about releasing the memory to the OS. So it is possible that the memory has been freed from the application, but it still retained by the JVM. We do not set -Xms (minimum heap size) so the JVM is allowed to release unused memory to the OS, but it does that whenever it wants. In most cases, it makes sense to fix both -Xmx and -Xms to let the JVM keep a constant heap size (slightly more efficient and much more predictable).

If we have a look at the GC logs for the same period, we see that the heap after full GC always goes back down to 2-4Gb, which means that the memory is released from the application, but is kept by the JVM. If the JVM is allowed to grow the heap up to 20Gb, you can expect that it might use those 20Gb before trying to do a full GC...

Qualitatively, gerrit has been working ok to me lately, although it logged me out several times (I assume the service was restarted).

Happended again on the 02/04/17 bst time.

<icinga-wm> PROBLEM - configured eth on cobalt is CRITICAL: CHECK_NRPE: Socket timeout after 10 seconds.
[02:05:35] <icinga-wm> PROBLEM - MD RAID on cobalt is CRITICAL: CHECK_NRPE: Socket timeout after 10 seconds.
[02:05:35] <icinga-wm> PROBLEM - dhclient process on cobalt is CRITICAL: CHECK_NRPE: Socket timeout after 10 seconds.
[02:05:36] <icinga-wm> PROBLEM - gerrit process on cobalt is CRITICAL: CHECK_NRPE: Socket timeout after 10 seconds.
[02:05:36] <icinga-wm> PROBLEM - puppet last run on cobalt is CRITICAL: CHECK_NRPE: Socket timeout after 10 seconds.
[02:05:45] <icinga-wm> PROBLEM - Check systemd state on cobalt is CRITICAL: CHECK_NRPE: Socket timeout after 10 seconds.
[02:05:55] <icinga-wm> PROBLEM - Disk space on cobalt is CRITICAL: CHECK_NRPE: Socket timeout after 10 seconds.
[02:05:55] <icinga-wm> PROBLEM - DPKG on cobalt is CRITICAL: CHECK_NRPE: Socket timeout after 10 seconds.
[02:06:15] <icinga-wm> PROBLEM - Check the NTP synchronisation status of timesyncd on cobalt is CRITICAL: CHECK_NRPE: Socket timeout after 10 seconds.
[02:07:35] <icinga-wm> PROBLEM - Check whether ferm is active by checking the default input chain on cobalt is CRITICAL: CHECK_NRPE: Socket timeout after 10 seconds.
[02:07:35] <icinga-wm> PROBLEM - Check size of conntrack table on cobalt is CRITICAL: CHECK_NRPE: Socket timeout after 10 seconds.
[02:07:35] <icinga-wm> PROBLEM - salt-minion processes on cobalt is CRITICAL: CHECK_NRPE: Socket timeout after 10 seconds.
[02:07:35] <icinga-wm> PROBLEM - Check whether ferm is active by checking the default input chain on kubernetes1002 is CRITICAL: ERROR ferm input drop default policy not set, ferm might not have been started correctly

a minute later it said

<icinga-wm> RECOVERY - Check whether ferm is active by checking the default input chain on cobalt is OK: OK ferm input default policy is set
[02:08:25] <icinga-wm> RECOVERY - Check size of conntrack table on cobalt is OK: OK: nf_conntrack is 0 % full
[02:08:25] <icinga-wm> RECOVERY - salt-minion processes on cobalt is OK: PROCS OK: 1 process with regex args ^/usr/bin/python /usr/bin/salt-minion
[02:08:25] <icinga-wm> RECOVERY - configured eth on cobalt is OK: OK - interfaces up
[02:08:25] <icinga-wm> RECOVERY - dhclient process on cobalt is OK: PROCS OK: 0 processes with command name dhclient
[02:08:26] <icinga-wm> RECOVERY - MD RAID on cobalt is OK: OK: Active: 8, Working: 8, Failed: 0, Spare: 0
[02:08:26] <icinga-wm> RECOVERY - gerrit process on cobalt is OK: PROCS OK: 1 process with regex args ^GerritCodeReview .*-jar /var/lib/gerrit2/review_site/bin/gerrit.war
[02:08:27] <icinga-wm> RECOVERY - puppet last run on cobalt is OK: OK: Puppet is currently enabled, last run 10 minutes ago with 0 failures

But it didn't actually recover, gerrit was really slow.

a minute later after reporting the recovery errors, the problem thing came again

<icinga-wm>	PROBLEM - Check size of conntrack table on cobalt is CRITICAL: CHECK_NRPE: Socket timeout after 10 seconds.

[02:14:35] <icinga-wm> PROBLEM - Check whether ferm is active by checking the default input chain on cobalt is CRITICAL: CHECK_NRPE: Socket timeout after 10 seconds.
[02:14:35] <icinga-wm> PROBLEM - salt-minion processes on cobalt is CRITICAL: CHECK_NRPE: Socket timeout after 10 seconds.
[02:14:35] <icinga-wm> PROBLEM - configured eth on cobalt is CRITICAL: CHECK_NRPE: Socket timeout after 10 seconds.
[02:14:36] <icinga-wm> PROBLEM - MD RAID on cobalt is CRITICAL: CHECK_NRPE: Socket timeout after 10 seconds.
[02:14:36] <icinga-wm> PROBLEM - dhclient process on cobalt is CRITICAL: CHECK_NRPE: Socket timeout after 10 seconds.

None of the last two comments are related to the issue here. That sounds like icinga flapping, not the machine or service itself.

None of the last two comments are related to the issue here. That sounds like icinga flapping, not the machine or service itself.

Oh, gerrit became very slow at that time.

Machine had a load spike at 1:00am. It shows high disk IOPS since 1:00 and the disk utilisation largely exploded.

There is 35-45% CPU usage for md1_raid10 and 10% CPU usage for md1_resync.

EDIT: that was the monthly RAID check.

Change 327763 abandoned by Paladox:
Gerrit: Enable g1 gc as we now use java 8

https://gerrit.wikimedia.org/r/327763

demon claimed this task.

This hasn't been a problem since I readjusted internal caches (less churn) and we lowered the heap (don't need it so high). Tentatively resolving.

Change 372426 had a related patch set uploaded (by Chad; owner: Chad):
[operations/puppet@production] Gerrit: Also set minimum heap size

https://gerrit.wikimedia.org/r/372426

Change 372426 merged by Dzahn:
[operations/puppet@production] Gerrit: Also set minimum heap size

https://gerrit.wikimedia.org/r/372426

^ Merged but had to revert it as well. After merging the service would fail to start (tested on gerrit2001 before doing it on cobalt). So this is _not_ applied currently.

17:06 <+wikibugs> (CR) Dzahn: "17:04 < icinga-wm> RECOVERY - Check systemd state on gerrit2001 is OK: OK - running: The system is fully operational" [puppet] - https://gerrit.wikimedia.org/r/372569 (owner: Dzahn)

21:05 mutante: gerrit2001 - restarted gerrit again after reverting gerrit:372426, using systemctl commands, not 'service' or init.d
20:55 mutante: restarting gerrit on gerrit2001

demon lowered the priority of this task from High to Low.Sep 18 2017, 4:31 PM

This feels like it’s mostly resolved now.

Change 327763 restored by Paladox:
Gerrit: Enable g1 gc as we now use java 8

https://gerrit.wikimedia.org/r/327763