https://grafana.wikimedia.org/dashboard/db/resourceloader?panelId=35&fullscreen&from=now-24h&to=now
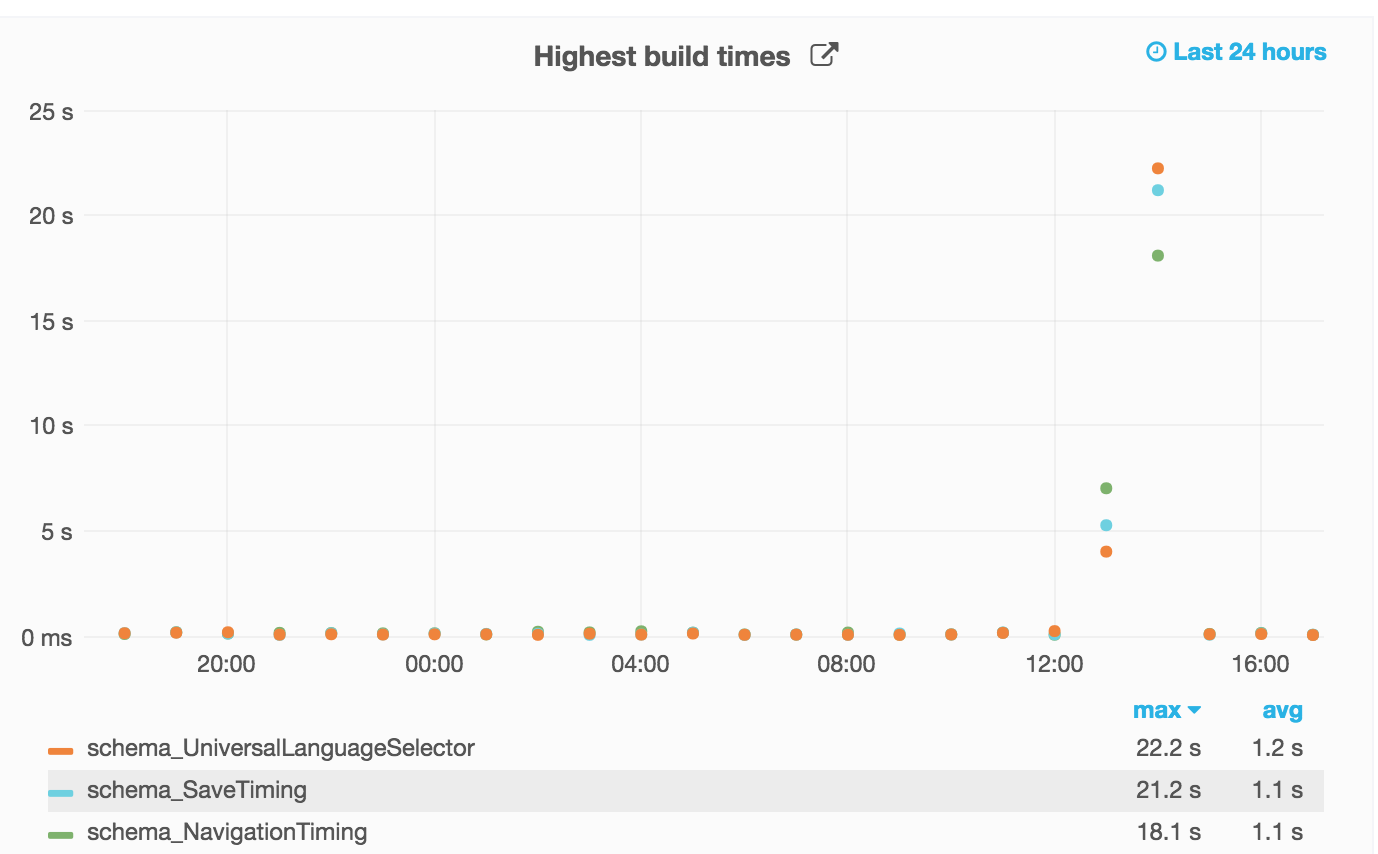
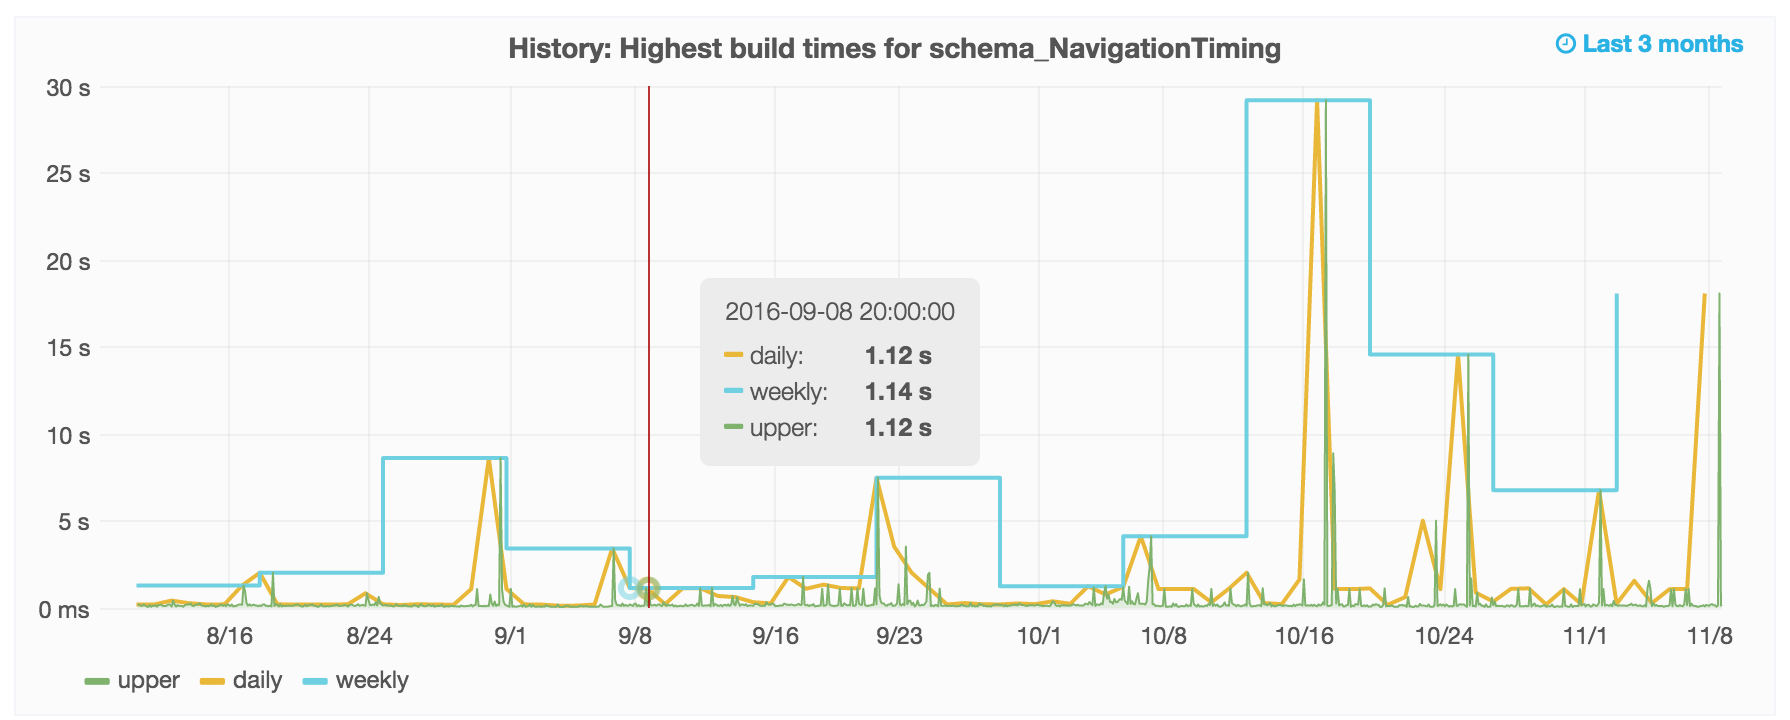
Not sure what's going on but this doesn't look good. These builds are typically expected to respond in far less than 1000ms.
https://grafana.wikimedia.org/dashboard/db/resourceloadermodule?var-module=schema_UniversalLanguageSelector
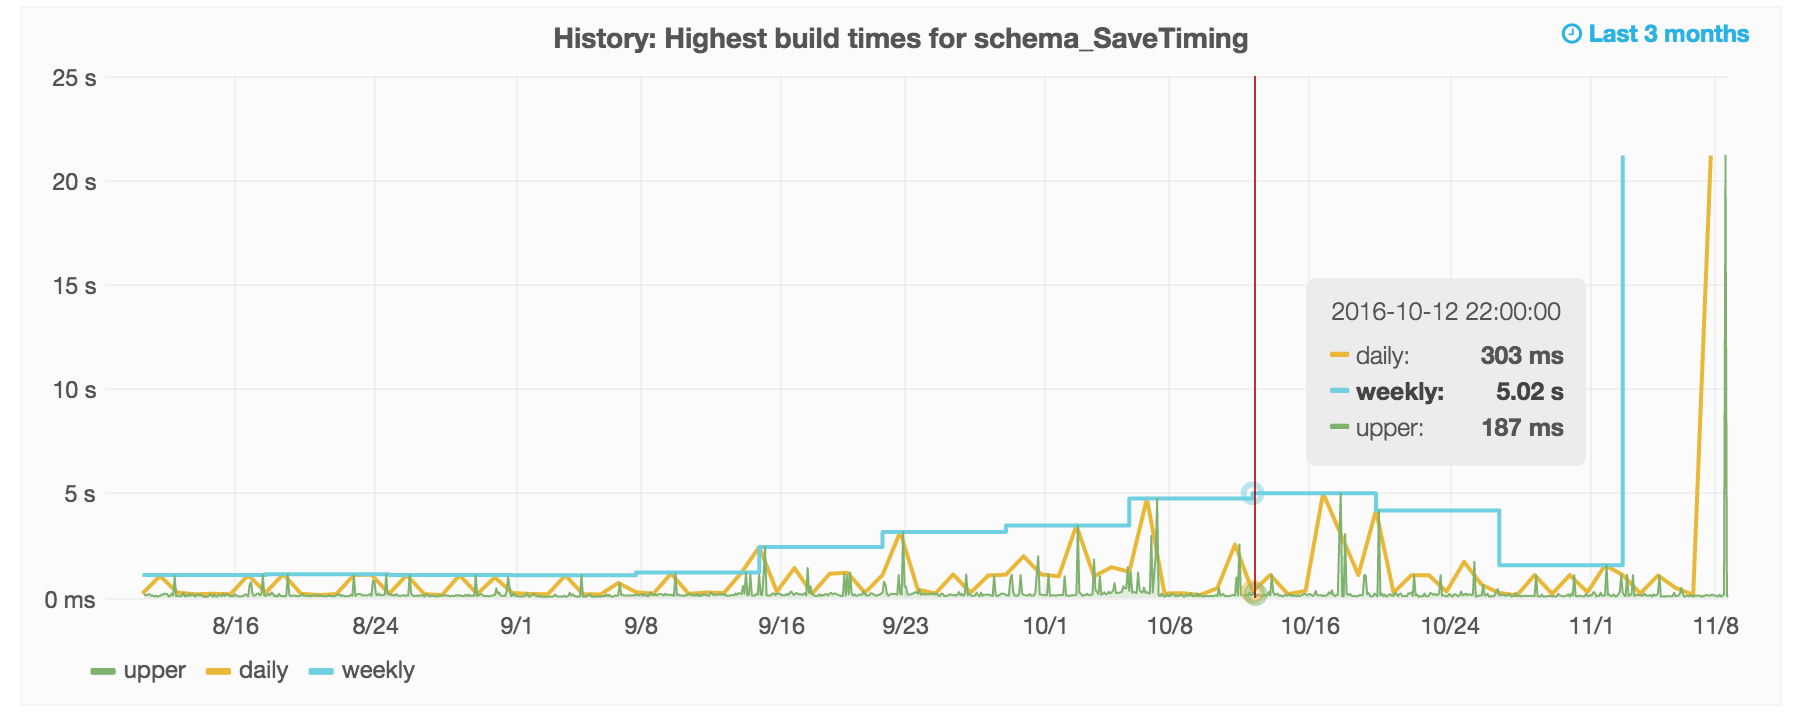
https://grafana.wikimedia.org/dashboard/db/resourceloadermodule?var-module=schema_SaveTiming
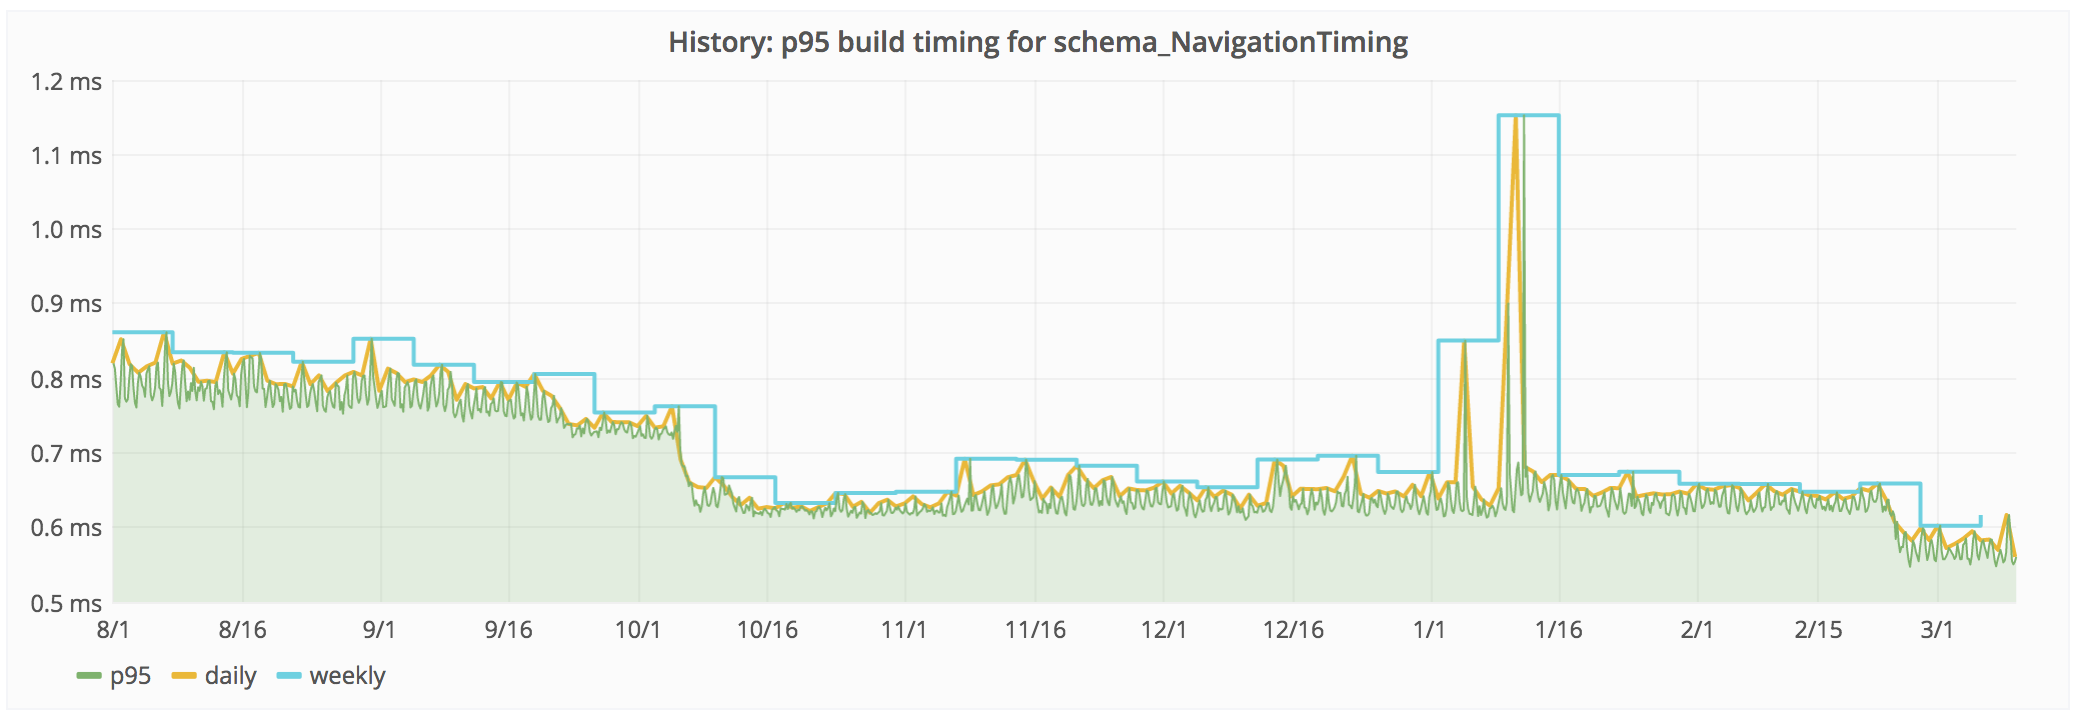
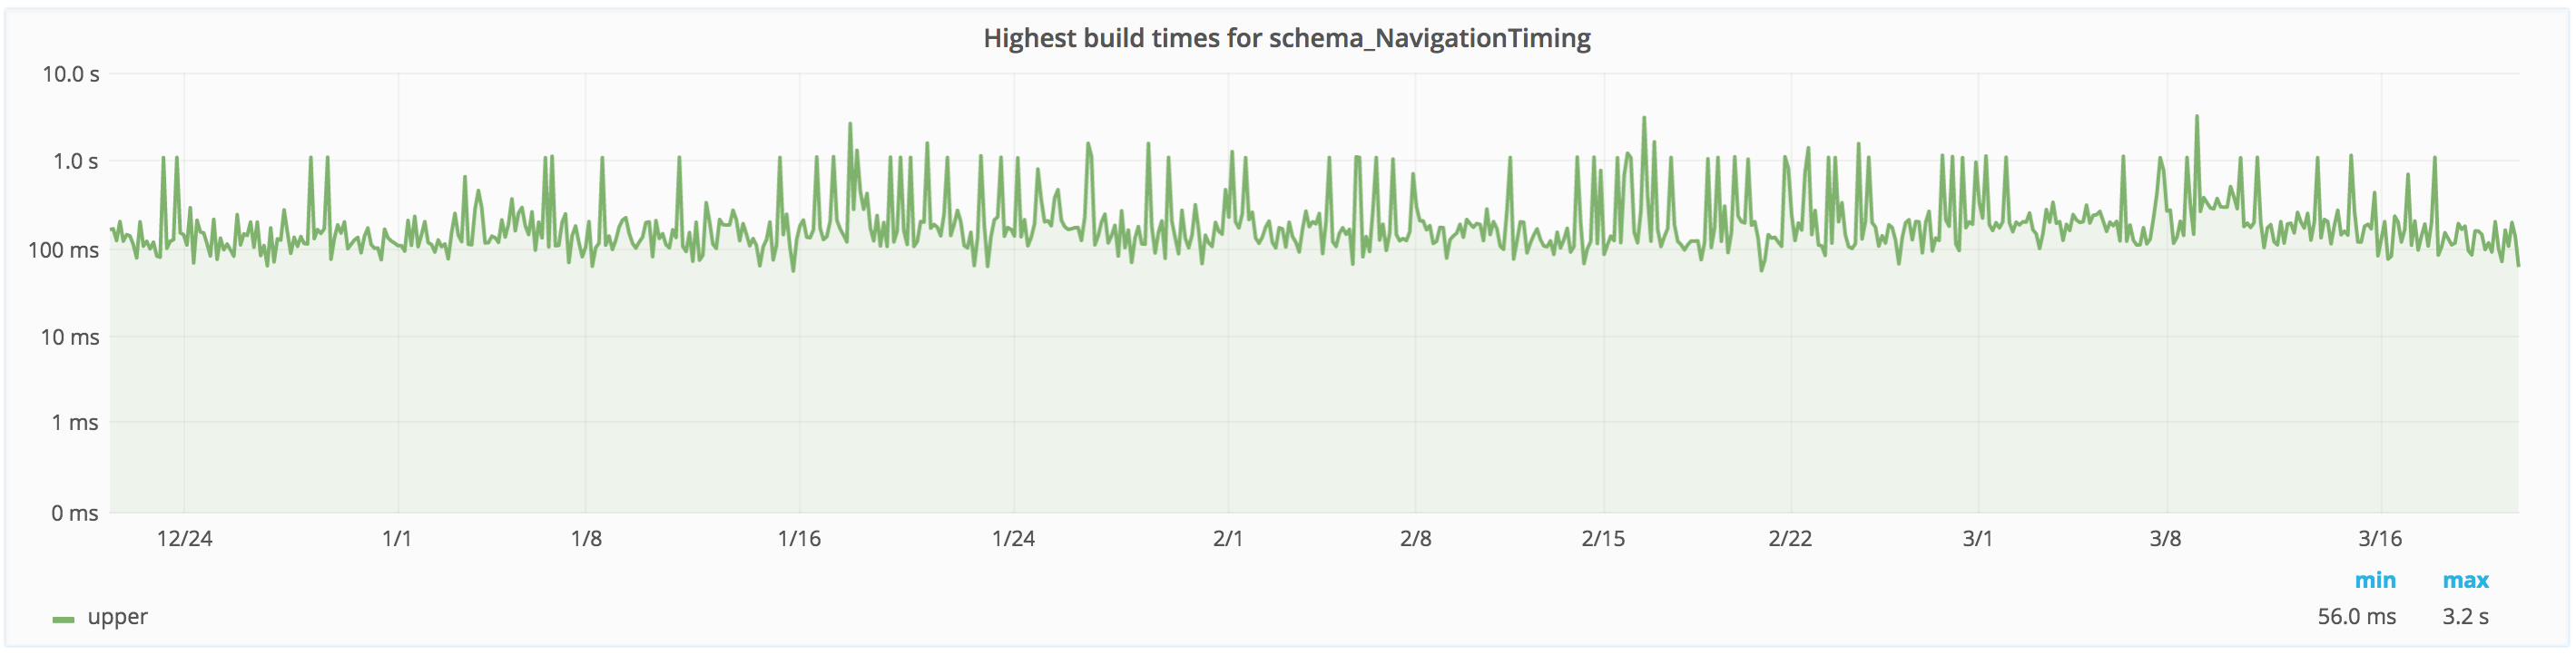
https://grafana.wikimedia.org/dashboard/db/resourceloadermodule?var-module=schema_NavigationTiming