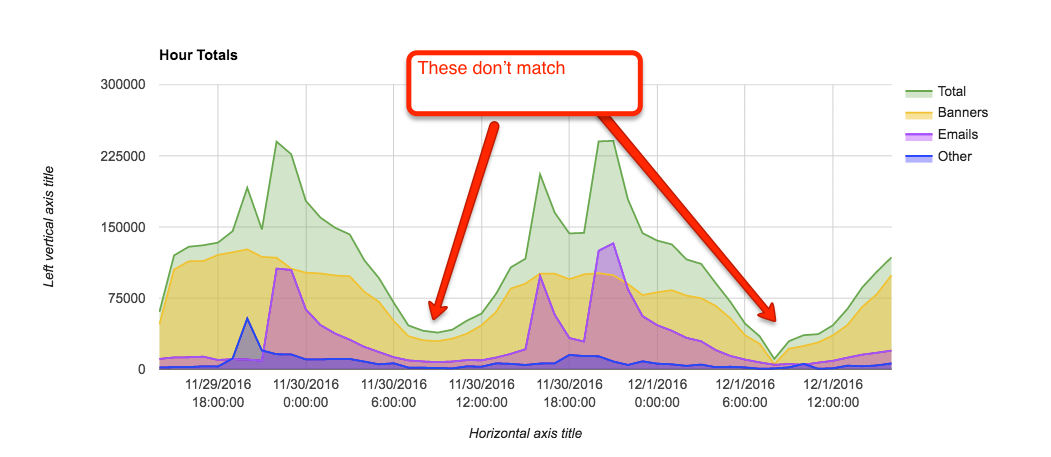
Banner hours totals take a steep dive on december 1st after 6am. fr-online said they didn't do anything around this time.
| • DStrine | |
| Dec 1 2016, 6:51 PM |
| F4941895: pasted_file | |
| Dec 2 2016, 5:12 PM |
| F4932163: banner issues graph.png | |
| Dec 1 2016, 6:51 PM |
Banner hours totals take a steep dive on december 1st after 6am. fr-online said they didn't do anything around this time.
select sum(count) as impressions, hour(timestamp) as hour from bannerimpressions where timestamp between '20161201000000' and '20161201235959' group by hour(timestamp);
+-------------+------+
| impressions | hour |
+-------------+------+
|     2546560 |    0 |
|     2517810 |    1 |
|     2479290 |    2 |
|     2382240 |    3 |
|     2115490 |    4 |
|     1804680 |    5 |
|     1535710 |    6 |
|     1420290 |    7 |
|      273530 |    8 |
|     1508940 |    9 |
|     1618530 |   10 |
|     1686280 |   11 |
|     1829700 |   12 |
|     2328590 |   13 |
|     2649190 |   14 |
|     2518080 |   15 |
|     2588770 |   16 |
|     2613630 |   17 |
|     1313720 |   18 |
+-------------+------+
The same query for Nov 30 shows that impressions were almost perfectly flat during that hour.
Higher resolution on the drop:
select sum(count) as impressions, hour(timestamp) as hour, minute(timestamp) as minute from bannerimpressions where times
tamp between '20161201080000' and '20161201095959' group by hour(timestamp), minute(timestamp);

+-------------+------+--------+
| impressions | hour | minute |
+-------------+------+--------+
|       23120 |    8 |      0 |
|       22240 |    8 |      1 |
|       22430 |    8 |      2 |
|       23060 |    8 |      3 |
|       22040 |    8 |      4 |
|       23270 |    8 |      5 |
|       21680 |    8 |      6 |
|       20180 |    8 |      7 |
|       18490 |    8 |      8 |
|       15230 |    8 |      9 |
|        2200 |    8 |     10 |
|        1630 |    8 |     11 |
|        1400 |    8 |     12 |
|        1200 |    8 |     13 |
|        1370 |    8 |     14 |
|        1160 |    8 |     15 |
|        1110 |    8 |     16 |
|        1200 |    8 |     17 |
|        1170 |    8 |     18 |
|        1190 |    8 |     19 |
|        1100 |    8 |     20 |
|        1260 |    8 |     21 |
|         930 |    8 |     22 |
|        1210 |    8 |     23 |
|        1230 |    8 |     24 |
|        1190 |    8 |     25 |
|        1340 |    8 |     26 |
|        1090 |    8 |     27 |
|        1200 |    8 |     28 |
|         990 |    8 |     29 |
|        1090 |    8 |     30 |
|        1030 |    8 |     31 |
|        1260 |    8 |     32 |
|        1320 |    8 |     33 |
|        1460 |    8 |     34 |
|        1180 |    8 |     35 |
|        1040 |    8 |     36 |
|        1060 |    8 |     37 |
|        1120 |    8 |     38 |
|        1150 |    8 |     39 |
|        1110 |    8 |     40 |
|        1390 |    8 |     41 |
|        1220 |    8 |     42 |
|        1290 |    8 |     43 |
|        1250 |    8 |     44 |
|        1330 |    8 |     45 |
|        1360 |    8 |     46 |
|        1160 |    8 |     47 |
|        1260 |    8 |     48 |
|        1250 |    8 |     49 |
|        1210 |    8 |     50 |
|        1140 |    8 |     51 |
|        1440 |    8 |     52 |
|        1280 |    8 |     53 |
|        1230 |    8 |     54 |
|        1320 |    8 |     55 |
|        1100 |    8 |     56 |
|        1080 |    8 |     57 |
|        1310 |    8 |     58 |
|        1180 |    8 |     59 |
|        1400 |    9 |      0 |
|        1600 |    9 |      1 |
|        5380 |    9 |      2 |
|        6750 |    9 |      3 |
|       11370 |    9 |      4 |
|       25610 |    9 |      5 |
|       25600 |    9 |      6 |
|       25220 |    9 |      7 |
|       26080 |    9 |      8 |
|       26020 |    9 |      9 |
|       26910 |    9 |     10 |
|       26480 |    9 |     11 |
|       26670 |    9 |     12 |
|       26750 |    9 |     13 |
|       26340 |    9 |     14 |
|       26420 |    9 |     15 |
|       26720 |    9 |     16 |
|       27480 |    9 |     17 |
|       26490 |    9 |     18 |
|       26660 |    9 |     19 |
|       27160 |    9 |     20 |
|       26910 |    9 |     21 |
|       26960 |    9 |     22 |
|       27200 |    9 |     23 |
|       27010 |    9 |     24 |
|       27070 |    9 |     25 |
|       25610 |    9 |     26 |
|       27010 |    9 |     27 |
|       28170 |    9 |     28 |
|       27650 |    9 |     29 |
|       26550 |    9 |     30 |
|       26320 |    9 |     31 |
|       27290 |    9 |     32 |
|       27510 |    9 |     33 |
|       27210 |    9 |     34 |
|       26740 |    9 |     35 |
|       26760 |    9 |     36 |
|       27470 |    9 |     37 |
|       27730 |    9 |     38 |
|       28270 |    9 |     39 |
|       27920 |    9 |     40 |
|       27770 |    9 |     41 |
|       27710 |    9 |     42 |
|       28270 |    9 |     43 |
|       27800 |    9 |     44 |
|       27070 |    9 |     45 |
|       27660 |    9 |     46 |
|       27490 |    9 |     47 |
|       26930 |    9 |     48 |
|       26200 |    9 |     49 |
|       26760 |    9 |     50 |
|       26630 |    9 |     51 |
|       27110 |    9 |     52 |
|       26940 |    9 |     53 |
|       26320 |    9 |     54 |
|       27810 |    9 |     55 |
|       27660 |    9 |     56 |
|       27200 |    9 |     57 |
|       26870 |    9 |     58 |
|       26270 |    9 |     59 |
+-------------+------+--------+
line counts from beaconImpressions logs in the banner impression pipeline:
2016-12-01T08:00 5494
2016-12-01T08:01 5296
2016-12-01T08:02 5330
2016-12-01T08:03 5365
2016-12-01T08:04 5235
2016-12-01T08:05 5342
2016-12-01T08:06 5184
2016-12-01T08:07 4874
2016-12-01T08:08 4107
2016-12-01T08:09 3391
2016-12-01T08:10 1202
2016-12-01T08:11 1047
2016-12-01T08:12 1051
2016-12-01T08:13 968
2016-12-01T08:14 1040
2016-12-01T08:15 945
2016-12-01T08:16 940
2016-12-01T08:17 988
2016-12-01T08:18 941
2016-12-01T08:19 988
2016-12-01T08:20 954
2016-12-01T08:21 944
2016-12-01T08:22 922
2016-12-01T08:23 967
2016-12-01T08:24 952
2016-12-01T08:25 994
2016-12-01T08:26 967
2016-12-01T08:27 940
2016-12-01T08:28 1000
2016-12-01T08:29 977
2016-12-01T08:30 937
2016-12-01T08:31 919
2016-12-01T08:32 969
2016-12-01T08:33 973
2016-12-01T08:34 945
2016-12-01T08:35 927
2016-12-01T08:36 936
2016-12-01T08:37 892
2016-12-01T08:38 945
2016-12-01T08:39 950
2016-12-01T08:40 919
2016-12-01T08:41 974
2016-12-01T08:42 966
2016-12-01T08:43 993
2016-12-01T08:44 1017
2016-12-01T08:45 975
2016-12-01T08:46 969
2016-12-01T08:47 931
2016-12-01T08:48 971
2016-12-01T08:49 980
2016-12-01T08:50 930
2016-12-01T08:51 897
2016-12-01T08:52 951
2016-12-01T08:53 939
2016-12-01T08:54 923
2016-12-01T08:55 929
2016-12-01T08:56 959
2016-12-01T08:57 963
2016-12-01T08:58 952
2016-12-01T08:59 936
2016-12-01T09:00 977
2016-12-01T09:01 1046
2016-12-01T09:02 1477
2016-12-01T09:03 2010
2016-12-01T09:04 2943
2016-12-01T09:05 5361
2016-12-01T09:06 5534
2016-12-01T09:07 5513
2016-12-01T09:08 5710
Just to note:
09:14 jynus: mysql restart and upgrade for es1018 T151995
09:06 jynus@tin: Synchronized wmf-config/db-eqiad.php: Depool es1018 (duration: 00m 48s)
08:57 jynus@tin: Synchronized wmf-config/db-eqiad.php: Repool es1014 (duration: 00m 45s)
08:51 ariel@tin: Finished deploy [dumps/dumps@2b35e77]: less logging, fix regression for db_user/password retrieval (duration: 00m 03s)
08:50 ariel@tin: Starting deploy [dumps/dumps@2b35e77]: less logging, fix regression for db_user/password retrieval
08:41 jynus@tin: Synchronized wmf-config/db-eqiad.php: Repool es1011 (duration: 00m 48s)
08:10 jynus@tin: Synchronized wmf-config/db-eqiad.php: Repool es1016 (duration: 00m 45s)
07:57 elukey@tin: Finished deploy [analytics/pivot/deploy@0513a6e]: (no message) (duration: 00m 02s)
Filtering logs of requests to Special:BannerLoader show a notorious drop-off in this window for FR-targeted countries. This means that browsers in these countries practically stopped requesting banners during this window.
This eliminates the possibility that a change in banner content caused this. However, it could still be an issue with ResourceLoader or GeoIP.
From Hive:
SELECT
  count(*), SUBSTR(ts,1,16) as time
FROM
  wmf.webrequest
WHERE
  year=2016
  AND month=12
  AND day=1
  AND hour= 8
  AND geocoded_data['country_code'] in ('AU', 'CA', 'IE', 'NZ', 'US', 'GB')
  AND uri_query LIKE "%BannerLoader%"
  AND agent_type = 'user'
GROUP BY
  SUBSTR(ts,1,16);

_c0	time
15737	2016-12-01 08:00
15882	2016-12-01 08:01
15865	2016-12-01 08:02
15870	2016-12-01 08:03
15577	2016-12-01 08:04
15615	2016-12-01 08:05
15399	2016-12-01 08:06
15116	2016-12-01 08:07
14907	2016-12-01 08:08
12946	2016-12-01 08:09
1076	2016-12-01 08:10
610	2016-12-01 08:11
433	2016-12-01 08:12
348	2016-12-01 08:13
332	2016-12-01 08:14
245	2016-12-01 08:15
242	2016-12-01 08:16
218	2016-12-01 08:17
206	2016-12-01 08:18
223	2016-12-01 08:19
178	2016-12-01 08:20
197	2016-12-01 08:21
163	2016-12-01 08:22
160	2016-12-01 08:23
122	2016-12-01 08:24
144	2016-12-01 08:25
156	2016-12-01 08:26
116	2016-12-01 08:27
131	2016-12-01 08:28
127	2016-12-01 08:29
126	2016-12-01 08:30
109	2016-12-01 08:31
134	2016-12-01 08:32
123	2016-12-01 08:33
134	2016-12-01 08:34
123	2016-12-01 08:35
97	2016-12-01 08:36
100	2016-12-01 08:37
104	2016-12-01 08:38
94	2016-12-01 08:39
69	2016-12-01 08:40
98	2016-12-01 08:41
94	2016-12-01 08:42
67	2016-12-01 08:43
89	2016-12-01 08:44
92	2016-12-01 08:45
83	2016-12-01 08:46
69	2016-12-01 08:47
107	2016-12-01 08:48
90	2016-12-01 08:49
83	2016-12-01 08:50
85	2016-12-01 08:51
71	2016-12-01 08:52
80	2016-12-01 08:53
83	2016-12-01 08:54
71	2016-12-01 08:55
59	2016-12-01 08:56
74	2016-12-01 08:57
59	2016-12-01 08:58
67 2016-12-01 08:59What about the non-geotargeted, did they drop off as well? It seems like the dropoff in the country list above is roughly similar to the total dropoff percentage-wise.
Great point, we should check that.
Also (noted by @cwdent on IRC) GeoIP cookies last a year. So if all of a sudden, servers stopped sending cookies, we wouldn't see this dropoff. However, I think we would if all of a sudden they started setting incorrect (say, w/ unknown country) cookies...
There wasn't much non-geotargeted stuff runing - just CzechWikiCon and WikiFranca_contribution_month2016_call. CzechWikiCon seems unaffected, and WikiFranca seems affected (but has really low numbers). However, there IS a geotargeted one on eswiki that doesn't seem affected at all
| Banner | hour | count |
Not geotargeted:
| CzechWikiCon | 7 | 504 |
| CzechWikiCon | 8 | 580 |
| CzechWikiCon | 9 | 701 |
| WikiFranca_contribution_month2016_call | 7 | 36 |
| WikiFranca_contribution_month2016_call | 8 | 19 |
| WikiFranca_contribution_month2016_call | 9 | 70 |
Geotargeted:
| WLAfrica_2016 | 7 | 2344 |
| WLAfrica_2016 | 8 | 1000 |
| WLAfrica_2016 | 9 | 3031 |
| WMES_Wiki_Loves_Folk_2016 | 7 | 20127 |
| WMES_Wiki_Loves_Folk_2016 | 8 | 39854 |
| WMES_Wiki_Loves_Folk_2016 | 9 | 49539 |
All the datacenters show the problem, but to different degrees:
codfw: 92% drop
eqiad: 97% drop
esams: 86% drop
ulsfo: 65% drop
| codfw | 08:05:00 AM | 2253 |
| codfw | 08:06:00 AM | 2177 |
| codfw | 08:07:00 AM | 2208 |
| codfw | 08:08:00 AM | 1827 |
| codfw | 08:09:00 AM | 1582 |
| codfw | 08:10:00 AM | 337 |
| codfw | 08:11:00 AM | 211 |
| codfw | 08:12:00 AM | 215 |
| codfw | 08:13:00 AM | 183 |
| codfw | 08:14:00 AM | 190 |
| eqiad | 08:05:00 AM | 8371 |
| eqiad | 08:06:00 AM | 8250 |
| eqiad | 08:07:00 AM | 8103 |
| eqiad | 08:08:00 AM | 6646 |
| eqiad | 08:09:00 AM | 5662 |
| eqiad | 08:10:00 AM | 743 |
| eqiad | 08:11:00 AM | 435 |
| eqiad | 08:12:00 AM | 339 |
| eqiad | 08:13:00 AM | 251 |
| eqiad | 08:14:00 AM | 295 |
| esams | 08:05:00 AM | 25010 |
| esams | 08:06:00 AM | 24685 |
| esams | 08:07:00 AM | 20347 |
| esams | 08:08:00 AM | 18164 |
| esams | 08:09:00 AM | 12409 |
| esams | 08:10:00 AM | 4080 |
| esams | 08:11:00 AM | 3538 |
| esams | 08:12:00 AM | 3429 |
| esams | 08:13:00 AM | 3303 |
| esams | 08:14:00 AM | 3422 |
| ulsfo | 08:05:00 AM | 16979 |
| ulsfo | 08:06:00 AM | 16802 |
| ulsfo | 08:07:00 AM | 16674 |
| ulsfo | 08:08:00 AM | 14939 |
| ulsfo | 08:09:00 AM | 13576 |
| ulsfo | 08:10:00 AM | 6480 |
| ulsfo | 08:11:00 AM | 6073 |
| ulsfo | 08:12:00 AM | 6083 |
| ulsfo | 08:13:00 AM | 6044 |
| ulsfo | 08:14:00 AM | 5956 |
@Ejegg
Nice discoveries! I don't think WikiFranca_contribution_month2016_call was affected. If you zoom out, the 08:00 numbers fit into the rest of the pattern:
select
    banner,
    sum(count) as impressions,
    day(timestamp),
    hour(timestamp) as hour
from bannerimpressions
where
    timestamp > '20161127000000'
    and banner in ('WikiFranca_contribution_month2016_call')
group by
    banner,
    day(timestamp),
    hour(timestamp);

+----------------------------------------+-------------+----------------+------+
| banner                                 | impressions | day(timestamp) | hour |
+----------------------------------------+-------------+----------------+------+
| WikiFranca_contribution_month2016_call |          10 |              1 |    0 |
| WikiFranca_contribution_month2016_call |          50 |              1 |    3 |
| WikiFranca_contribution_month2016_call |          30 |              1 |    4 |
| WikiFranca_contribution_month2016_call |          40 |              1 |    5 |
| WikiFranca_contribution_month2016_call |          40 |              1 |    6 |
| WikiFranca_contribution_month2016_call |          60 |              1 |    7 |
| WikiFranca_contribution_month2016_call |          30 |              1 |    8 |
| WikiFranca_contribution_month2016_call |          50 |              1 |    9 |
| WikiFranca_contribution_month2016_call |         180 |              1 |   10 |
| WikiFranca_contribution_month2016_call |          90 |              1 |   11 |
| WikiFranca_contribution_month2016_call |          50 |              1 |   12 |
| WikiFranca_contribution_month2016_call |         100 |              1 |   13 |
| WikiFranca_contribution_month2016_call |          20 |              1 |   14 |
| WikiFranca_contribution_month2016_call |          30 |              1 |   15 |
| WikiFranca_contribution_month2016_call |          20 |              1 |   16 |
| WikiFranca_contribution_month2016_call |          10 |              1 |   17 |
| WikiFranca_contribution_month2016_call |          10 |              1 |   18 |
| WikiFranca_contribution_month2016_call |          10 |              1 |   20 |
| WikiFranca_contribution_month2016_call |          10 |              1 |   21 |
| WikiFranca_contribution_month2016_call |          10 |              1 |   22 |
| WikiFranca_contribution_month2016_call |         120 |             30 |   17 |
| WikiFranca_contribution_month2016_call |         100 |             30 |   18 |
| WikiFranca_contribution_month2016_call |          70 |             30 |   19 |
| WikiFranca_contribution_month2016_call |         120 |             30 |   20 |
| WikiFranca_contribution_month2016_call |          50 |             30 |   21 |
| WikiFranca_contribution_month2016_call |          20 |             30 |   22 |
| WikiFranca_contribution_month2016_call |          60 |             30 |   23 |
+----------------------------------------+-------------+----------------+------+Ahh, ok. So my burning question is now "How was the geotargeted WMES_Wiki_Loves_Folk_2016 unaffected?"
Looks like it's language-specific: en, de, fr, it, and simple are affected - none of the others are.
| lang | hour | count |
| ar | 7 | 378 |
| ar | 8 | 438 |
| ar | 9 | 546 |
| ca | 7 | 2554 |
| ca | 8 | 4143 |
| ca | 9 | 4358 |
| cs | 7 | 507 |
| cs | 8 | 586 |
| cs | 9 | 711 |
| da | 7 | 8599 |
| da | 8 | 9836 |
| da | 9 | 11875 |
| de | 7 | 744156 |
| de | 8 | 133495 |
| de | 9 | 1039503 |
| en | 7 | 1940837 |
| en | 8 | 311084 |
| en | 9 | 1724790 |
| es | 7 | 58956 |
| es | 8 | 99938 |
| es | 9 | 120584 |
| fr | 7 | 10833 |
| fr | 8 | 1692 |
| fr | 9 | 15529 |
| he | 7 | 244 |
| he | 8 | 256 |
| he | 9 | 280 |
| hu | 7 | 8079 |
| hu | 8 | 10329 |
| hu | 9 | 11243 |
| it | 7 | 63744 |
| it | 8 | 7884 |
| it | 9 | 107189 |
| ja | 7 | 317844 |
| ja | 8 | 308715 |
| ja | 9 | 292575 |
| lv | 7 | 1262 |
| lv | 8 | 1471 |
| lv | 9 | 1423 |
| nl | 7 | 6500 |
| nl | 8 | 11400 |
| nl | 9 | 11592 |
| no | 7 | 7537 |
| no | 8 | 12408 |
| no | 9 | 12648 |
| pt | 7 | 162 |
| pt | 8 | 147 |
| pt | 9 | 179 |
| ro | 7 | 6122 |
| ro | 8 | 8216 |
| ro | 9 | 9516 |
| simple | 7 | 2009 |
| simple | 8 | 308 |
| simple | 9 | 2621 |
| sk | 7 | 2650 |
| sk | 8 | 2928 |
| sk | 9 | 3385 |
| sv | 7 | 21513 |
| sv | 8 | 30859 |
| sv | 9 | 34423 |
| zh | 7 | 10343 |
| zh | 8 | 9574 |
| zh | 9 | 8765 |
Made two partly-processed tables in Hive to be able to run queries more quickly.
In the andyrussg database: t152122beaconimpression20161201, t152122bannerloader20161201.
Here's what I did to create them:
use andyrussg;

CREATE TABLE
  t152122bannerloader20161201
AS SELECT
  *,
  SUBSTR(ts,1,16) as time,
  parse_url(concat('http://bla.org/woo/', uri_query), 'QUERY', 'campaign')  as campaign,
  parse_url(concat('http://bla.org/woo/', uri_query), 'QUERY', 'banner')  as banner,
  parse_url(concat('http://bla.org/woo/', uri_query), 'QUERY', 'uselang')  as uselang,
  parse_url(concat('http://bla.org/woo/', uri_query), 'QUERY', 'debug')  as debug
FROM
  wmf.webrequest
WHERE
  year=2016
  AND month=12
  AND day=1
  AND agent_type = 'user'
  AND uri_query LIKE "%BannerLoader%";

CREATE TABLE
  t152122beaconimpression20161201
AS SELECT
  *,
  SUBSTR(ts,1,16) as time,
  parse_url(concat('http://bla.org/woo/', uri_query), 'QUERY', 'campaign')  as campaign,
  parse_url(concat('http://bla.org/woo/', uri_query), 'QUERY', 'banner')  as banner,
  parse_url(concat('http://bla.org/woo/', uri_query), 'QUERY', 'uselang')  as uselang,
  parse_url(concat('http://bla.org/woo/', uri_query), 'QUERY', 'debug')  as debug,
  parse_url(concat('http://bla.org/woo/', uri_query), 'QUERY', 'db')  as db,
  parse_url(concat('http://bla.org/woo/', uri_query), 'QUERY', 'device')  as device,
  parse_url(concat('http://bla.org/woo/', uri_query), 'QUERY', 'statusCode')  as statusCode,
  parse_url(concat('http://bla.org/woo/', uri_query), 'QUERY', 'country')  as country,
  parse_url(concat('http://bla.org/woo/', uri_query), 'QUERY', 'anonymous')  as anonymous
FROM
  wmf.webrequest
WHERE
  year=2016
  AND month=12
  AND day=1
  AND agent_type = 'user'
AND uri_path LIKE '%beacon%impression%';I'm seeing signs that this happened again last night at the same hour.
Can someone remind me why we didn't think the activity in the server admin logs was relevant?
I guess we'll find out tomorrow: there probably (hopefully!) won't be anyone messing with DB servers at 9am CET on Saturday morning, or much SAL activity of any kind really. If the dip happens again in the absence of SAL activity, that's a pretty strong indicator that it's probably unrelated.
Dip for 8/2:
| 07:57:00 AM | 21295 |
| 07:58:00 AM | 21267 |
| 07:59:00 AM | 21290 |
| 08:00:00 AM | 21118 |
| 08:01:00 AM | 14335 |
| 08:02:00 AM | 11844 |
| 08:03:00 AM | 11420 |
| 08:04:00 AM | 10994 |
| 08:05:00 AM | 10015 |
| 08:06:00 AM | 7631 |
| 08:07:00 AM | 4729 |
| 08:08:00 AM | 4413 |
| 08:09:00 AM | 3289 |
| 08:10:00 AM | 2972 |
| 08:11:00 AM | 3008 |
| 08:12:00 AM | 2997 |
| 08:13:00 AM | 2885 |
| 08:14:00 AM | 2961 |
| 08:15:00 AM | 3000 |
| 08:16:00 AM | 3010 |
| 08:17:00 AM | 2985 |
| 08:18:00 AM | 2931 |
| 08:19:00 AM | 2861 |
| 08:20:00 AM | 2949 |
| 08:21:00 AM | 2982 |
| 08:22:00 AM | 2988 |
| 08:23:00 AM | 2930 |
| 08:24:00 AM | 3080 |
| 08:25:00 AM | 3027 |
| 08:26:00 AM | 2917 |
| 08:27:00 AM | 3015 |
| 08:28:00 AM | 3001 |
| 08:29:00 AM | 2977 |
| 08:30:00 AM | 2887 |
| 08:31:00 AM | 2977 |
| 08:32:00 AM | 2994 |
| 08:33:00 AM | 2984 |
| 08:34:00 AM | 3025 |
| 08:35:00 AM | 3010 |
| 08:36:00 AM | 2964 |
| 08:37:00 AM | 2930 |
| 08:38:00 AM | 3003 |
| 08:39:00 AM | 2937 |
| 08:40:00 AM | 3038 |
| 08:41:00 AM | 2849 |
| 08:42:00 AM | 2934 |
| 08:43:00 AM | 2879 |
| 08:44:00 AM | 2940 |
| 08:45:00 AM | 2879 |
| 08:46:00 AM | 2993 |
| 08:47:00 AM | 2920 |
| 08:48:00 AM | 3034 |
| 08:49:00 AM | 3047 |
| 08:50:00 AM | 3133 |
| 08:51:00 AM | 3052 |
| 08:52:00 AM | 3100 |
| 08:53:00 AM | 3069 |
| 08:54:00 AM | 2978 |
| 08:55:00 AM | 3117 |
| 08:56:00 AM | 3024 |
| 08:57:00 AM | 3041 |
| 08:58:00 AM | 3061 |
| 08:59:00 AM | 3086 |
| 09:00:00 AM | 3269 |
| 09:01:00 AM | 14981 |
| 09:02:00 AM | 23320 |
| 09:03:00 AM | 23255 |
| 09:04:00 AM | 25204 |
| 09:05:00 AM | 26367 |
Current theory:
Next steps to diagnose:
I had a script (still running it actually) that captures the contents of the choiceData module every 5 mins. I extracted the version hashes, and they're all the same. So there were no choiceData changes at all in the last 24h or so.
It seems pretty unlikely the SAL activity (DB pools/depools) is related indeed.
Unfortunately traffic patterns on Saturday are pretty different from workdays for all kinds of reasons, and may not tell us much either.
@AndyRussG here's the bash script I use to run the phantomjs as well as figuring out all the RL module versions and the raw choiceData: P4569
It parses out the module versions with this: https://packages.debian.org/search?keywords=jq
@jcrespo It's more than just an EventLogging issue - we're not seeing requests for the banners in the webrequest table, and we're seeing a corresponding drop in donations, so it's pretty clear people are not seeing the banners.
Update: We've run a bunch more queries and talked this over on IRC a lot.
tl;dr: This is a server-side issue with ChoiceData, the info about possible campaigns that we send to browsers. I think it may well an edge-case bug in CentralNotice rather than an infrastructure outage or random data corruption.
Queries:
Mega-query for grouping on several factors: P4583 by @Ejegg
Main conclusion: The issue didn't affect any browser or OS disproportionately, except for a specific mobile Chrome version that may have caching issues, or may have odd proxied caching by a large mobile provider. Also, not related to geolocation. This fits with the theory of a server-side issue with ChoiceData.
Extraction of impression data for outages: P4584
First outage by language and datacenter: P4585
Conclusion: Apparently no significant relationship between outage and datacenter.
Both outages by languages and database name (wgDBname, a proxy for project): P4586
Conclusions:
Discussion:
Thanks so much, everyone, for helping out and chiming in!!!! :D
P.S. Pls add/correct me if I've missed any important points we discussed elsewhere, or if I've gotten stuff wrong (likely)... thx!!!
WAM 2016_en targeted simple English and other languages and projects with outages, but not high-traffic languages for which we've seen no outages. It ended 8 hrs before the first outage. What about some timezone misconfiguration somewhere, or a bug in how we're querying campaign start/end times, some corruption in the db for just this campaign, some other bug in the ChoiceData provider, or a combination of the above? Also, the campaign has an attention-getting space in its name...
Just to note, the above query (P4586) and conclusions are a little bit wrong, because db (enwiki, frwiki, etc.) doesn't really map to project in CN terms. I think the conclusions are still basically correct. I'll fix and re-run the query...
"Unbreak now" priority for more than a month (since T152122#2839731); no updates in this task since Dec 08.
@AndyRussG: Any updates to share? Is "Unbreak now" still a realistic priority? Please reset/adjust if not.