Page MenuHomePhabricator

Investigate increase in SpeedIndex/startRender for Chrome 3/2
Closed, DeclinedPublic

Description

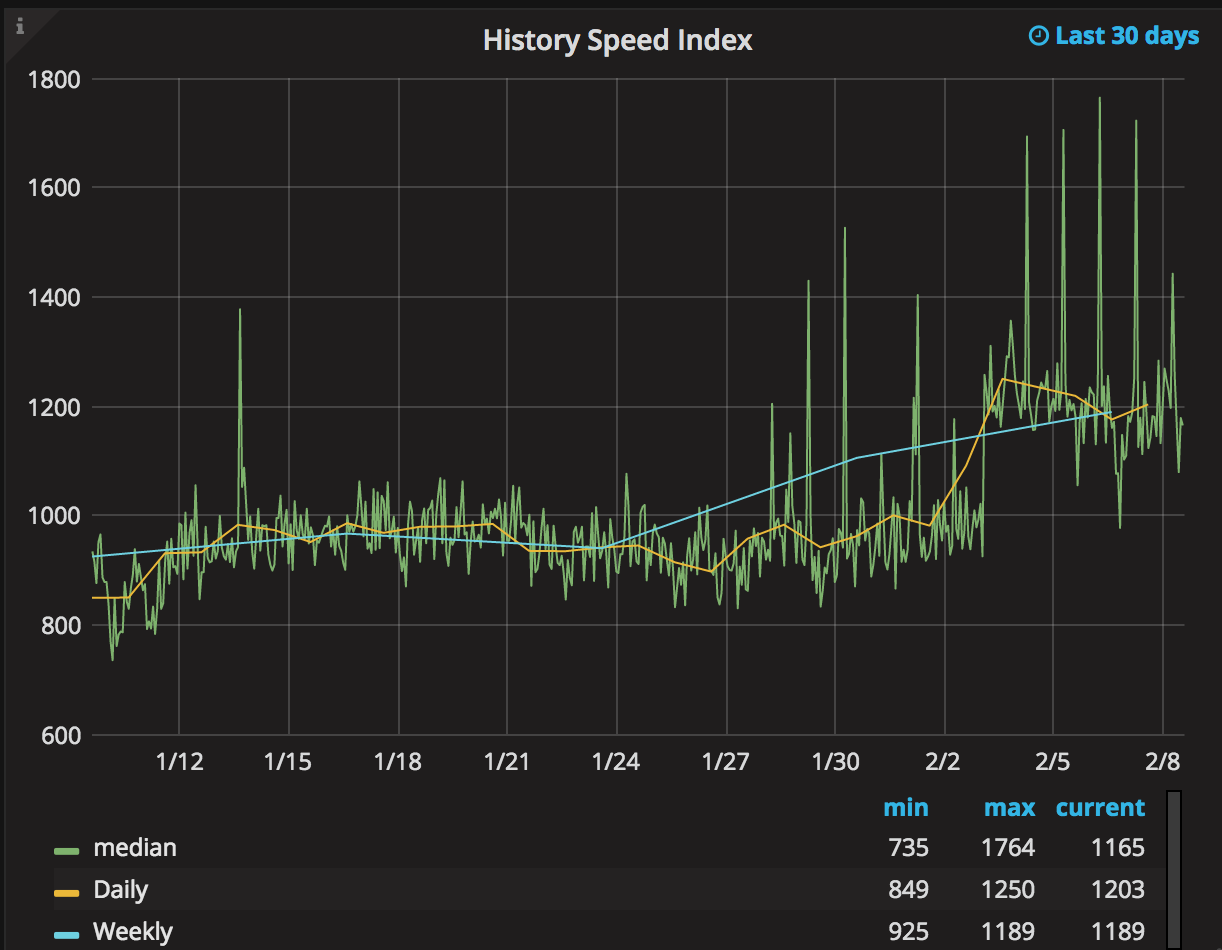
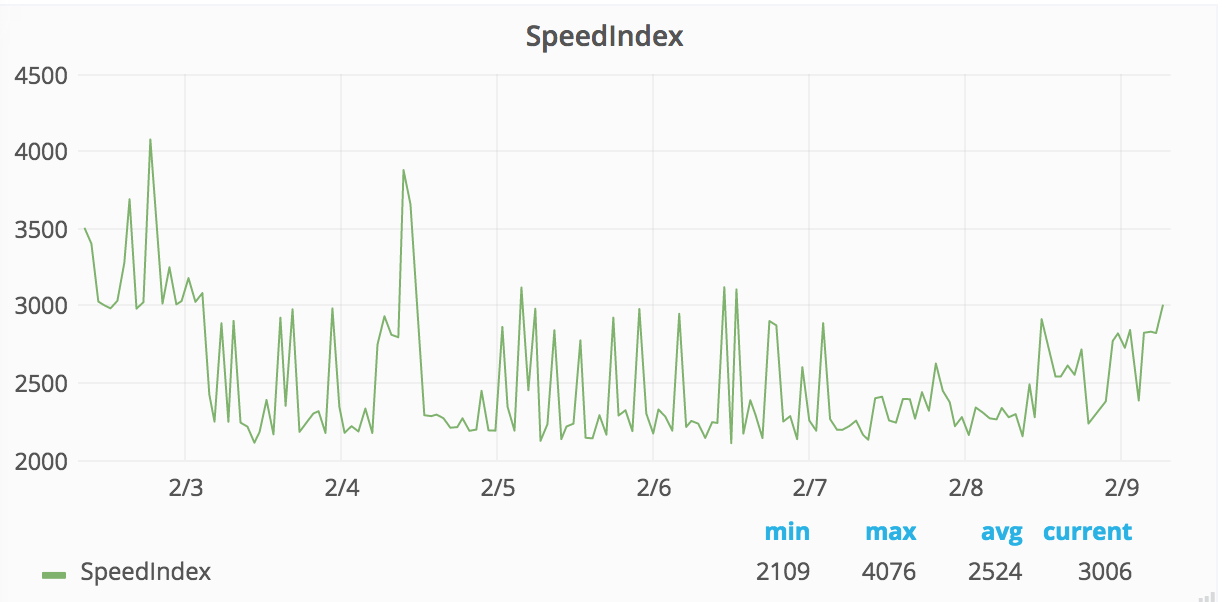
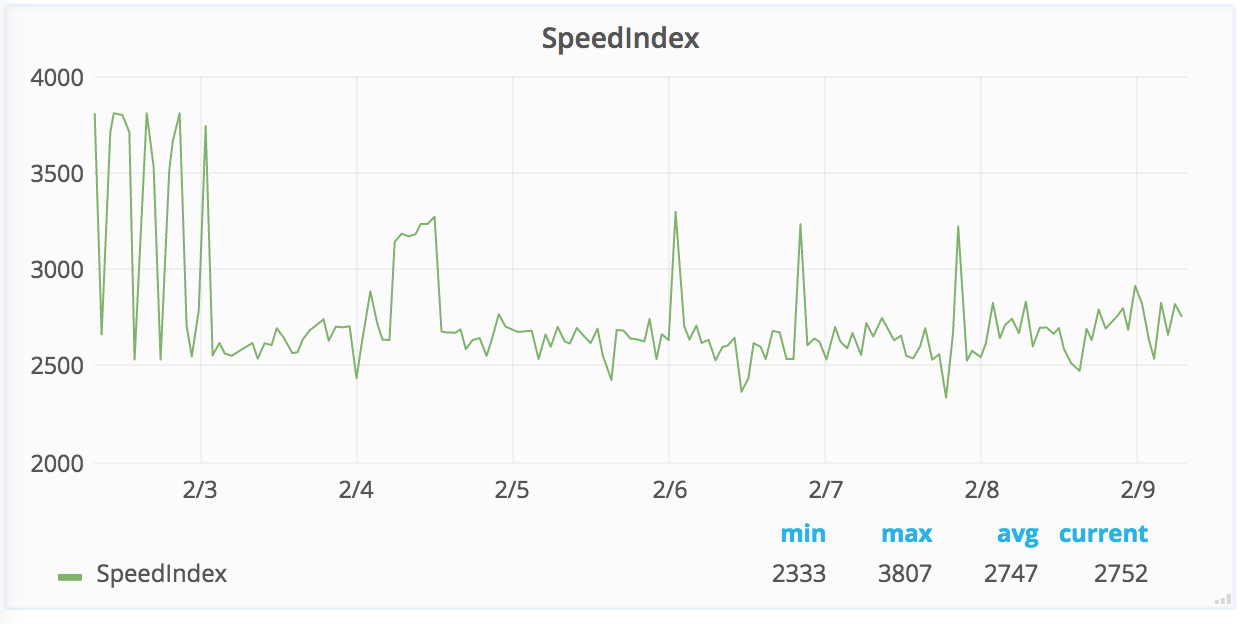
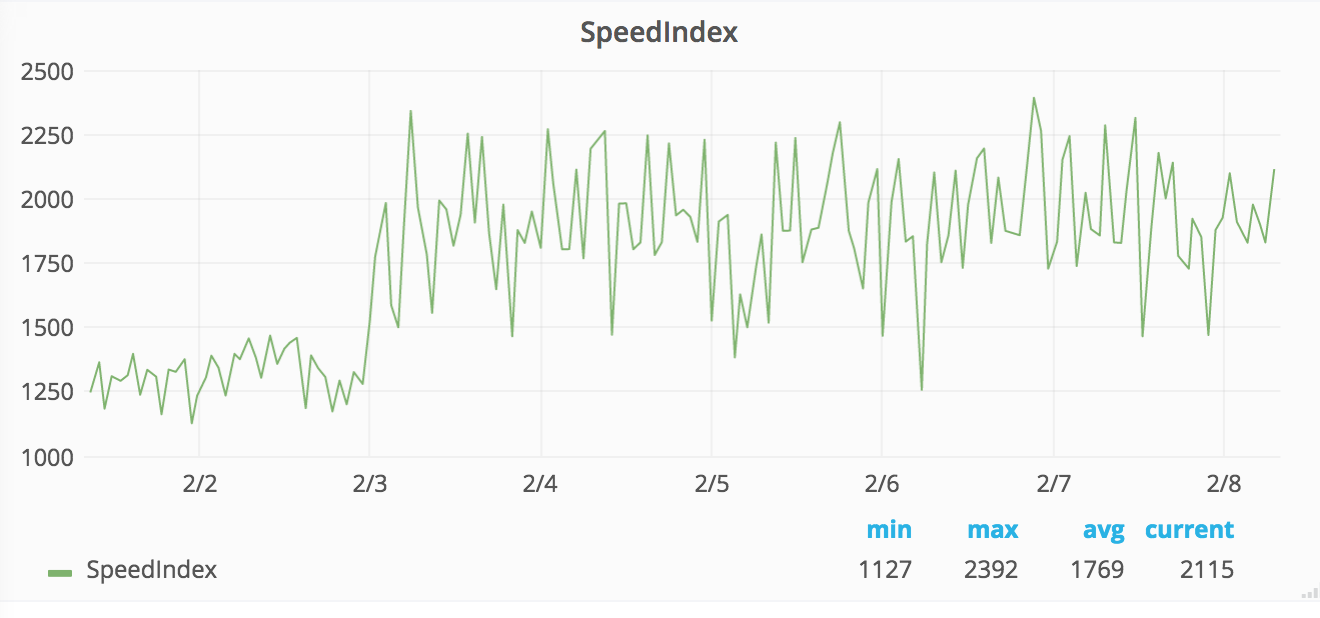
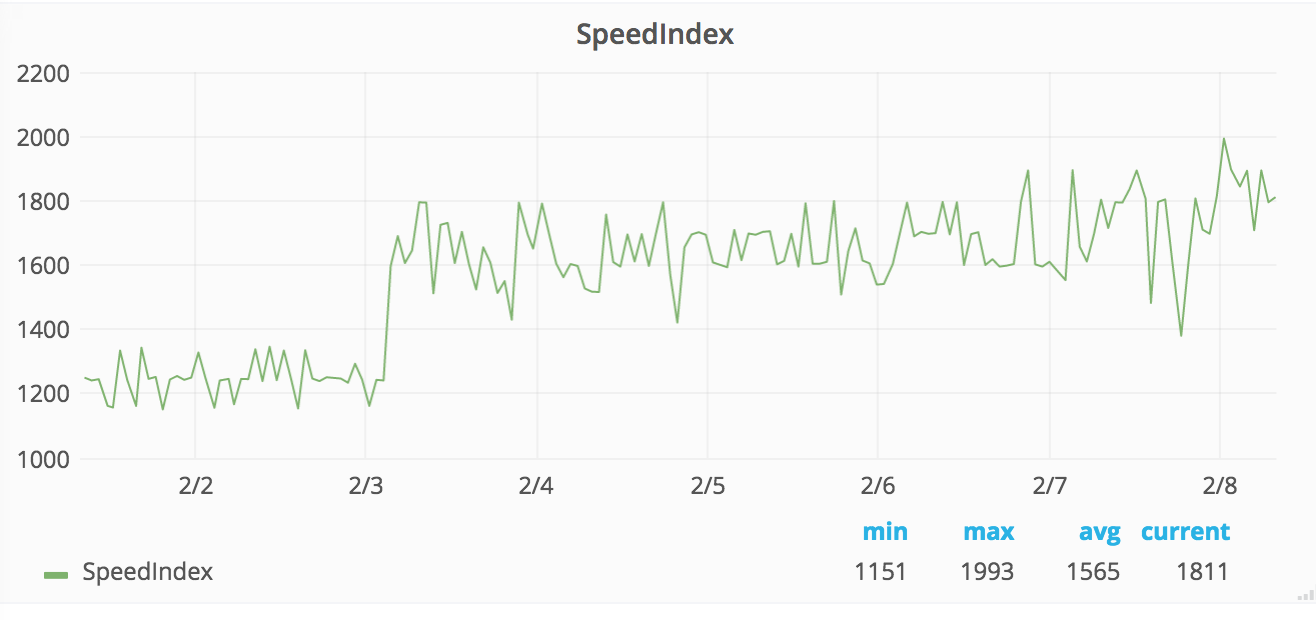
There's been an increase in SpeedIndex for Chrome for both Facebook and Trump page. It happens also on second view:

Trump:

Screen Shot 2017-02-08 at 8.52.04 AM.png (618×1 px, 152 KB)

Facebook

Screen Shot 2017-02-08 at 8.52.16 AM.png (604×1 px, 112 KB)

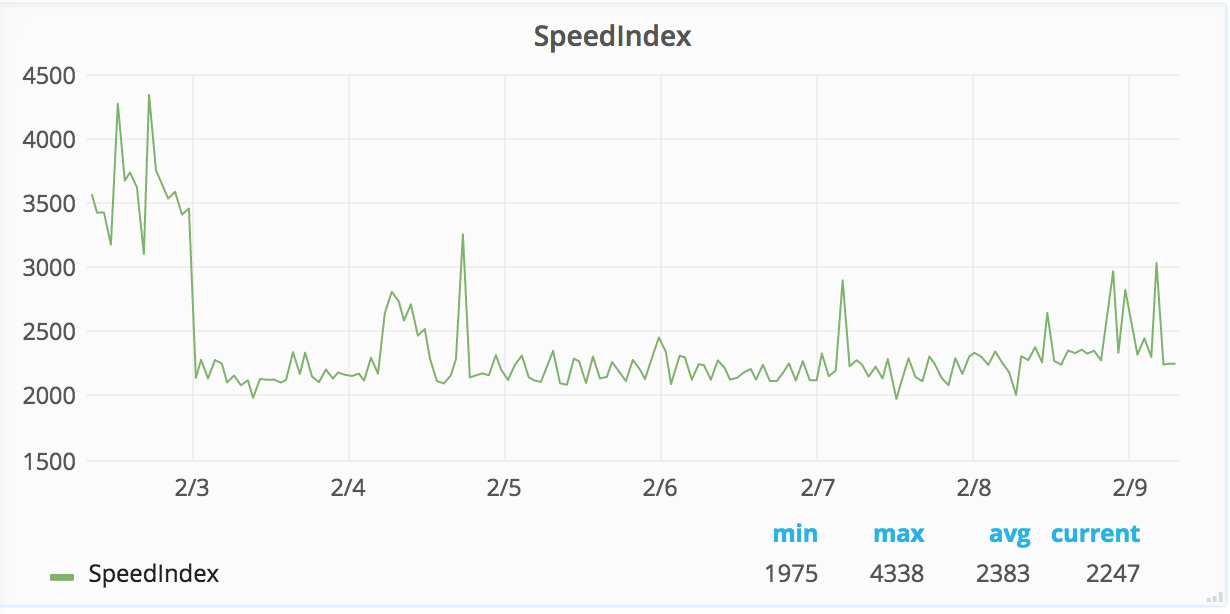
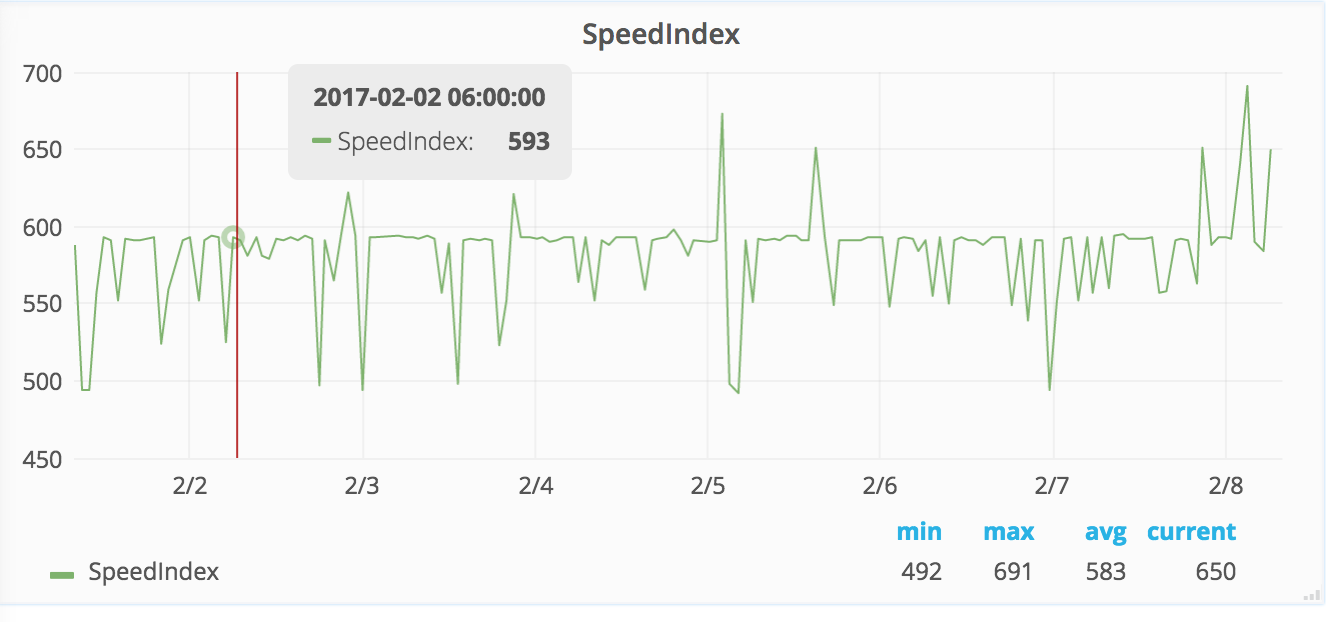
Facebook second view:

Screen Shot 2017-02-08 at 8.52.28 AM.png (620×1 px, 125 KB)

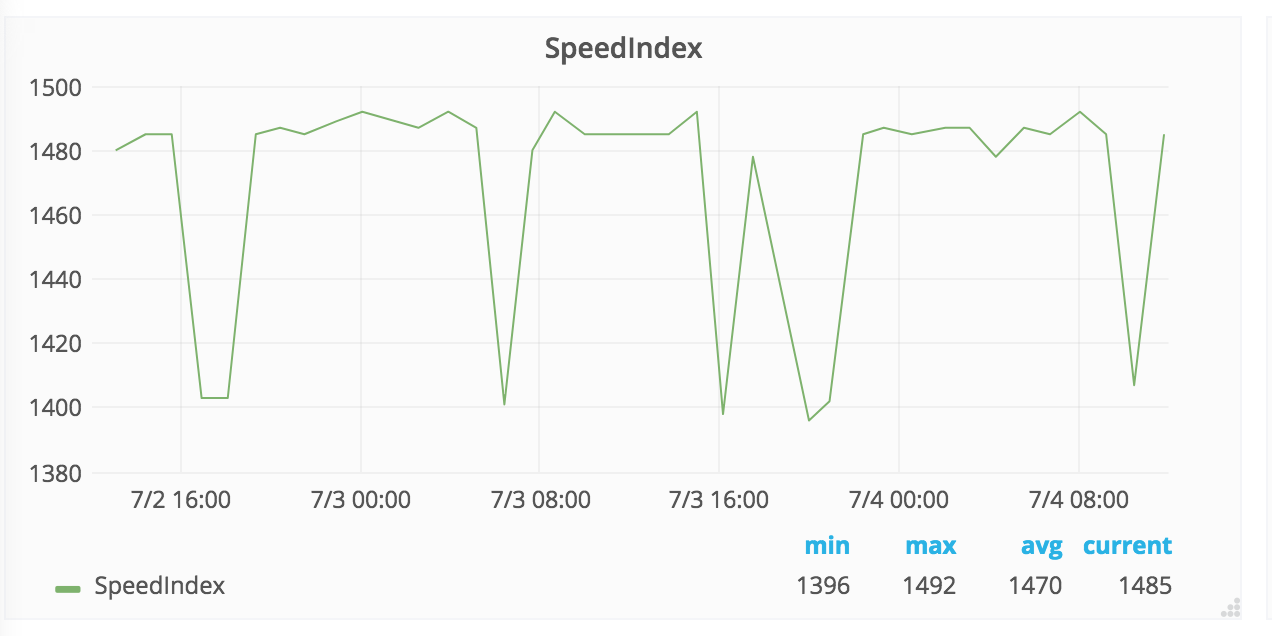
Ingrid Vang Nyman (small stub article)

Screen Shot 2017-02-08 at 8.52.41 AM.png (622×1 px, 131 KB)

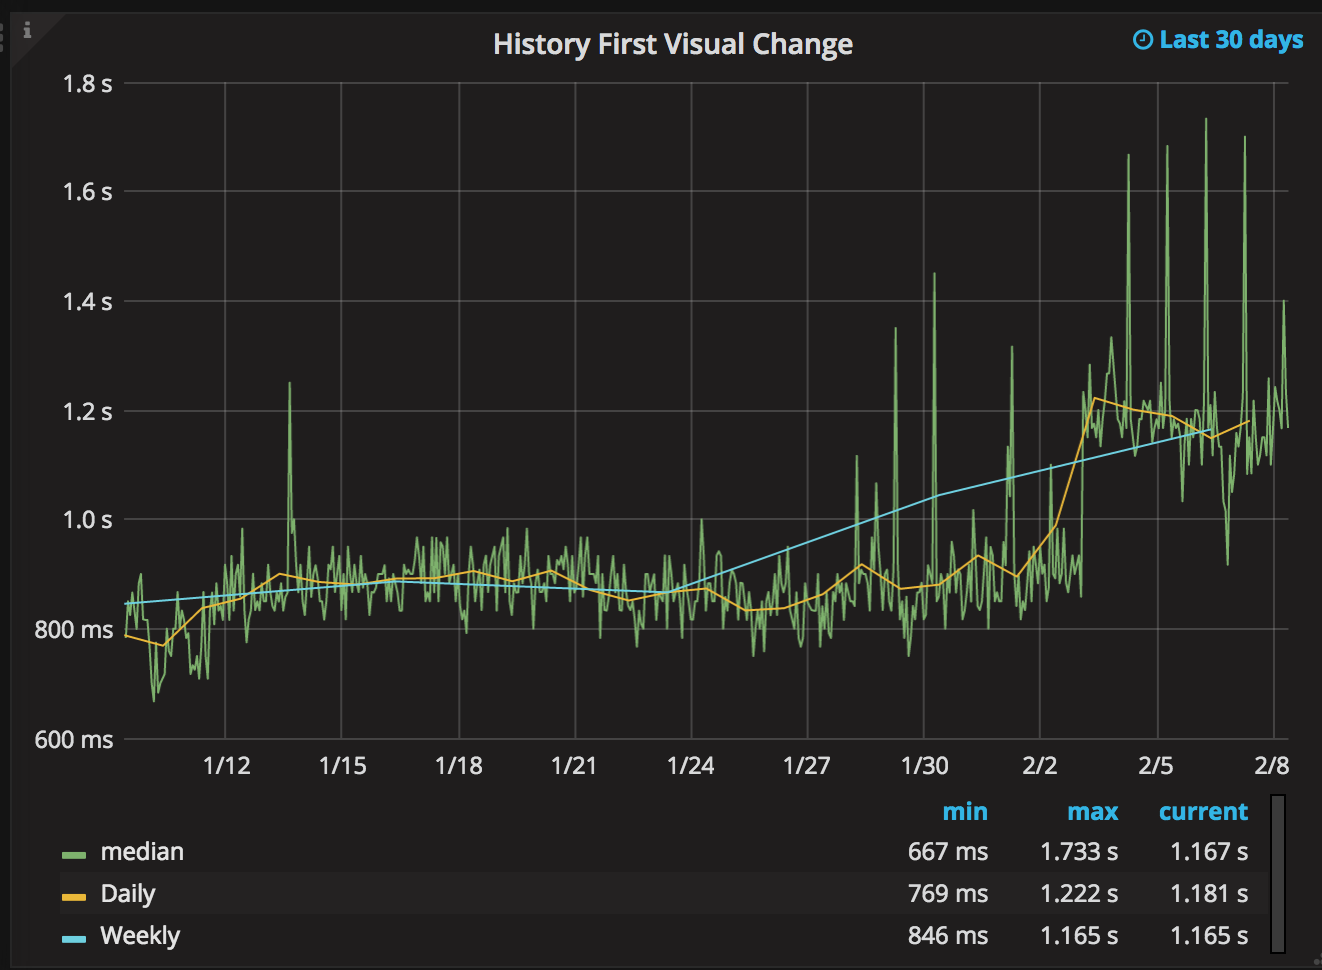
It's the same pattern on start render. TTFB is stable.

I think I see the same for first paint too, it's a little bit harder to see:

Screen Shot 2017-02-08 at 8.59.21 AM.png (1×2 px, 494 KB)

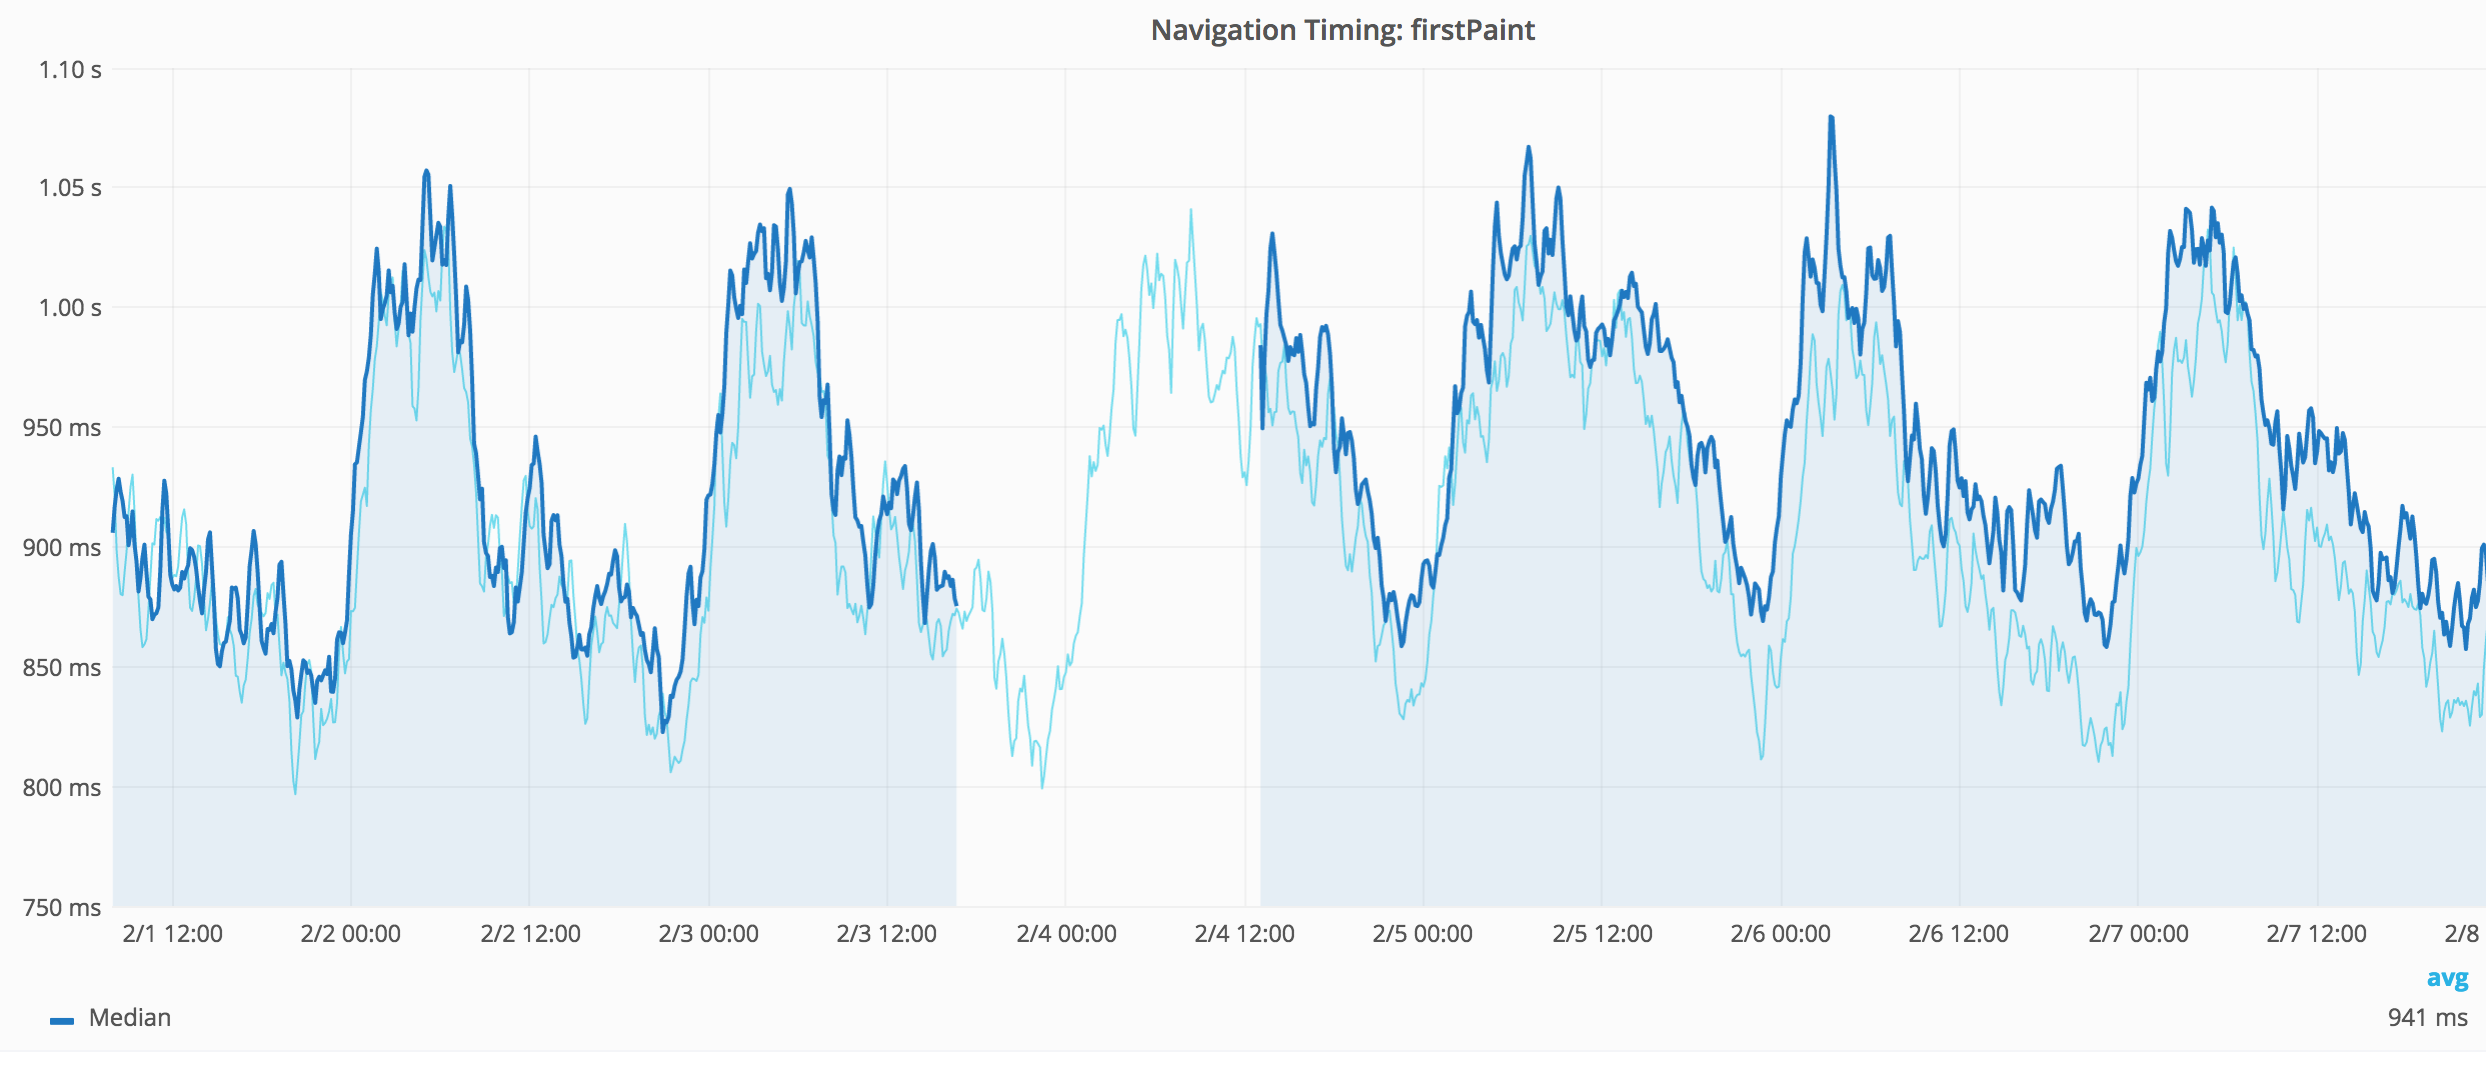
https://grafana.wikimedia.org/dashboard/db/navigation-timing?panelId=5&fullscreen&var-metric=firstPaint

Event Timeline

We can rule out WebPageTest changes and Chrome changes because we get the exact same behavior on my test instance for all article pages that aren't a stub (where we use the same Chrome version and no WPT):

Screen Shot 2017-02-08 at 2.05.48 PM.png (950×1 px, 175 KB)

Screen Shot 2017-02-08 at 9.12.57 AM.png (970×1 px, 218 KB)

The change is pretty remarkable in domInteractive, we can see that in the Navigation Timing data, we got an improvement there:

Screen Shot 2017-02-08 at 12.33.53 PM.png (1×2 px, 477 KB)

And before and after for WebPageTest the domInteractive has gone from 1.68s to 0.54s and the compare between runs but that also generated the regression in SpeedIndex and startRender. Ping @Krinkle please have a look when you have time.

That incredible jump in domInteractive for WebPageTes could be comparing one high with one low. Looking at it over time, it shows decreased values since Feb 3:

Screen Shot 2017-02-08 at 4.16.37 PM.png (778×2 px, 284 KB)

One thing that I missed is that things looks better for Firefox after the change, at least it visible for all tests we do for the Facebook page:

SpeedIndex Second view

Screen Shot 2017-02-09 at 8.37.28 AM.png (602×1 px, 95 KB)

SpeedIndex first view

Screen Shot 2017-02-09 at 8.37.40 AM.png (624×1 px, 91 KB)

SpeedIndex authenticated

Screen Shot 2017-02-09 at 8.38.19 AM.png (614×1 px, 88 KB)

I've been comparing the HTML inside of head to see if there's some difference before and after, and there's one for both Facebook and Chrome the og:image property was added in the latest release:

<meta property="og:image" content="https://upload.wikimedia.org/wikipedia/en/b/bf/Facebook_user_page_%282014%29.jpg" />

and

<meta property="og:image" content="https://upload.wikimedia.org/wikipedia/commons/thumb/5/56/Donald_Trump_official_portrait.jpg/1920px-Donald_Trump_official_portrait.jpg"/>

but shouldn't do anything with the performance or ...?

This is more interesting, we used to have an inline script at the beginning of the first content that was removed in the latest release:

<h1 id="firstHeading" class="firstHeading" lang="en">Facebook</h1>
<div id="bodyContent" class="mw-body-content">
            <div id="siteSub">From Wikipedia, the free encyclopedia</div>
            <div id="contentSub"></div>
            <div id="jump-to-nav" class="mw-jump"> Jump to: <a href="#mw-head">navigation</a>, <a href="#p-search">search</a> </div>
            <div id="mw-content-text" lang="en" dir="ltr" class="mw-content-ltr">
                <script>
                    function mfTempOpenSection(id) {
                        var block = document.getElementById("mf-section-" + id);
                        block.className += " open-block";
                        block.previousSibling.className += " open-block";
                    }
                </script>
Peter triaged this task as Medium priority.May 30 2017, 9:41 AM

The metrics has now gone back to almost the same level for the Facebook page:

Screen Shot 2017-07-04 at 2.02.00 PM.png (636×1 px, 107 KB)

The learning is that the next time this happens we need to act on it ASAP so it's easier to know what caused it (and with the alerts that is easier).