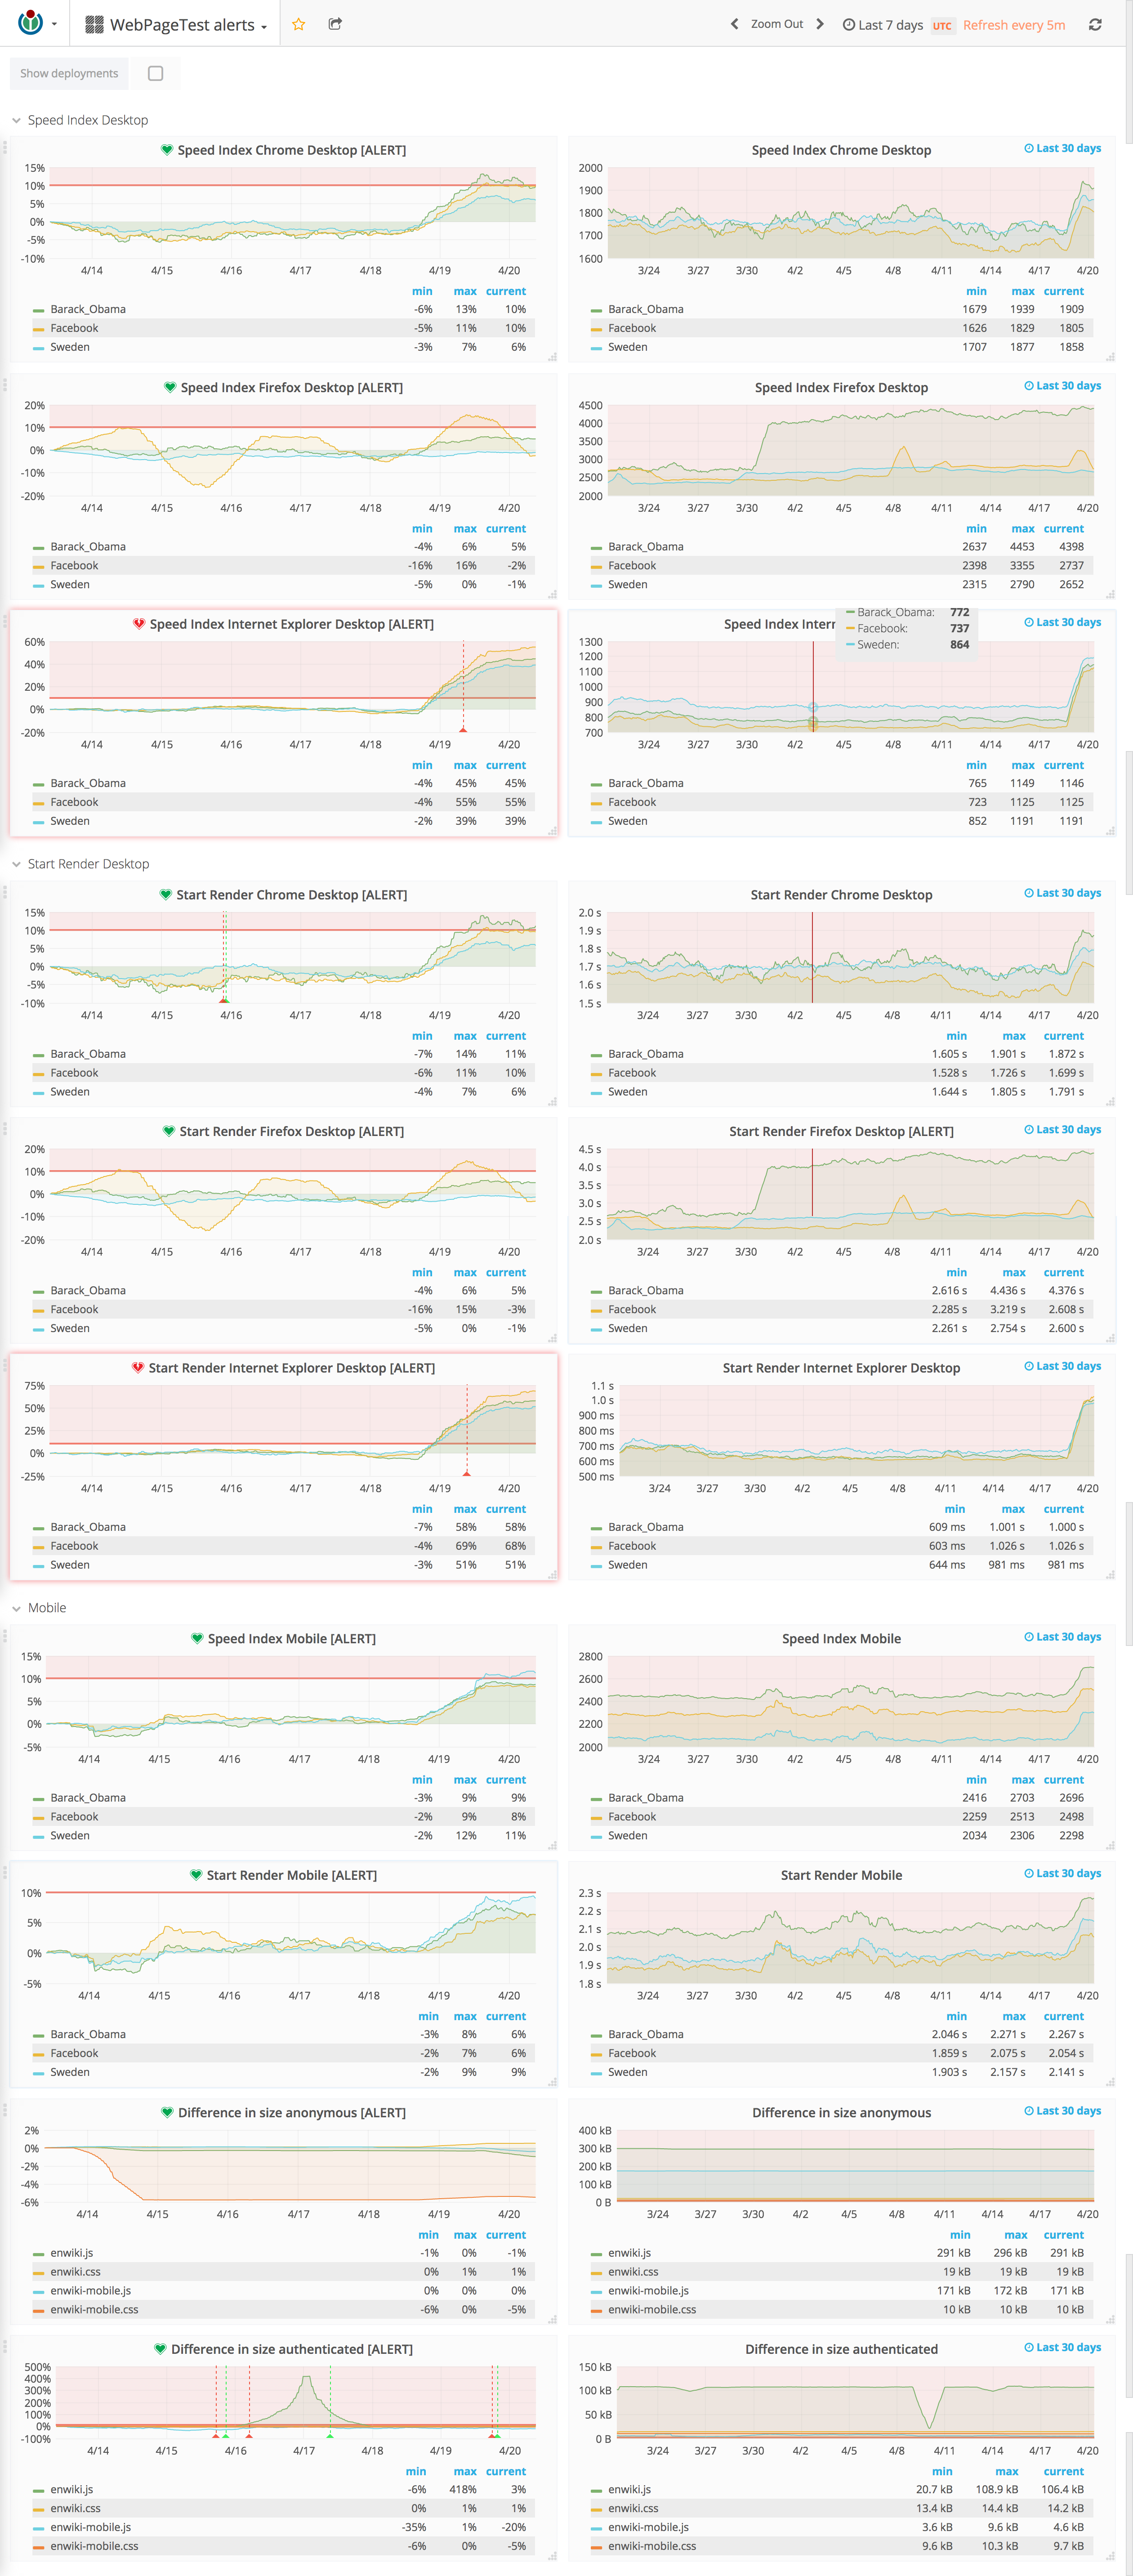
To make it easier to see real metrics, create a new structure:
Two dashboards on each row. To the left the alert and to the right the metrics going back 30d.
| Peter | |
| Apr 20 2017, 8:45 AM |
| F7662041: history.png | |
| Apr 20 2017, 9:21 AM |
| F7661530: Screen Shot 2017-04-20 at 10.48.27 AM.png | |
| Apr 20 2017, 8:49 AM |
To make it easier to see real metrics, create a new structure:
Two dashboards on each row. To the left the alert and to the right the metrics going back 30d.
| Status | Subtype | Assigned | Task | ||
|---|---|---|---|---|---|
| Resolved | akosiaris | T140942 Tracking: Monitoring and alerts for "business" metrics | |||
| Resolved | • Gilles | T153166 Set up Grafana alerts for Web Performance metrics | |||
| Resolved | • Gilles | T153041 Alerts using WebPageTest | |||
| Resolved | Peter | T163420 Restructure WebPageTest Grafana alerts |
Updated: https://grafana.wikimedia.org/dashboard/db/webpagetest-alerts?refresh=5m&orgId=1
It's much easier now to verify metrics, only thing is that the dashboard is quite large.