Page MenuHomePhabricator

Set up sampling profiler for PHP 7 (alternative to HHVM Xenon)
Closed, ResolvedPublic

Description

In Wikimedia production, we profile MediaWiki in two ways:

  • Request profiling for debugging – see T206152.
  • Sampling profiles for production - this task.

This is currently collected from all production servers/requests via the internal HHVM sampling profiler ("Xenon") and periodically collected from HHVM's parent process.

Links:

The Xenon sampling profiler is enabled by default for us in production for all requests. There is no run-time toggle. During request shutdown, we ask HHVM for data. The data is internally buffered by HHVM which means it usually doesn't return anything yet, and then at certain intervals it yields a buffer of what it's got since the last flush, which we send to a Redis queue from which we then produce aggregated log files and flame graphs, published at <https://performance.wikimedia.org/.

High-level tasks:

  • Find or create a sampling profiler for PHP 7. – T205059
  • Install the profiler in production.
  • Generalise the arc-lamp ingestion pipeline to support a second queue. – T195312
  • Set up Redis writer in wmf-config for Excimer (use a separate Redis topic).
  • Enable capturing and flushing of PHP 7 samples to this queue.
Details

SubjectRepoBranchLines +/-
operations/mediawiki-configmaster+51 -20
operations/mediawiki-configmaster+2 -1
operations/puppetproduction+27 -18
operations/mediawiki-configmaster+11 -10
operations/puppetproduction+54 -42
operations/puppetproduction+13 -2
operations/puppetproduction+6 -3
operations/puppetproduction+12 -8
operations/puppetproduction+7 -7
operations/puppetproduction+5 -1
operations/puppetproduction+9 -4
operations/puppetproduction+36 -4
performance/docrootmaster+16 -16
operations/puppetproduction+12 -10
integration/configmaster+1 -0
operations/mediawiki-configmaster+4 -6
operations/puppetproduction+18 -2
operations/mediawiki-configmaster+12 -75
operations/mediawiki-configmaster+100 -67
operations/mediawiki-configmaster+1 -24
operations/mediawiki-configmaster+24 -1
operations/mediawiki-configmaster+12 -0
Show related patches Customize query in gerrit

Event Timeline

Krinkle edited projects, added Performance-Team; removed SRE.

This xhprof fork seems to support sampling: https://github.com/tideways/php-profiler-extension but definitely doesn't include the efficient way of sending the data via the parent process. That extension optionally sends the data to a commercial service, but maybe we can send it to our own thing and make sense of the data instead.

If you're referring to the sample_rate INI setting (docs) , that is only used by the tideways/profiler composer library to decide whether to fully instrument the current request. Essentially equivalent to

# tideways.sample_rate=30
if ( mt_rand( 1, 30 ) === 1 ) {
 tideways_enable(); // aka xhprof_enable()
}

However, this would enable a full XHProf trace on an individual request, which I'd like to avoid. A sampling profiler, as in, throughout a single request, randomly take note of the currently active function's stack, doesn't exist in Tideways currently.

XHProf does have this (xhprof_sample_enable), but that was removed from Tideways at some point (see https://github.com/tideways/php-profiler-extension/issues/26). And either way, the XHProf implementation was quite limited (e.g. https://github.com/phacility/xhprof/issues/76, https://github.com/phacility/xhprof/pull/80, https://github.com/humanmade/query-monitor-flamegraph/issues/2).


Upstream: https://github.com/tideways/php-profiler-extension/issues/26

Got a response from Ryan at tideways/php-profiler-extension#26

I ended up pinging Phacility directly about XHProf, and they pushed an experimental branch for PHP 7: https://github.com/phacility/xhprof/tree/experimental

And given this still has the sampling feature, this might be usable for us (as opposed to Tideways). Although it does have a fairly low (and not configurable) sampling rate by default (once very 100ms), the logic and infrastructure is there.

Got a response from Ryan at tideways/php-profiler-extension#26

👋

And given this still has the sampling feature, this might be usable for us (as opposed to Tideways). Although it does have a fairly low (and not configurable) sampling rate by default (once very 100ms), the logic and infrastructure is there.

It's worth mentioning that the support for configurable sampling has been PR'd in the past: https://github.com/phacility/xhprof/pull/80 - This should be pretty easily adaptable for the PHP 7/experimental branch, since it's not hooked into the PHP/Zend internals (where most of the breakage happened.

Update from Performance Team:

  • We intent to do our own testing with the "experimental" phacility/xhprof branch for PHP7 and see how it goes. We'll compare the generated data to data collected on PHP5 and HHVM for comparison.
  • If all goes well, I'll ask Ops to help build a Debian package for Wikimedia use.

Is phacility ok with us using/redistributing under the xhprof name? It would be good to get any package that we plan on using included in Debian itself, assuming we're picking up maintenance of it.

@Legoktm Good point. I'll ask upstream if they're interested in being involved on the Debian package and, if not, whether its okay for us to maintain one on their behalf.

Further update:

  • I've used the experimental branch from phacility/xhprof (permalink) and been able to use it locally without issue. I've tested it both on macOS 10.13 with PHP 7.1.12 (from Homebrew), and on Debian 8 Jessie with PHP 7.1.12 (in Docker, using webdevops/php-apache-dev:7.1, based on webdevops/php-official:7.1, based on php:7.1-fpm).
  • Output from xhprof_disable() looks compatible with the format output by the older PHP5 version and from HHVM's port.
  • Tested it with MediaWiki, and our libs/Xhprof, ProfilerXhprof and ProfilerOutputText classes work as-is.

This means that for ad-hoc debug profiling of individual requests, xhprof seems to work fine. If for whatever reason, packaging becomes a bottleneck, we can also try tideways_xhprof, which is a popular xhprof fork that supports PHP 7, and actually has already been published on Debian. https://packages.debian.org/stretch/php-tideways

Anyhow, one way or another, it seems the story for debug profiling is fairly straight forward.

More difficult is the sampling profiler. For that we currently use HHVM Xenon. Before our use of HHVM, we didn't have a sampling profiler (aside from sampled full-request profiling, which we did do, many years ago, but adds significant overhead and I'd rather not do that again).

The main hope there is that we'll be able to somehow use [[ https://en.wikipedia.org/wiki/Perf_(Linux) | perf ]]. There is good support for perf (and perf maps) for various interpreters that use compiled code. Chrome V8 (via Node.js) works fine with it, and HHVM works well with it as well. See http://www.brendangregg.com/perf.html#JIT_Symbols and http://www.brendangregg.com/blog/2014-09-17/node-flame-graphs-on-linux.html for more on that.

The question is, can we use perf with PHP 7? Does PHP 7 (like HHVM, unlike PHP 5) compile user functions into native functions with their own memory addresses, and does it support outputting a map for perf?

I thought it would be good to share an update as I've been working on our XHProf rollout this week.

  1. We're using the experimental branch with PHP 7.0 without much issues
  2. I refreshed the patch for sample_interval support and deployed that (https://github.com/humanmade/xhprof/pull/2)
  3. I ran into a bug with segfaults when using create_function and patched in https://github.com/humanmade/xhprof/pull/1

Thanks @Joehoyle. It's really good to hear that the branch has been working without issue.

Until recently, my main hope has been to only need XHProf for manual/debug profiling (unsampled), and to use something else for the (production) sampling profiler use case. Something external to individual PHP request threads. E.g. a C extension in a shared PHP process, or something OS-level, like Linux perf. However, I haven't yet had much luck getting that to work (yet).

The main reason is because I fear the overhead in-process instrumentation typically has.

I haven't yet measured overhead of phacility/xhprof:experimental, but here is some data measured using HHVM's XHProf.

Loading https://www.mediawiki.org/w/index.php?title=Wikimedia_Performance_Team&action=history with browser cache disabled, three loads:

  1. host: mw1243, backendTime: 363ms
  2. host: mw1248, backendTime: 573ms
  3. host: mw1267, backendTime: 411ms

Loading https://www.mediawiki.org/w/index.php?title=Wikimedia_Performance_Team&action=history with browser cache disabled, using X-Wikimedia-Debug to target a specific depooled host, three loads:

  1. host: mwdebug1001, backendTime: 450ms
  2. host: mwdebug1001, backendTime: 415ms
  3. host: mwdebug1001, backendTime: 384ms

Loading https://www.mediawiki.org/w/index.php?title=Wikimedia_Performance_Team&action=history with browser cache disabled, using X-Wikimedia-Debug to enable XHProf (unsampled) for the host-targeted request, three loads:

  1. host: mwdebug1001, backendTime: 1252ms
  2. host: mwdebug1001, backendTime: 1297ms
  3. host: mwdebug1001, backendTime: 1298ms

This probably won't be a surprise, but suffice it to say, overhead is about 3X. Given our current sampling profiler in HHVM has essentially close to zero overhead, it'd be nice to be able to continue that in some way.

If I understand the above numbers correctly, this is using xhprof_enable, which is orders of magnitude slower than xhprof_sample_enable. We're only using the latter. I'd recommend testing xhprof_sample_enable before looking at an out-of-process approach (incidentally I have tries this in the past with dtrace or similar to use os level markers, but never made good progress.)

As far as I understand xhprof_sample_enable on experimental is no slower than HHVM's version of the same thing, but if you numbers above (3x slower) _is_ using xhprof_sample_enable then disregard everything I just said!

If I understand the above numbers correctly, this is using xhprof_enable, which is orders of magnitude slower than xhprof_sample_enable.

Yep, our debug mode uses xhprof_enable. I used it mainly to show that we don't want to use that on any portion of production traffic. It has high overhead, but the results are worth it, given its use case for manual profiling by developers. But, for the production use case, we currently use Xenon (see task description for details).

I was unsure as to whether or not xhprof_sample_enable would be fast enough, but I'll definitely give it a try.

Change 434487 had a related patch set uploaded (by Krinkle; owner: Krinkle):
[operations/mediawiki-config@master] profiler: Document the supported XWD attributes

https://gerrit.wikimedia.org/r/434487

Change 434488 had a related patch set uploaded (by Krinkle; owner: Krinkle):
[operations/mediawiki-config@master] profiler-labs: Add experimental code to sample with xhprof (Beta Cluster)

https://gerrit.wikimedia.org/r/434488

Change 434487 merged by jenkins-bot:
[operations/mediawiki-config@master] profiler: Document the supported XWD attributes

https://gerrit.wikimedia.org/r/434487

Change 434488 merged by jenkins-bot:
[operations/mediawiki-config@master] profiler-labs: Add experimental code to sample with xhprof (Beta Cluster)

https://gerrit.wikimedia.org/r/434488

Change 434522 had a related patch set uploaded (by Krinkle; owner: Krinkle):
[operations/mediawiki-config@master] profiler-labs: Use FlameGraph-compatible format for xhprof sampler

https://gerrit.wikimedia.org/r/434522

Change 434522 had a related patch set uploaded (by Krinkle; owner: Krinkle):
[operations/mediawiki-config@master] profiler-labs: Use FlameGraph-compatible format for xhprof sampler

https://gerrit.wikimedia.org/r/434522

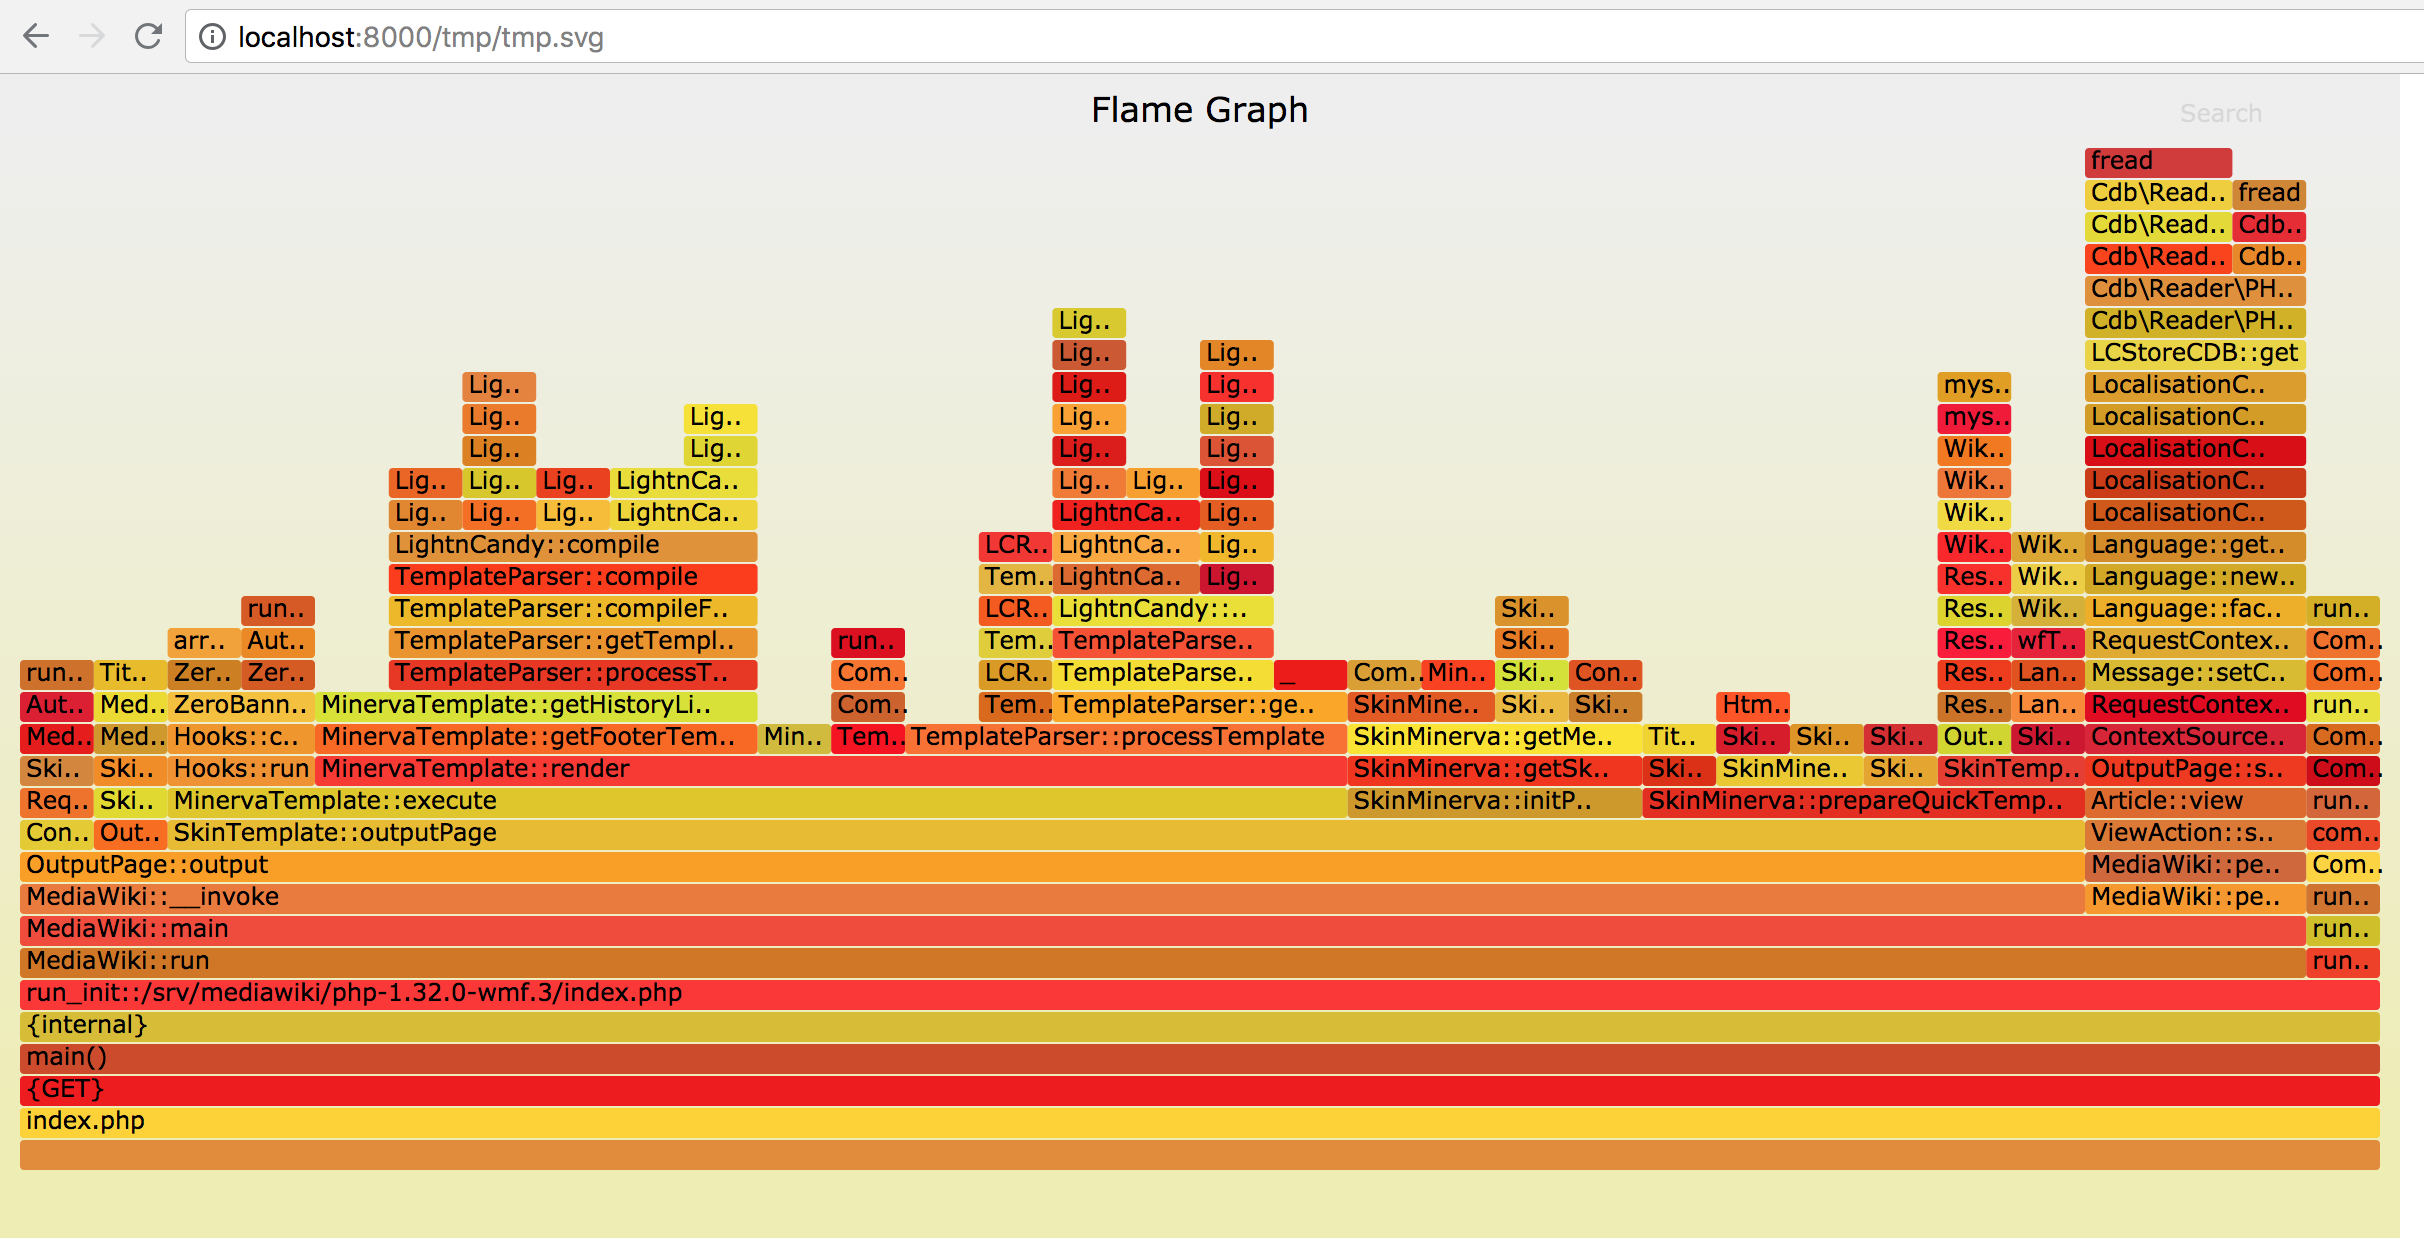
Using the above patch on mwdebug1001 in production, I used the following cURL request to obtain a few FlameGraph-compatible lines from XHProf's sampling mode:

$ curl -i -H 'X-Wikimedia-Debug: backend=mwdebug1001.eqiad.wmnet; sampleprofiler' 'https://en.wikipedia.org/w/index.php?title=Main_Page&useskin=minerva&uselang=nl&debugger=T176916'

In most cases, the sampling interval of 0.1s used by XHProf means that generally you only get 1 or 2 frames on a typical request. But when using the Main_Page (which is fairly complex), and a combination of skin/language not recently used on the same server, it'll take longer and produce 20-30 frames.

Using the above example, I got the following output:

..<script>(window.RLQ=window.RLQ||[]).push(function(){mw.config.set({"wgBackendResponseTime":1150,"wgHostname":"mwdebug1001"});});</script>		</body>
		</html>
		<!--
index.php;{GET};main();{internal};run_init::/srv/mediawiki/php-1.32.0-wmf.3/index.php;run_init::/srv/mediawiki/php-1.32.0-wmf.3/includes/WebStart.php;run_init::/srv/mediawiki/php-1.32.0-wmf.3/includes/Setup.php;run_init::/srv/mediawiki/php-1.32.0-wmf.3/vendor/autoload.php;ComposerAutoloaderInit_mediawiki_vendor::getLoader;composerRequire_mediawiki_vendor;run_init::/srv/mediawiki/php-1.32.0-wmf.3/vendor/data-values/geo/Geo.php;Composer\Autoload\ClassLoader::loadClass;Composer\Autoload\includeFile;run_init::/srv/mediawiki/php-1.32.0-wmf.3/vendor/data-values/geo/src/Values/LatLongValue.php;Composer\Autoload\ClassLoader::loadClass@1;Composer\Autoload\includeFile@1;run_init::/srv/mediawiki/php-1.32.0-wmf.3/vendor/data-values/data-values/src/DataValues/DataValueObject.php 1
index.php;{GET};main();{internal};run_init::/srv/mediawiki/php-1.32.0-wmf.3/index.php;MediaWiki::run;MediaWiki::main;MediaWiki::performRequest;MediaWiki::performAction;ViewAction::show;Article::view;OutputPage::setPageTitle;ContextSource::msg;RequestContext::msg;Message::setContext;RequestContext::getLanguage;Language::factory;Language::newFromCode;Language::getFallbacksFor;LocalisationCache::getItem;LocalisationCache::loadItem;LocalisationCache::initLanguage;LocalisationCache::getItem@1;LocalisationCache::loadItem@1;LCStoreCDB::get;Cdb\Reader\PHP::get;Cdb\Reader\PHP::find;Cdb\Reader\PHP::readInt32;Cdb\Reader\PHP::read;fread 1
index.php;{GET};main();{internal};run_init::/srv/mediawiki/php-1.32.0-wmf.3/index.php;MediaWiki::run;MediaWiki::main;MediaWiki::performRequest;MediaWiki::performAction;ViewAction::show;Article::view;OutputPage::setPageTitle;ContextSource::msg;RequestContext::msg;Message::setContext;RequestContext::getLanguage;Language::factory;Language::newFromCode;Language::getFallbacksFor;LocalisationCache::getItem;LocalisationCache::loadItem;LocalisationCache::initLanguage;LocalisationCache::getItem@1;LocalisationCache::loadItem@1;LCStoreCDB::get;Cdb\Reader\PHP::get;Cdb\Reader\PHP::find;Cdb\Reader\PHP::readInt31;Cdb\Reader\PHP::readInt32;Cdb\Reader\PHP::read;fread 2
index.php;{GET};main();{internal};run_init::/srv/mediawiki/php-1.32.0-wmf.3/index.php;MediaWiki::run;MediaWiki::main;MediaWiki::__invoke;OutputPage::output;ContextSource::getSkin;RequestContext::getSkin;SkinFactory::makeSkin;MediaWiki\Services\ServiceContainer::__invoke;AutoLoader::autoload;run_init::/srv/mediawiki/php-1.32.0-wmf.3/skins/MinervaNeue/includes/skins/SkinMinerva.php 1
index.php;{GET};main();{internal};run_init::/srv/mediawiki/php-1.32.0-wmf.3/index.php;MediaWiki::run;MediaWiki::main;MediaWiki::__invoke;OutputPage::output;OutputPage::loadSkinModules;SkinMinerva::getDefaultModules;SkinMinerva::getContextSpecificModules;MediaWiki\Minerva\SkinUserPageHelper::isUserPage;MediaWiki\Minerva\SkinUserPageHelper::fetchData;Title::inNamespace 1
index.php;{GET};main();{internal};run_init::/srv/mediawiki/php-1.32.0-wmf.3/index.php;MediaWiki::run;MediaWiki::main;MediaWiki::__invoke;OutputPage::output;SkinTemplate::outputPage;SkinMinerva::initPage;SkinMinerva::getSkinConfigVariables;SkinMinerva::getMenuData;SkinMinerva::getDiscoveryTools;Composer\Autoload\ClassLoader::loadClass 1
index.php;{GET};main();{internal};run_init::/srv/mediawiki/php-1.32.0-wmf.3/index.php;MediaWiki::run;MediaWiki::main;MediaWiki::__invoke;OutputPage::output;SkinTemplate::outputPage;SkinMinerva::initPage;SkinMinerva::getSkinConfigVariables;SkinMinerva::getMenuData;SkinMinerva::getDiscoveryTools;MinervaUI::iconClass 1
index.php;{GET};main();{internal};run_init::/srv/mediawiki/php-1.32.0-wmf.3/index.php;MediaWiki::run;MediaWiki::main;MediaWiki::__invoke;OutputPage::output;SkinTemplate::outputPage;SkinMinerva::initPage;SkinMinerva::getSkinConfigVariables;SkinMinerva::getMenuData;SkinMinerva::getPersonalTools;SkinMinerva::buildPersonalTools;SkinMinerva::insertLogInOutMenuItem;SkinMinerva::getLoginUrl 1
index.php;{GET};main();{internal};run_init::/srv/mediawiki/php-1.32.0-wmf.3/index.php;MediaWiki::run;MediaWiki::main;MediaWiki::__invoke;OutputPage::output;SkinTemplate::outputPage;SkinMinerva::initPage;SkinMinerva::getSkinConfigVariables;SkinMinerva::getMenuData;SkinMinerva::getSiteLinks;ContextSource::msg 1
index.php;{GET};main();{internal};run_init::/srv/mediawiki/php-1.32.0-wmf.3/index.php;MediaWiki::run;MediaWiki::main;MediaWiki::__invoke;OutputPage::output;SkinTemplate::outputPage;SkinMinerva::prepareQuickTemplate;SkinTemplate::prepareQuickTemplate;Skin::lastModified;Language::userTime;Language::internalUserTimeAndDate;wfTimestamp;Wikimedia\Timestamp\ConvertibleTimestamp::convert;Wikimedia\Timestamp\ConvertibleTimestamp::__construct;Wikimedia\Timestamp\ConvertibleTimestamp::setTimestamp 1
index.php;{GET};main();{internal};run_init::/srv/mediawiki/php-1.32.0-wmf.3/index.php;MediaWiki::run;MediaWiki::main;MediaWiki::__invoke;OutputPage::output;SkinTemplate::outputPage;SkinMinerva::prepareQuickTemplate;SkinTemplate::prepareQuickTemplate;OutputPage::headElement;ResourceLoaderClientHtml::getHeadHtml;ResourceLoaderClientHtml::getData;ResourceLoaderWikiModule::isKnownEmpty;ResourceLoaderWikiModule::getTitleInfo;ResourceLoaderWikiModule::fetchTitleInfo;Wikimedia\Rdbms\Database::select;Wikimedia\Rdbms\Database::query;Wikimedia\Rdbms\Database::doProfiledQuery;Wikimedia\Rdbms\DatabaseMysqli::doQuery;mysqli::query;mysqli::store_result 1
index.php;{GET};main();{internal};run_init::/srv/mediawiki/php-1.32.0-wmf.3/index.php;MediaWiki::run;MediaWiki::main;MediaWiki::__invoke;OutputPage::output;SkinTemplate::outputPage;SkinMinerva::prepareQuickTemplate;SkinMinerva::getSecondaryActions;Title::isMainPage 1
index.php;{GET};main();{internal};run_init::/srv/mediawiki/php-1.32.0-wmf.3/index.php;MediaWiki::run;MediaWiki::main;MediaWiki::__invoke;OutputPage::output;SkinTemplate::outputPage;SkinMinerva::prepareQuickTemplate;SkinMinerva::prepareHeaderAndFooter;SkinMinerva::getTaglineHtml 1
index.php;{GET};main();{internal};run_init::/srv/mediawiki/php-1.32.0-wmf.3/index.php;MediaWiki::run;MediaWiki::main;MediaWiki::__invoke;OutputPage::output;SkinTemplate::outputPage;SkinMinerva::prepareQuickTemplate;SkinMinerva::prepareHeaderAndFooter;SkinMinerva::getSitename;Html::element 1
index.php;{GET};main();{internal};run_init::/srv/mediawiki/php-1.32.0-wmf.3/index.php;MediaWiki::run;MediaWiki::main;MediaWiki::__invoke;OutputPage::output;SkinTemplate::outputPage;SkinMinerva::prepareQuickTemplate;SkinMinerva::preparePageActions;SkinMinerva::isAllowedPageAction 1
index.php;{GET};main();{internal};run_init::/srv/mediawiki/php-1.32.0-wmf.3/index.php;MediaWiki::run;MediaWiki::main;MediaWiki::__invoke;OutputPage::output;SkinTemplate::outputPage;MinervaTemplate::execute;Hooks::run;Hooks::callHook;ZeroBanner\PageRenderingHooks::onMinervaPreRender;ZeroBanner\PageRenderingHooks::getState;AutoLoader::autoload;run_init::/srv/mediawiki/php-1.32.0-wmf.3/extensions/ZeroBanner/includes/PageRendering.php 1
index.php;{GET};main();{internal};run_init::/srv/mediawiki/php-1.32.0-wmf.3/index.php;MediaWiki::run;MediaWiki::main;MediaWiki::__invoke;OutputPage::output;SkinTemplate::outputPage;MinervaTemplate::execute;Hooks::run;Hooks::callHook;ZeroBanner\PageRenderingHooks::onMinervaPreRender;ZeroBanner\PageRendering::onMinervaPreRender;array_key_exists 1
index.php;{GET};main();{internal};run_init::/srv/mediawiki/php-1.32.0-wmf.3/index.php;MediaWiki::run;MediaWiki::main;MediaWiki::__invoke;OutputPage::output;SkinTemplate::outputPage;MinervaTemplate::execute;MinervaTemplate::render;TemplateParser::86pinit;Composer\Autoload\ClassLoader::loadClass;Composer\Autoload\includeFile;run_init::/srv/mediawiki/php-1.32.0-wmf.3/vendor/zordius/lightncandy/src/lightncandy.php 1
index.php;{GET};main();{internal};run_init::/srv/mediawiki/php-1.32.0-wmf.3/index.php;MediaWiki::run;MediaWiki::main;MediaWiki::__invoke;OutputPage::output;SkinTemplate::outputPage;MinervaTemplate::execute;MinervaTemplate::render;MinervaTemplate::getMainMenuHtml 1
index.php;{GET};main();{internal};run_init::/srv/mediawiki/php-1.32.0-wmf.3/index.php;MediaWiki::run;MediaWiki::main;MediaWiki::__invoke;OutputPage::output;SkinTemplate::outputPage;MinervaTemplate::execute;MinervaTemplate::render;MinervaTemplate::getFooterTemplateData;MinervaTemplate::getHistoryLinkHtml 1
index.php;{GET};main();{internal};run_init::/srv/mediawiki/php-1.32.0-wmf.3/index.php;MediaWiki::run;MediaWiki::main;MediaWiki::__invoke;OutputPage::output;SkinTemplate::outputPage;MinervaTemplate::execute;MinervaTemplate::render;MinervaTemplate::getFooterTemplateData;MinervaTemplate::getHistoryLinkHtml;TemplateParser::processTemplate;TemplateParser::getTemplate;TemplateParser::compileForEval;TemplateParser::compile;LightnCandy::compile;LightnCandy::buildContext;LightnCandy::buildHelperTable 1
index.php;{GET};main();{internal};run_init::/srv/mediawiki/php-1.32.0-wmf.3/index.php;MediaWiki::run;MediaWiki::main;MediaWiki::__invoke;OutputPage::output;SkinTemplate::outputPage;MinervaTemplate::execute;MinervaTemplate::render;MinervaTemplate::getFooterTemplateData;MinervaTemplate::getHistoryLinkHtml;TemplateParser::processTemplate;TemplateParser::getTemplate;TemplateParser::compileForEval;TemplateParser::compile;LightnCandy::compile;LightnCandy::verifyTemplate;LightnCandy::scanFeatures;LightnCandy::parseTokenArgs;LightnCandy::fixVariable 1
index.php;{GET};main();{internal};run_init::/srv/mediawiki/php-1.32.0-wmf.3/index.php;MediaWiki::run;MediaWiki::main;MediaWiki::__invoke;OutputPage::output;SkinTemplate::outputPage;MinervaTemplate::execute;MinervaTemplate::render;MinervaTemplate::getFooterTemplateData;MinervaTemplate::getHistoryLinkHtml;TemplateParser::processTemplate;TemplateParser::getTemplate;TemplateParser::compileForEval;TemplateParser::compile;LightnCandy::compile;LightnCandy::verifyTemplate;LightnCandy::scanFeatures 1
index.php;{GET};main();{internal};run_init::/srv/mediawiki/php-1.32.0-wmf.3/index.php;MediaWiki::run;MediaWiki::main;MediaWiki::__invoke;OutputPage::output;SkinTemplate::outputPage;MinervaTemplate::execute;MinervaTemplate::render;MinervaTemplate::getFooterTemplateData;MinervaTemplate::getHistoryLinkHtml;TemplateParser::processTemplate;TemplateParser::getTemplate;TemplateParser::compileForEval;TemplateParser::compile;LightnCandy::compile;LightnCandy::compileTemplate;LightnCandy::compileToken;LightnCandy::compileVariable;LightnCandy::getVariableName;LightnCandy::getExpression 1
index.php;{GET};main();{internal};run_init::/srv/mediawiki/php-1.32.0-wmf.3/index.php;MediaWiki::run;MediaWiki::main;MediaWiki::__invoke;OutputPage::output;SkinTemplate::outputPage;MinervaTemplate::execute;MinervaTemplate::render;MinervaTemplate::getFooterTemplateData;MinervaTemplate::getHistoryLinkHtml;TemplateParser::processTemplate;TemplateParser::getTemplate;TemplateParser::compileForEval;TemplateParser::compile;LightnCandy::compile;LightnCandy::composePHPRender;LightnCandy::getBoolStr 1
index.php;{GET};main();{internal};run_init::/srv/mediawiki/php-1.32.0-wmf.3/index.php;MediaWiki::run;MediaWiki::main;MediaWiki::__invoke;OutputPage::output;SkinTemplate::outputPage;MinervaTemplate::execute;MinervaTemplate::render;TemplateParser::processTemplate 1
index.php;{GET};main();{internal};run_init::/srv/mediawiki/php-1.32.0-wmf.3/index.php;MediaWiki::run;MediaWiki::main;MediaWiki::__invoke;OutputPage::output;SkinTemplate::outputPage;MinervaTemplate::execute;MinervaTemplate::render;TemplateParser::processTemplate;TemplateParser::getTemplate;TemplateParser::compileForEval;TemplateParser::compile;LightnCandy::compile;LightnCandy::verifyTemplate;LightnCandy::scanFeatures;LightnCandy::validateOperations;LightnCandy::readPartial;LightnCandy::compilePartial;LightnCandy::verifyTemplate@1;LightnCandy::scanFeatures@1;LightnCandy::validateOperations@1 1
index.php;{GET};main();{internal};run_init::/srv/mediawiki/php-1.32.0-wmf.3/index.php;MediaWiki::run;MediaWiki::main;MediaWiki::__invoke;OutputPage::output;SkinTemplate::outputPage;MinervaTemplate::execute;MinervaTemplate::render;TemplateParser::processTemplate;TemplateParser::getTemplate;TemplateParser::compileForEval;TemplateParser::compile;LightnCandy::compile;LightnCandy::compileTemplate;LightnCandy::compileToken;LightnCandy::compileSection;LightnCandy::getVariableNames 1
index.php;{GET};main();{internal};run_init::/srv/mediawiki/php-1.32.0-wmf.3/index.php;MediaWiki::run;MediaWiki::main;MediaWiki::__invoke;OutputPage::output;SkinTemplate::outputPage;MinervaTemplate::execute;MinervaTemplate::render;TemplateParser::processTemplate;TemplateParser::getTemplate;TemplateParser::compileForEval;TemplateParser::compile;LightnCandy::compile;LightnCandy::compileTemplate;LightnCandy::compileToken;LightnCandy::compileSection;LightnCandy::compileTemplate@1;LightnCandy::compileToken@1;LightnCandy::compileSection@1;LightnCandy::compileBlockBegin;LightnCandy::getVariableNameOrSubExpression;LightnCandy::getVariableName 1
index.php;{GET};main();{internal};run_init::/srv/mediawiki/php-1.32.0-wmf.3/index.php;MediaWiki::run;MediaWiki::main;MediaWiki::__invoke;OutputPage::output;SkinTemplate::outputPage;MinervaTemplate::execute;MinervaTemplate::render;TemplateParser::processTemplate;TemplateParser::getTemplate;_ 1
index.php;{GET};main();{internal};run_init::/srv/mediawiki/php-1.32.0-wmf.3/index.php;MediaWiki::run;MediaWiki::main;MediaWiki::__invoke;OutputPage::output;SkinTemplate::outputPage;MinervaTemplate::execute;MinervaTemplate::render;TemplateParser::processTemplate;TemplateParser::__invoke;LCRun3::sec;TemplateParser::__invoke@1;LCRun3::sec@1;TemplateParser::__invoke@2;LCRun3::sec@2 1

-->

And locally generated the following flamegraph:

Screen Shot 2018-05-22 at 17.05.58.png (1×2 px, 514 KB)

This shows the general idea should work (functionally speaking). However per T176916#4030409, I still have to check what the overhead is to determine whether it'd be acceptable in production.

Using gdb will likely have a much smaller overhead.

Basic idea:

# Grab PHP helpers for gdb
$ curl https://raw.githubusercontent.com/php/php-src/master/.gdbinit -o php-gdb-init
# Make sure you have debug symbols installed
$ sudo apt install php7.0-*-dbgsym
# Run gdb in batch mode (-batch), skipping all init files (-nx) and loading php-gdb-init instead (-x php-gdb-init). Print a backtrace (-ex zbacktrace) and exit.
$ sudo gdb -batch -nx -x php-gdb-init -ex 'zbacktrace' -p $PID_OF_PHP

I haven't tested this since I don't have access to a machine with php7 + debug symbols at the moment, but the basic idea should work.

Measured the overhead of xhprof's sample mode.

Example command:

$ curl -i -H 'X-Wikimedia-Debug: backend=mwdebug1001.eqiad.wmnet' 'https://test2.wikipedia.org/w/load.php?modules=startup' | tac | tac | grep backend-timing

backend-timing: D=851139 t=1529084906478694
# => 851,139 ns
# => 851 ms
URLRegularSampled profile
enwiki view Main Page135ms, 129ms, 103ms143ms (+ 5%), 140ms, 136ms (+ 32%)
test2wiki RL startup851ms, 781ms, 680ms928ms (+ 9%), 913ms, 909ms (+ 33%)
mworg history action551ms, 422ms, 411ms543ms (- 1%), 531ms, 515ms (+ 25%)

The full profile is only here for completion (we don't need that level of prevision, and T176916#4030409 already found its >300% overhead).

However, I found that even in sampling mode with an interval as big as 100ms, there seems to be quite noticeable overhead of enabling XHProf during a request. Specifically the overhead seems to be at least 5-10%, up to 25-35%.

That seems unacceptable to apply to all MW production traffic. I suppose it was worth a try, but at least something this simplistic won't work with XHProf. It might be worth giving the PHP7 port of XHProf a try, given its implementation will vary from HHVM, but I'm not optimistic.

$ sudo gdb -batch -nx -x php-gdb-init -ex 'zbacktrace' -p $PID_OF_PHP

On my laptop, this stalls the PHP process for 1.3 seconds since it keeps the process stopped while it tries to load symbols for every mapped library. It doesn't seem to help to preload symbols: even an attach/detach cycle in an interactive session causes it to stop the process and load symbols every time "attach" is run.

I think a DIY solution along these lines could work, either in the same process or with ptrace() like gdb. I previously had concerns about non-atomic updates of EG(current_execute_data), but looking at the code in git master, it seems near enough to atomic. Doing it with ptrace() would provide some protection against inconsistent EG(current_execute_data).

However, I found that even in sampling mode with an interval as big as 100ms, there seems to be quite noticeable overhead of enabling XHProf during a request. Specifically the overhead seems to be at least 5-10%, up to 25-35%.

XHProf's sampled mode is apparently implemented by installing function entry/exit hooks, as in the normal mode, but having them do nothing unless the sample interval has expired.

@Smalyshev do you have any thoughts on the idea of reading EG(current_execute_data) from a signal handler as a profiling method?

On first impressions I think it will be possible to get the method name, filename and line number, but there are lots of details to consider. For example I just checked to make sure that ZEND_CALL_RELEASE_THIS is always handled after EG(current_execute_data) is restored to point to the parent frame. I see that EG(current_execute_data) is set to NULL early in php_request_shutdown(), and _zend_bailout() also clears it. It's in .bss so it's zero-filled at startup, although it's probably safer to check for EG(active)==1.

We don't profile builtins, which makes things a bit simpler. zend_fetch_debug_backtrace() has

				if (func->common.scope) {
					ZVAL_STR_COPY(&tmp, func->common.scope->name);
				} else if (object->handlers->get_class_name == zend_std_get_class_name) {
					ZVAL_STR_COPY(&tmp, object->ce->name);
				} else {
					ZVAL_STR(&tmp, object->handlers->get_class_name(object));
				}

I think we only need the first case here, and skip the second and third as builtins. Which also means I can relax about EX(This) validity since this is the only thing that needs it.

do you have any thoughts on the idea of reading EG(current_execute_data) from a signal handler as a profiling method?

I do not foresee much trouble with EG(current_execute_data) - we might occasionally get inside executor code where it transitions between functions, but I don't think it's ever in the state where the data is not useable at all (needs to be verified of course). Not profiling startup and shutdown (beyond the part where PHP shutdown functions run) stages would be smart, of course.

Handling signals may be a bit tricky in general cases (since PHP can mess with signals too and some parts of the engine may disable signals) but I think in our case for our code it should be ok. Not sure whether signals interrupting syscalls is a problem...

Handling signals may be a bit tricky in general cases (since PHP can mess with signals too and some parts of the engine may disable signals) but I think in our case for our code it should be ok. Not sure whether signals interrupting syscalls is a problem...

We did run this experiment in LuaSandbox+PHP5 for a while, and there was T45034 complaining about EINTR breaking things. In theory interrupted syscalls should be restarted, but there was the reproducible problem of an infinite loop of syscall restarts because the syscall in question always took longer than the sampling interval. That was with a 2ms interval, if we aim for 100ms here then we wouldn't have that exact problem.

The fix in LuaSandbox was to use a separate thread to atomically set an opline hook. Then when the Lua VM goes to the next opline, the profiler is executed via the hook. It used to be that the PHP VM didn't have a similar hook, but it looks like that is fixed now? I see there is zend_interrupt_function, which is now used to call signal handlers from pcntl. A PHP profiler that uses EG(vm_interrupt) would be really neat.

Change 434522 merged by jenkins-bot:
[operations/mediawiki-config@master] profiler-labs: Remove 'sampleprofiler' experiment

https://gerrit.wikimedia.org/r/434522

It used to be that the PHP VM didn't have a similar hook, but it looks like that is fixed now? I see there is zend_interrupt_function, which is now used to call signal handlers from pcntl. A PHP profiler that uses EG(vm_interrupt) would be really neat.

Yes, zend_interrupt_function is used for timeout/signal handling now (though I think signal handling came in later, in 7.1). I think it should be possible to reuse it for profiling too. The caveat there is that it seems to not be triggered on every statement but rather in some points like calls, branches, etc. - so profiling might be less granular than e.g. line/statement based profiler (which would require employing something like EXT_STMT functionality and thus have much worse performance generally). So it depends on how granular we want the profiling to be. If it's only fcall level, then the old zend_execute override should be fine.