With all of the various ways to use maps these days, we should be able to do this too. See for example this feature enabled for people on the RKD website (e.g. Rembrandt moved from Leiden to Amsterdam https://rkd.nl/nl/explore/artists/66219) and also for artworks (e.g. this painting by Rembrandt https://rkd.nl/nl/explore/images/52817). Note how his works travel much farther than he did. All this does now is plot the locations in the record and plot a line between them.
Description
Description
Event Timeline
Comment Actions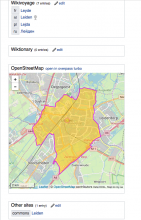
Hi,
@mxn has created a script that can be used for logged in accounts on Wikidata to add in a map for objects that have coordinates. The script can be added to your common.js file on Wikidata:
https://www.wikidata.org/wiki/Wikidata:Tools/User_scripts#overpass
https://phabricator.wikimedia.org/T173052
mw.loader.load( '//www.wikidata.org/w/index.php?title=User:Mxn/overpass.js&action=raw&ctype=text/javascript' );
and when landing on the page for Leiden, you'll see a map like this:
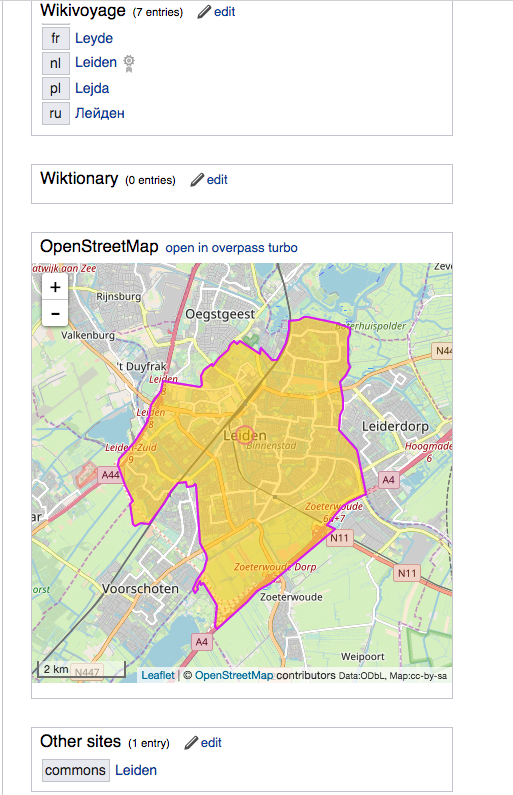
Now, this isn't exactly what you're refering to, but maybe some collaboration can take place starting with the script that @mxn has created. :)
Comment Actions
I was talking about this with Jane earlier. Focus of this task is https://query.wikidata.org/ . Here we have ways to visualize queries. These are described at https://www.wikidata.org/wiki/Wikidata:SPARQL_query_service/Wikidata_Query_Help/Result_Views . Here we request to implement a new view so we can do a query which returns combinations of coordinates and timestamps, and visualize that like the RKD example.
The RKD example uses Leaflet and that's what we are also using for the maps in the query service so I wonder how much tweaking needs to be done to get this working in the query service.
Comment Actions
Yes that map for Leiden looks interesting on a per-location basis. I really like the idea of connecting the dots however. It also gives people some motivation to type in the places artists lived and worked, rather than just stopping at the birth and death places.
Comment Actions
You could combine Result Views to build something like Scholia by @Fnielsen
It is very ease to create such a SPARQL driven app with some basic knowledge of HTML and JavaScript.
This might be also an interesting project for the upcoming hackathon.
Comment Actions
Yes, see for instance here https://tools.wmflabs.org/scholia/author/Q159552#Locations for Johannes V. Jensen or here https://tools.wmflabs.org/scholia/award/Q185667#Locations%20of%20recipients for awards. At present Scholia is mostly for science and scientist though it will also work for Rembrandt, see https://tools.wmflabs.org/scholia/author/Q5598#Locations
Comment Actions
Hmm that is nice, that doesn't seem to work too well for Rembrandt. I guess his paintings have traveled too far over time. I like the plot of the places of residence, but it would be nice to have them plotted with lines in order of residence. We have lots of people on Wikidata (not just painters) who unlike Rembrandt, were born in one country, lived in another country, and died in yet some other country. Sometimes location data helps to get these people onto the radar of various nationally-oriented wikiprojects. I didn't know that Descartes lived for a short while within bicycling distance of my house. It made me look at his work in a different way.
Comment Actions
"but it would be nice to have them plotted with lines in order of residence". This is not support by WDQS at the moment AFAIK. If you want that you might want such a specific functionality you might want to create a specific task and perhaps @Jonas could look into that at some point.
Comment Actions
The WMF maps team won't have bandwidth to work on this in the foreseeable future. WMDE or volunteer patches welcome.
Comment Actions
See this query: tinyurl.com/y76l2bft for an example of how to draw lines on a WDQS results map, based on values from variables in a WDQS query (in this case, drawing the bounding boxes of some maps)
The trick is to use CONCAT( ) to write the relevant data you want into a string of the right format, and then STRDT ( ) to promote the string to type geo:wktLiteral
See :en:Well-known text for some of the geometric shapes this makes available, eg lines, polygons, curves, etc.
Comment Actions
Based on the responses this task description needs updating to make clear what the end result should be.
Comment Actions
Here is one I did for JVJ's residence based on the @Jheald approach: http://tinyurl.com/yb3k84qj
Comment Actions
Very nice!
It's interesting that the sort-order in the subquery is preserved by the GROUP_CONCAT. (So eg this query works: http://tinyurl.com/yafz8zvn)
I'm not sure that the SPARQL standard guarantees this, indeed I thought I could remember @Lucas_Werkmeister_WMDE complaining that there seemed to be no way to ensure it. But it does indeed appear to work, so many thanks @Fnielsen for showing this is how it can be done.
Here's a very slightly tweaked version of @Fnielsen 's query -- this time workplaces of society portrait painter Philip de Laszlo, showing points as well as lines: http://tinyurl.com/ydev3fjs
Comment Actions
Yeah, the standard does not specify the ordering "The order of the strings is not specified." - https://www.w3.org/TR/sparql11-query/#defn_aggGroupConcat see also https://stackoverflow.com/questions/47460803/sparql-group-by-and-order-by-not-ordered .