Previously an 'cannot connect to server' error message was shown, now you just get an almost blank page (except for the personal tools bar).
Description
Description
Details
Details
| Subject | Repo | Branch | Lines +/- | |
|---|---|---|---|---|
| Fix: When cxserver is down, Dashboard is empty page | mediawiki/extensions/ContentTranslation | master | +11 -7 |
Event Timeline
Comment Actions
Change 395720 had a related patch set uploaded (by KartikMistry; owner: Santhosh):
[mediawiki/extensions/ContentTranslation@master] Fix: When cxserver is down, Dashboard is empty page
Comment Actions
Change 395720 merged by KartikMistry:
[mediawiki/extensions/ContentTranslation@master] Fix: When cxserver is down, Dashboard is empty page
Comment Actions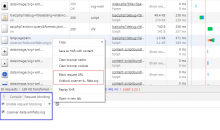
@Etonkovidova, if you need help testing this, here is one way, using Chrome DevTools:
- Go to CX page
- Open DevTools and navigate to Network tab
- If you don't have any network activity recorded, reload the page
- Once you have recorded network activity, find languagepairs entry
- Right click on the entry itself to open the context menu
- Choose one of request blocking options: Block request URL or Block request domain Marked with red rectangle on the screenshot
- Reload the page again to see error message
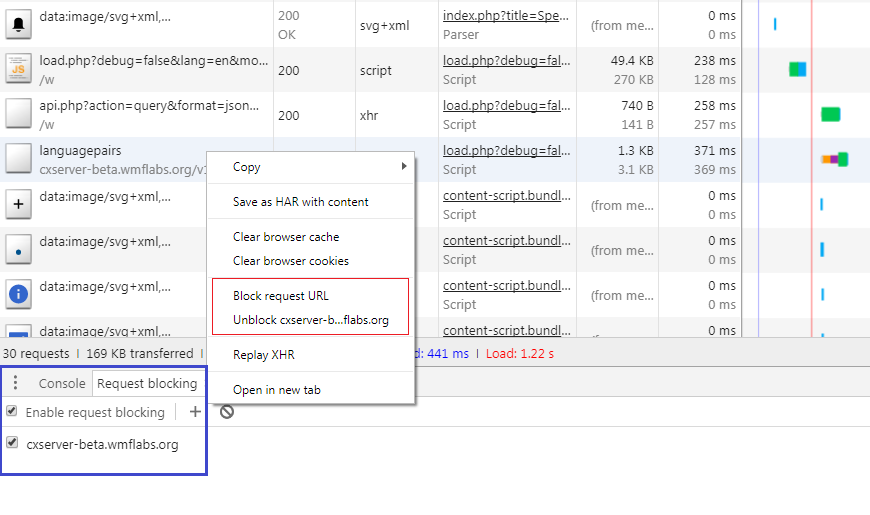
I haven't checked for how long the selected blocking is active, so it's better to make sure that you delete it from bottom drawer, which you can see on the image, called "Request blocking". Marked with blue rectangle on the screenshot