Page MenuHomePhabricator

Measure time spent in scripting/painting/rendering for Chrome [proxy]
Closed, ResolvedPublic

Assigned To
Authored By
Peter
Dec 9 2017, 11:41 PM
Referenced Files
F14021744: scripting-time.png
Feb 26 2018, 5:26 AM
F12369281: Screen Shot 2018-01-10 at 5.54.18 AM.png
Jan 10 2018, 4:59 AM
F12369284: Screen Shot 2018-01-10 at 5.54.26 AM.png
Jan 10 2018, 4:59 AM
F12369293: Screen Shot 2018-01-10 at 5.54.53 AM.png
Jan 10 2018, 4:59 AM
F12336985: Screen Shot 2018-01-09 at 9.21.09 AM.png
Jan 9 2018, 8:28 AM
F12324702: Screen Shot 2018-01-08 at 8.42.53 PM.png
Jan 8 2018, 7:44 PM
F11938301: Screen Shot 2017-12-19 at 9.26.34 PM.png
Dec 19 2017, 8:28 PM
F11928775: Screen Shot 2017-12-19 at 11.37.18 AM.png
Dec 19 2017, 10:38 AM
Subscribers

Description

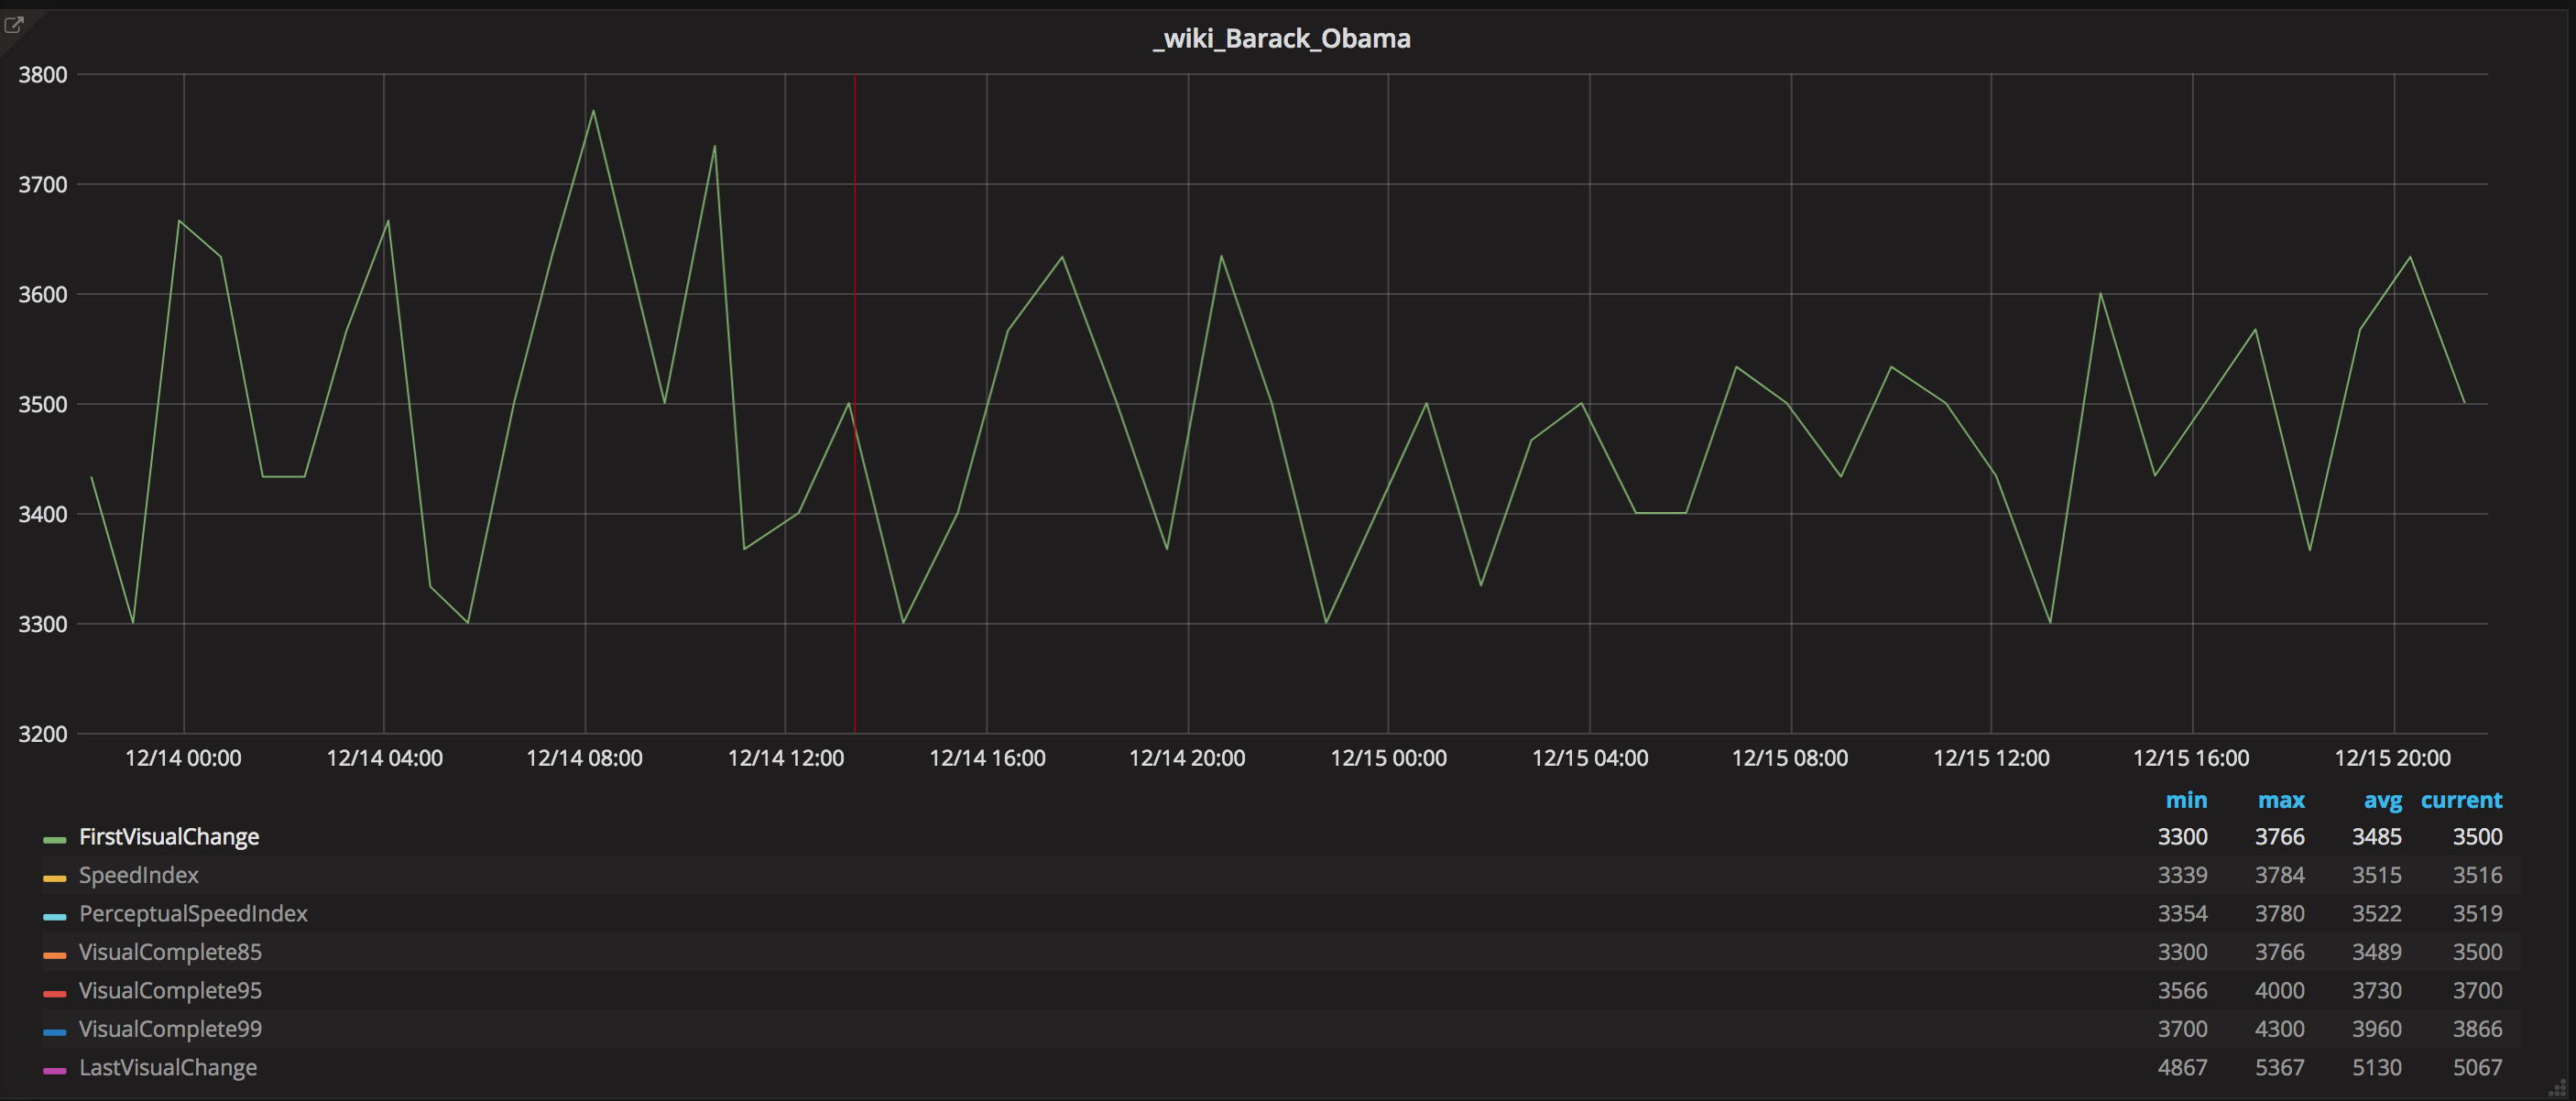
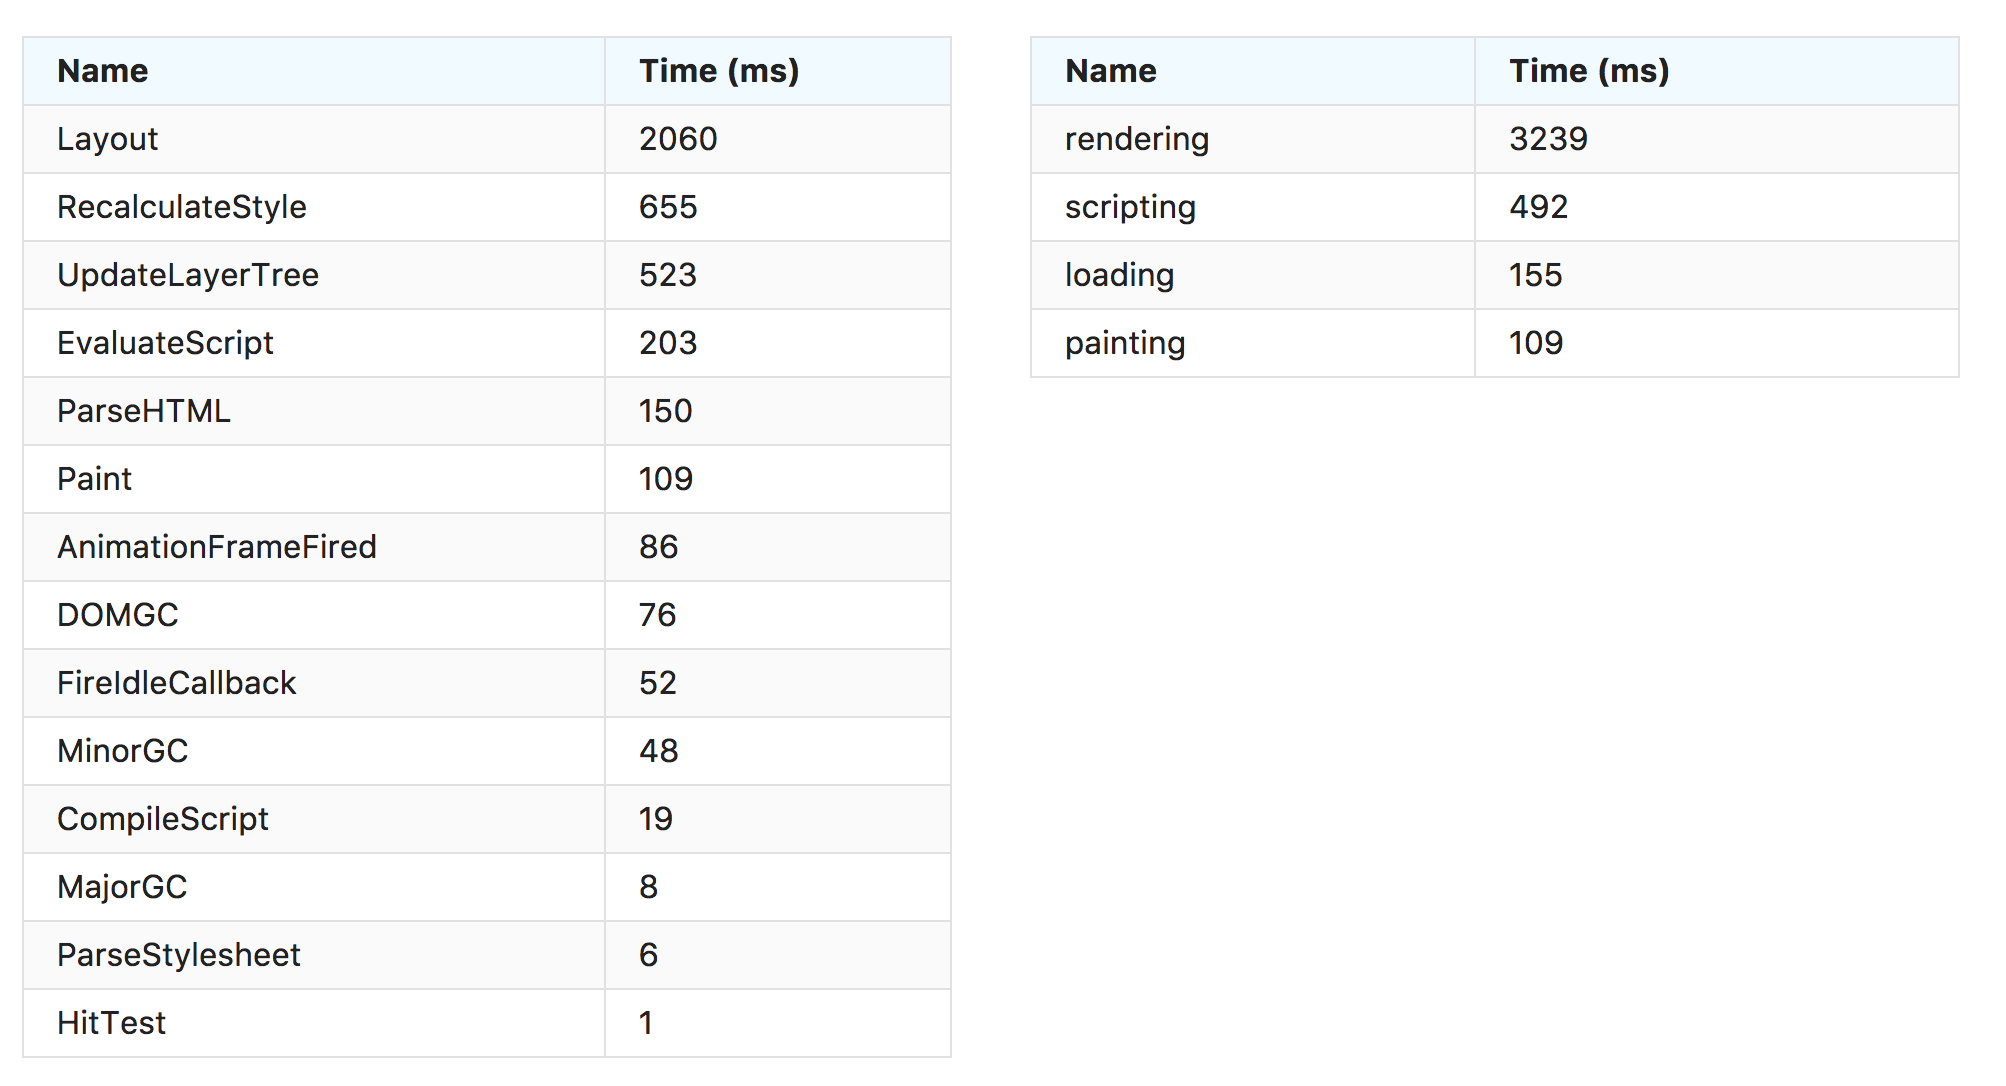
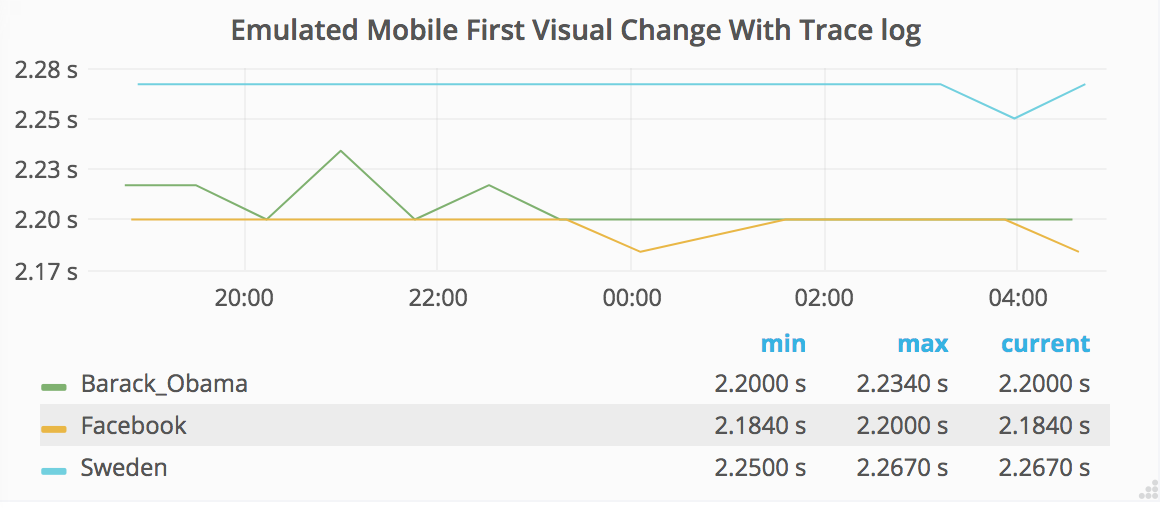
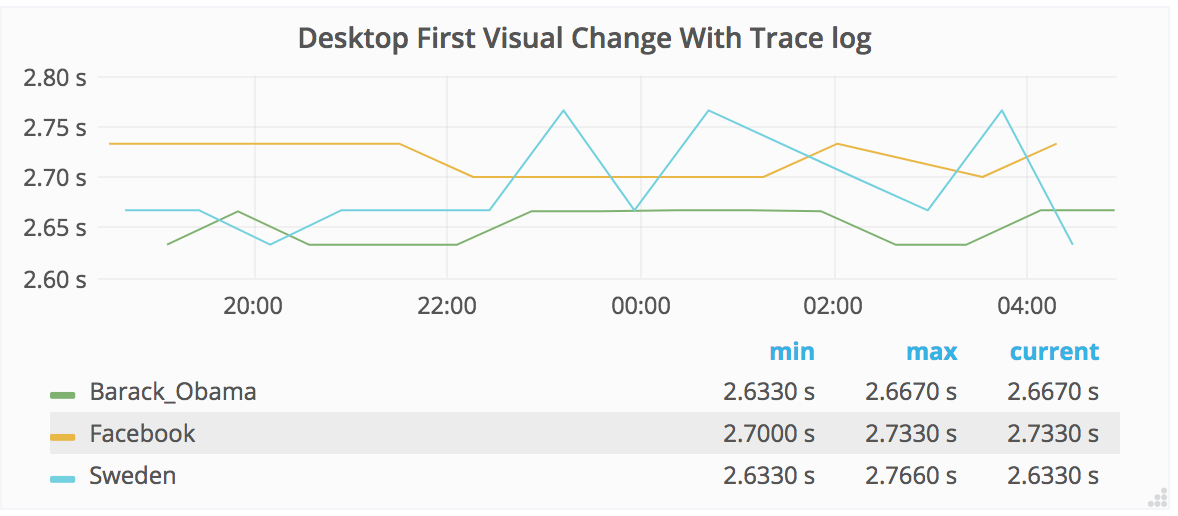
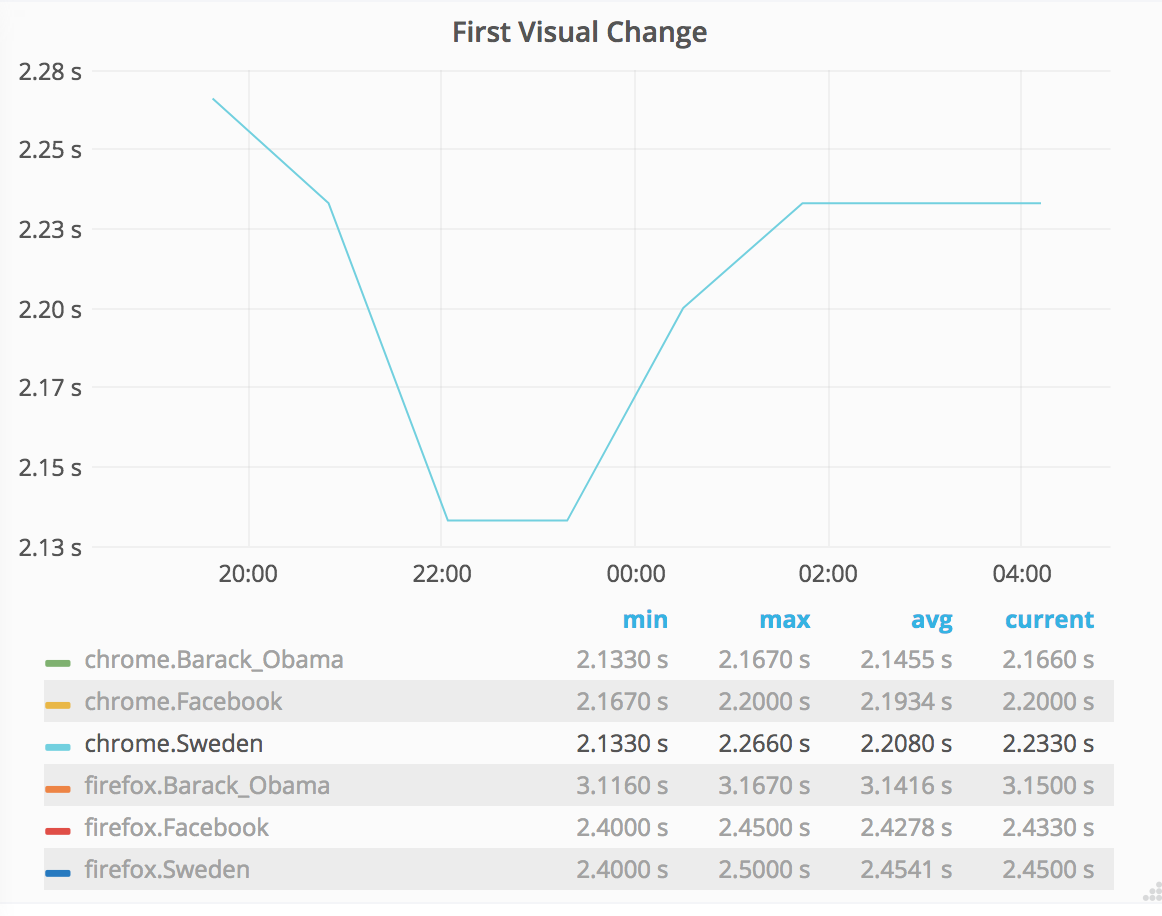
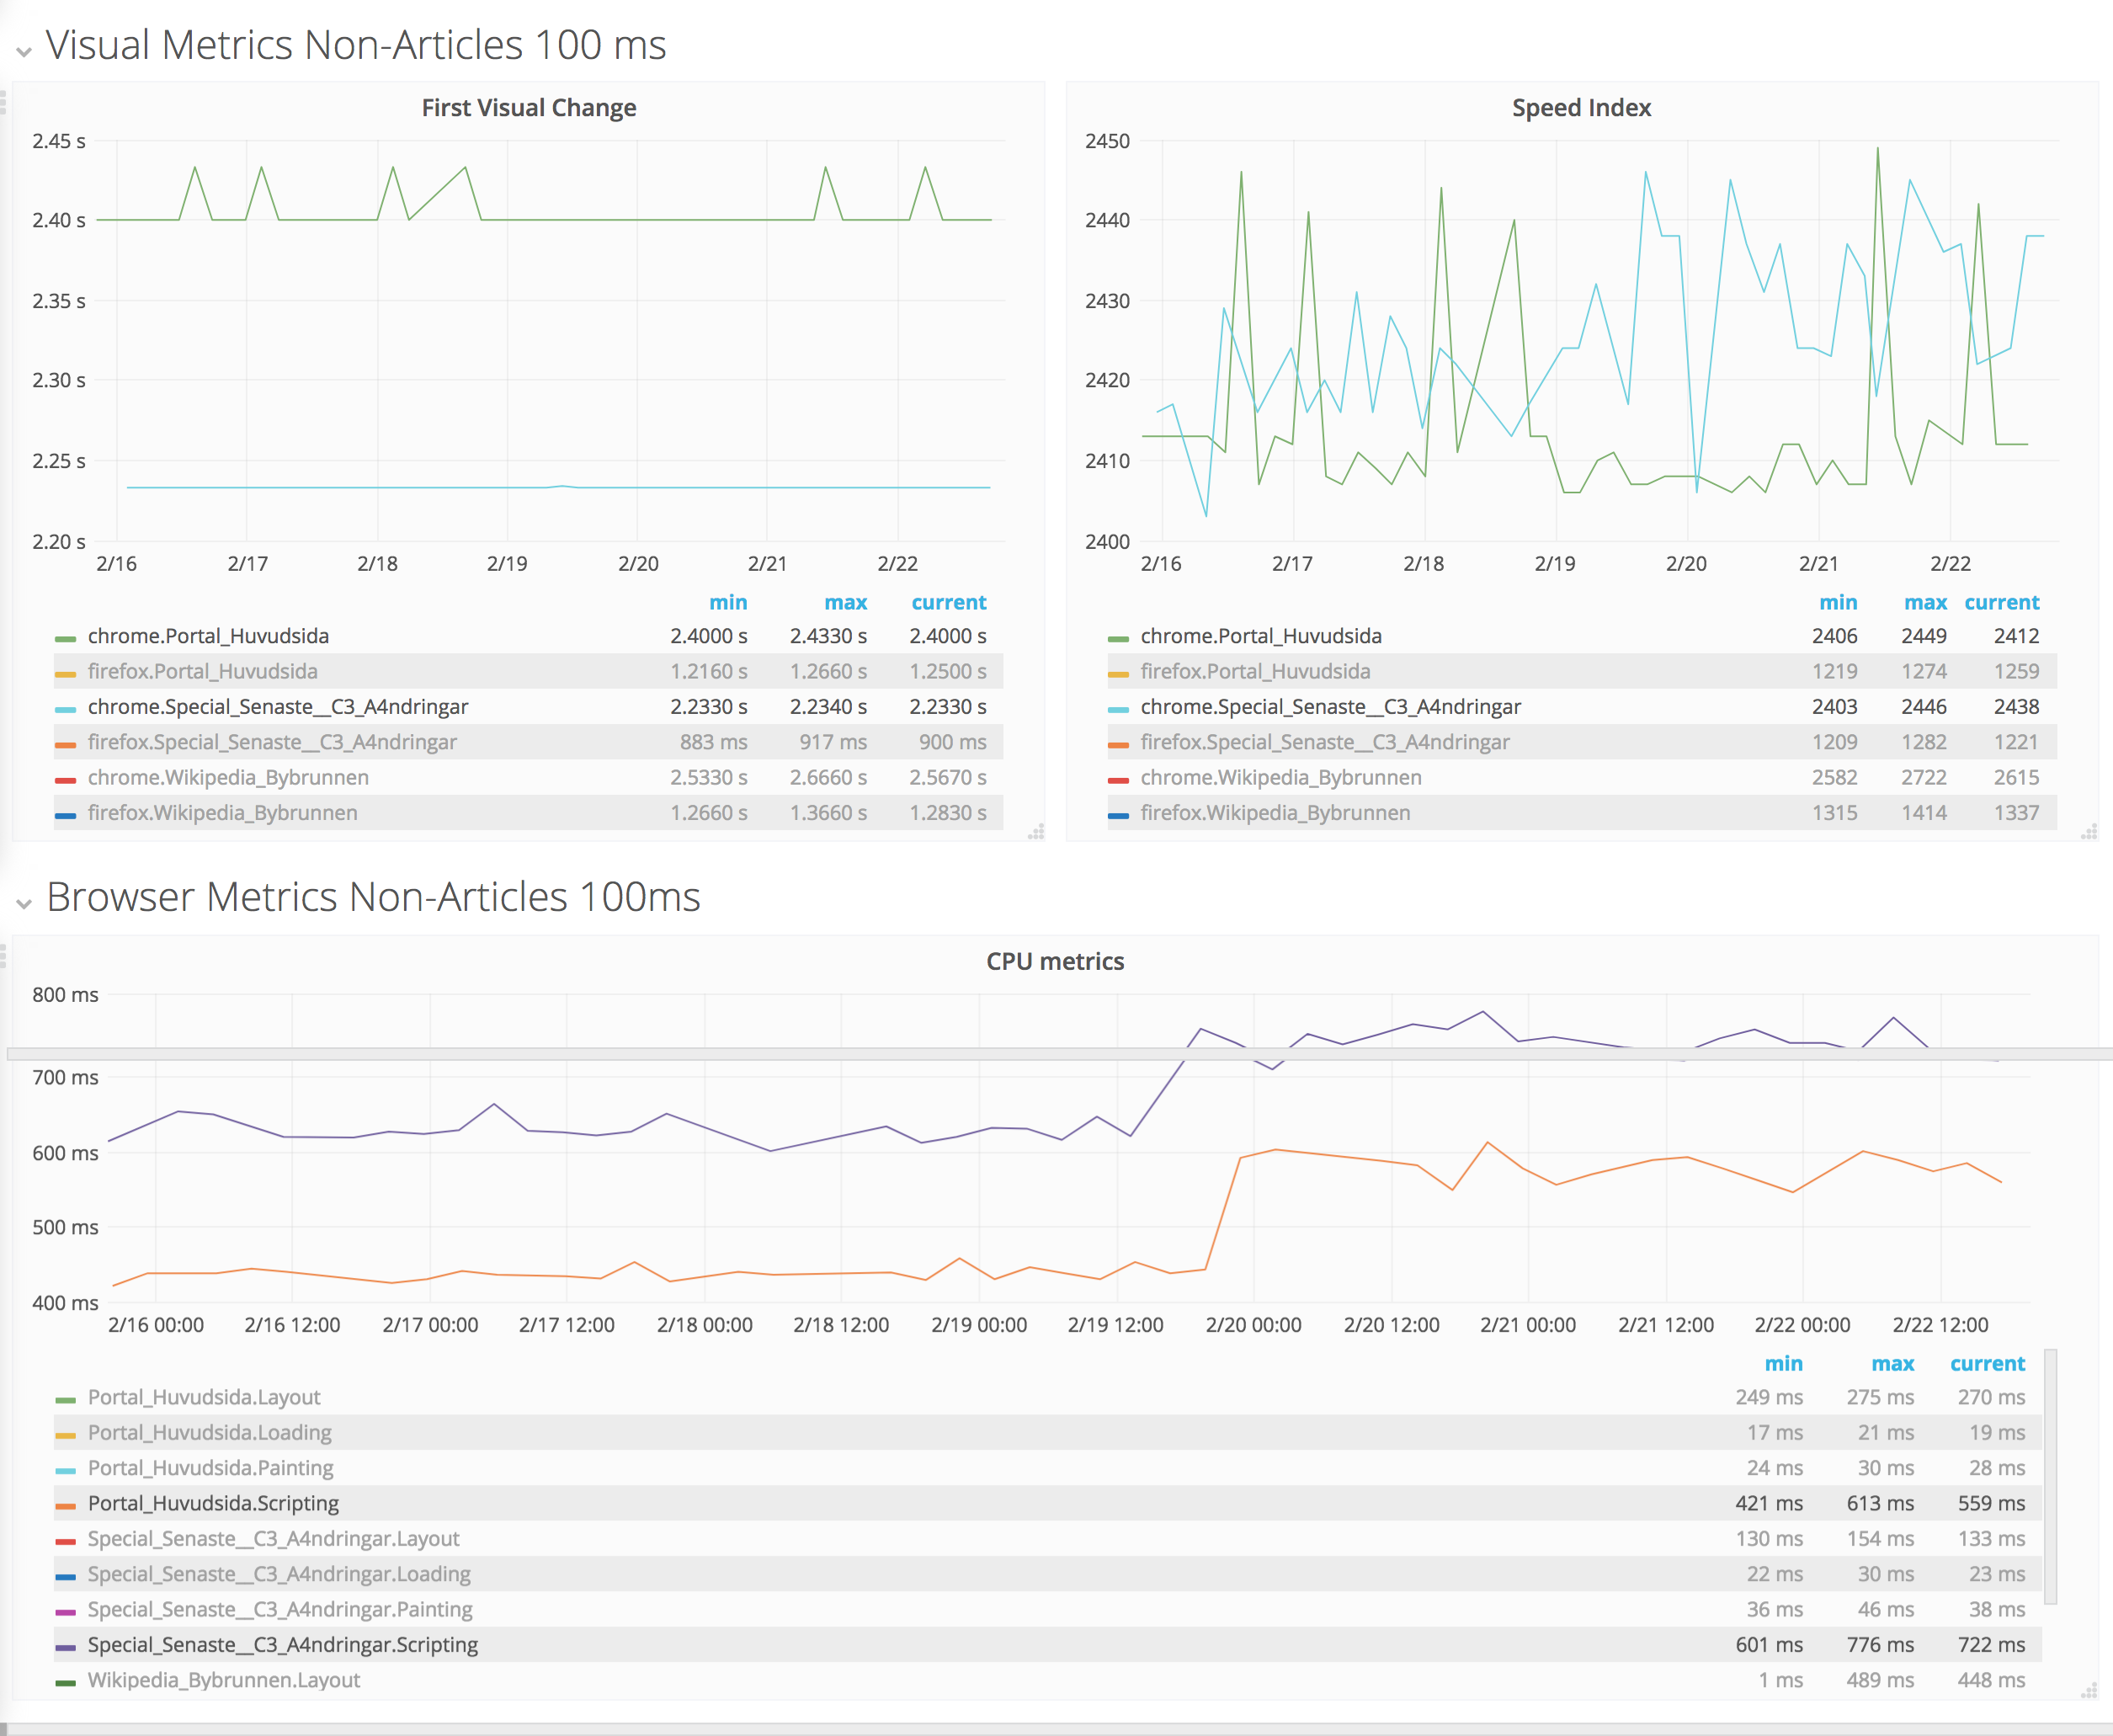
The new measurements for using WebPageReplay gives us stable first render and speed index. The next step is to use the Chrome trace log together with the devtools-timeline-model to get more insights of where the time is spent rendering the page.

This should be pretty straight forward: Enable chrome trace log in Browsertime and then parse it and send the important metrics to statsv. We can do it by doing a standalone cli built upon the devtools-timeline-model.

Event Timeline

I've tested turning on the Chrome trace log on one instance on AWS (c4.large) running with WebPageReplay and the instance is too small:

Screen Shot 2017-12-15 at 21.53.13.png (1×2 px, 364 KB)

We are not close to the same stability in first visual change that we usually have. I'lll turn it off for now and check that the metrics looks like it should and then I'll make a quick try on a larger instance to check if it looks better.

Ahh I went through the configuration and see that I was running a larger viewport than we do default. Firefox handles that good but not Chrome on AWS. Let me change that and rerun.

The setup I was testing was using 1920x1080, default we use 1200x960 for WebPageReplay (and on WebPageTest we use 1024x768).

It doesn't seems it matter so much with that smaller screen with the log turned on, the diff is still 300 ms:

Screen Shot 2017-12-19 at 11.37.18 AM.png (988×2 px, 210 KB)

I turned off the log now to make sure the metrics stability goes back to normal.

Turning off the trace log got us back to those great values again 33 ms diff instead off 300 ms.

Screen Shot 2017-12-19 at 9.26.34 PM.png (994×2 px, 239 KB)

Next step will be to try it out on a larger instance.

I've started this today by deploying to a c4.xlarge machine and pushing to Graphite with the trace log turned out ok. I also started to try out https://github.com/paulirish/devtools-timeline-model to parse the log.

If the metrics seems stable, I'll make a wrapper for devtools-timeline-model that just pushes some of the metrics to Graphite too, so we can see that they are stable too.

If they firstVisualChange/SpeedIndex isn't stable, I'll try one instance larger.

instanceCPU memory
c4.large23.75
c4.xlarge47.5
c4.2xlarge815

It do not look good on c4.xlarge either (300 ms diff):

Screen Shot 2018-01-08 at 8.42.53 PM.png (522×2 px, 152 KB)

Asked a friend and he pointed out that maybe we could slimline the config which tracelogs we get, and I think he could be right, let me try out tomorrow and see if there are some we can remove and still get the metrics we need. The default one we use today:
https://github.com/sitespeedio/browsertime/blob/master/lib/core/webdriver/chrome.js#L45

Ok, I think we only needs to enable devtools.timeline category, then we can generate the following:

Screen Shot 2018-01-09 at 9.21.09 AM.png (1×2 px, 170 KB)

That will at least give us some better metrics. When I tested the log is at least 10 times smaller so hopefully it will not affect the performance as much. The drawback is that if you drag and drop the json to Chrome devtools the data is really limited.

I'll try it out now on our current instance size (c4.large).

I got this up and running on a new instance, will update the dashboard asap we got the metrics. If it works, I'll add so we send rendering/scripting etc and see how stable they are.

The numbers looks better, specially on mobile. That should mean if we do it one instance larger, the numbers will look good on desktop too. I'll let it run like this today just to be 100% sure and then update to a larger instance + make a wrapper for devtools timeline and collect median/min/max, that should be doable tomorrow, so we have something with real numbers running till next week, so we can discuss how we can act on it.

We had it running for a while now and it surely looks better. It's been running on a c4.large (same size as the other tests). We had one bug that I haven't looked into yet. It made us report 0 values (bad), I think the origin of the problem is from the Chromedriver when we get the trace log. The behavior changed a couple of versions ago (2.30) and the hack to fix it was to get the log two times. I'll look into it later this week.

Mobile:

Screen Shot 2018-01-10 at 5.54.18 AM.png (510×1 px, 78 KB)

Desktop:

Screen Shot 2018-01-10 at 5.54.26 AM.png (516×1 px, 90 KB)

You can see that the numbers for Sweden isn't as good as the other ones but it seems we had some kind of change going on there because we have the same numbers on the other machine:

Screen Shot 2018-01-10 at 5.54.53 AM.png (916×1 px, 129 KB)

Next step for me is to look into the bug and start sending the new metrics to Graphite.

This is now running on the WebPageReplay machine. I've mocked a new Docker container including the devtools-timeline lib and then cherry pick the metrics. The metrics will be available if you scroll down on https://grafana.wikimedia.org/dashboard/db/webpagereplay

Had some problems with deploys/configurations and now everything looks ok. I'm gonna let it run to tomorrow and then if everything is fine (stable metrics) I'll add another batch of desktop runs with latency 50 ms (today we run 100) so it makes it easier for us to verify changes (and the waterfall will have the same behavior as the runs we do on WPT (now the first visual change happens lateish)).

There seems to be a upstream bug in the lib I'm using: The scripting time is always smaller than if I drag and drop the same trace file to Chrome (https://github.com/paulirish/devtools-timeline-model/issues/29).

Pushed 50 ms latency night and added graphs for them now. We had two problems with the timeline metrics on 50 ms (they seems to be too low). Let us run this during the weekend and see if it happens again. We should add so we dump the data to S3 (right now we delete all data for the runs). We could keep it just one week or something like that, so it's easy to verify the result and debug if we have a problem. I'll create another issue for that and we can discuss it on Monday.

I think we are good to go here. I've created an upstream bug in Chromedriver about the case when the metrics fails. Else we get metrics, we send them to graphite and I don't think we need to one step deeper. This fine for running tests on commits etc in the future.

This is a good example from our testing on the Swedish wikipedia where we cannot see changes in first visual change/speed index but a real rise in time spent in scripting:

scripting-time.png (2×2 px, 638 KB)