Page MenuHomePhabricator

High database error rates on s2 and s3
Closed, ResolvedPublic

Description

(High here means we-should-investigate-high, not things-are-critically-broken-high)

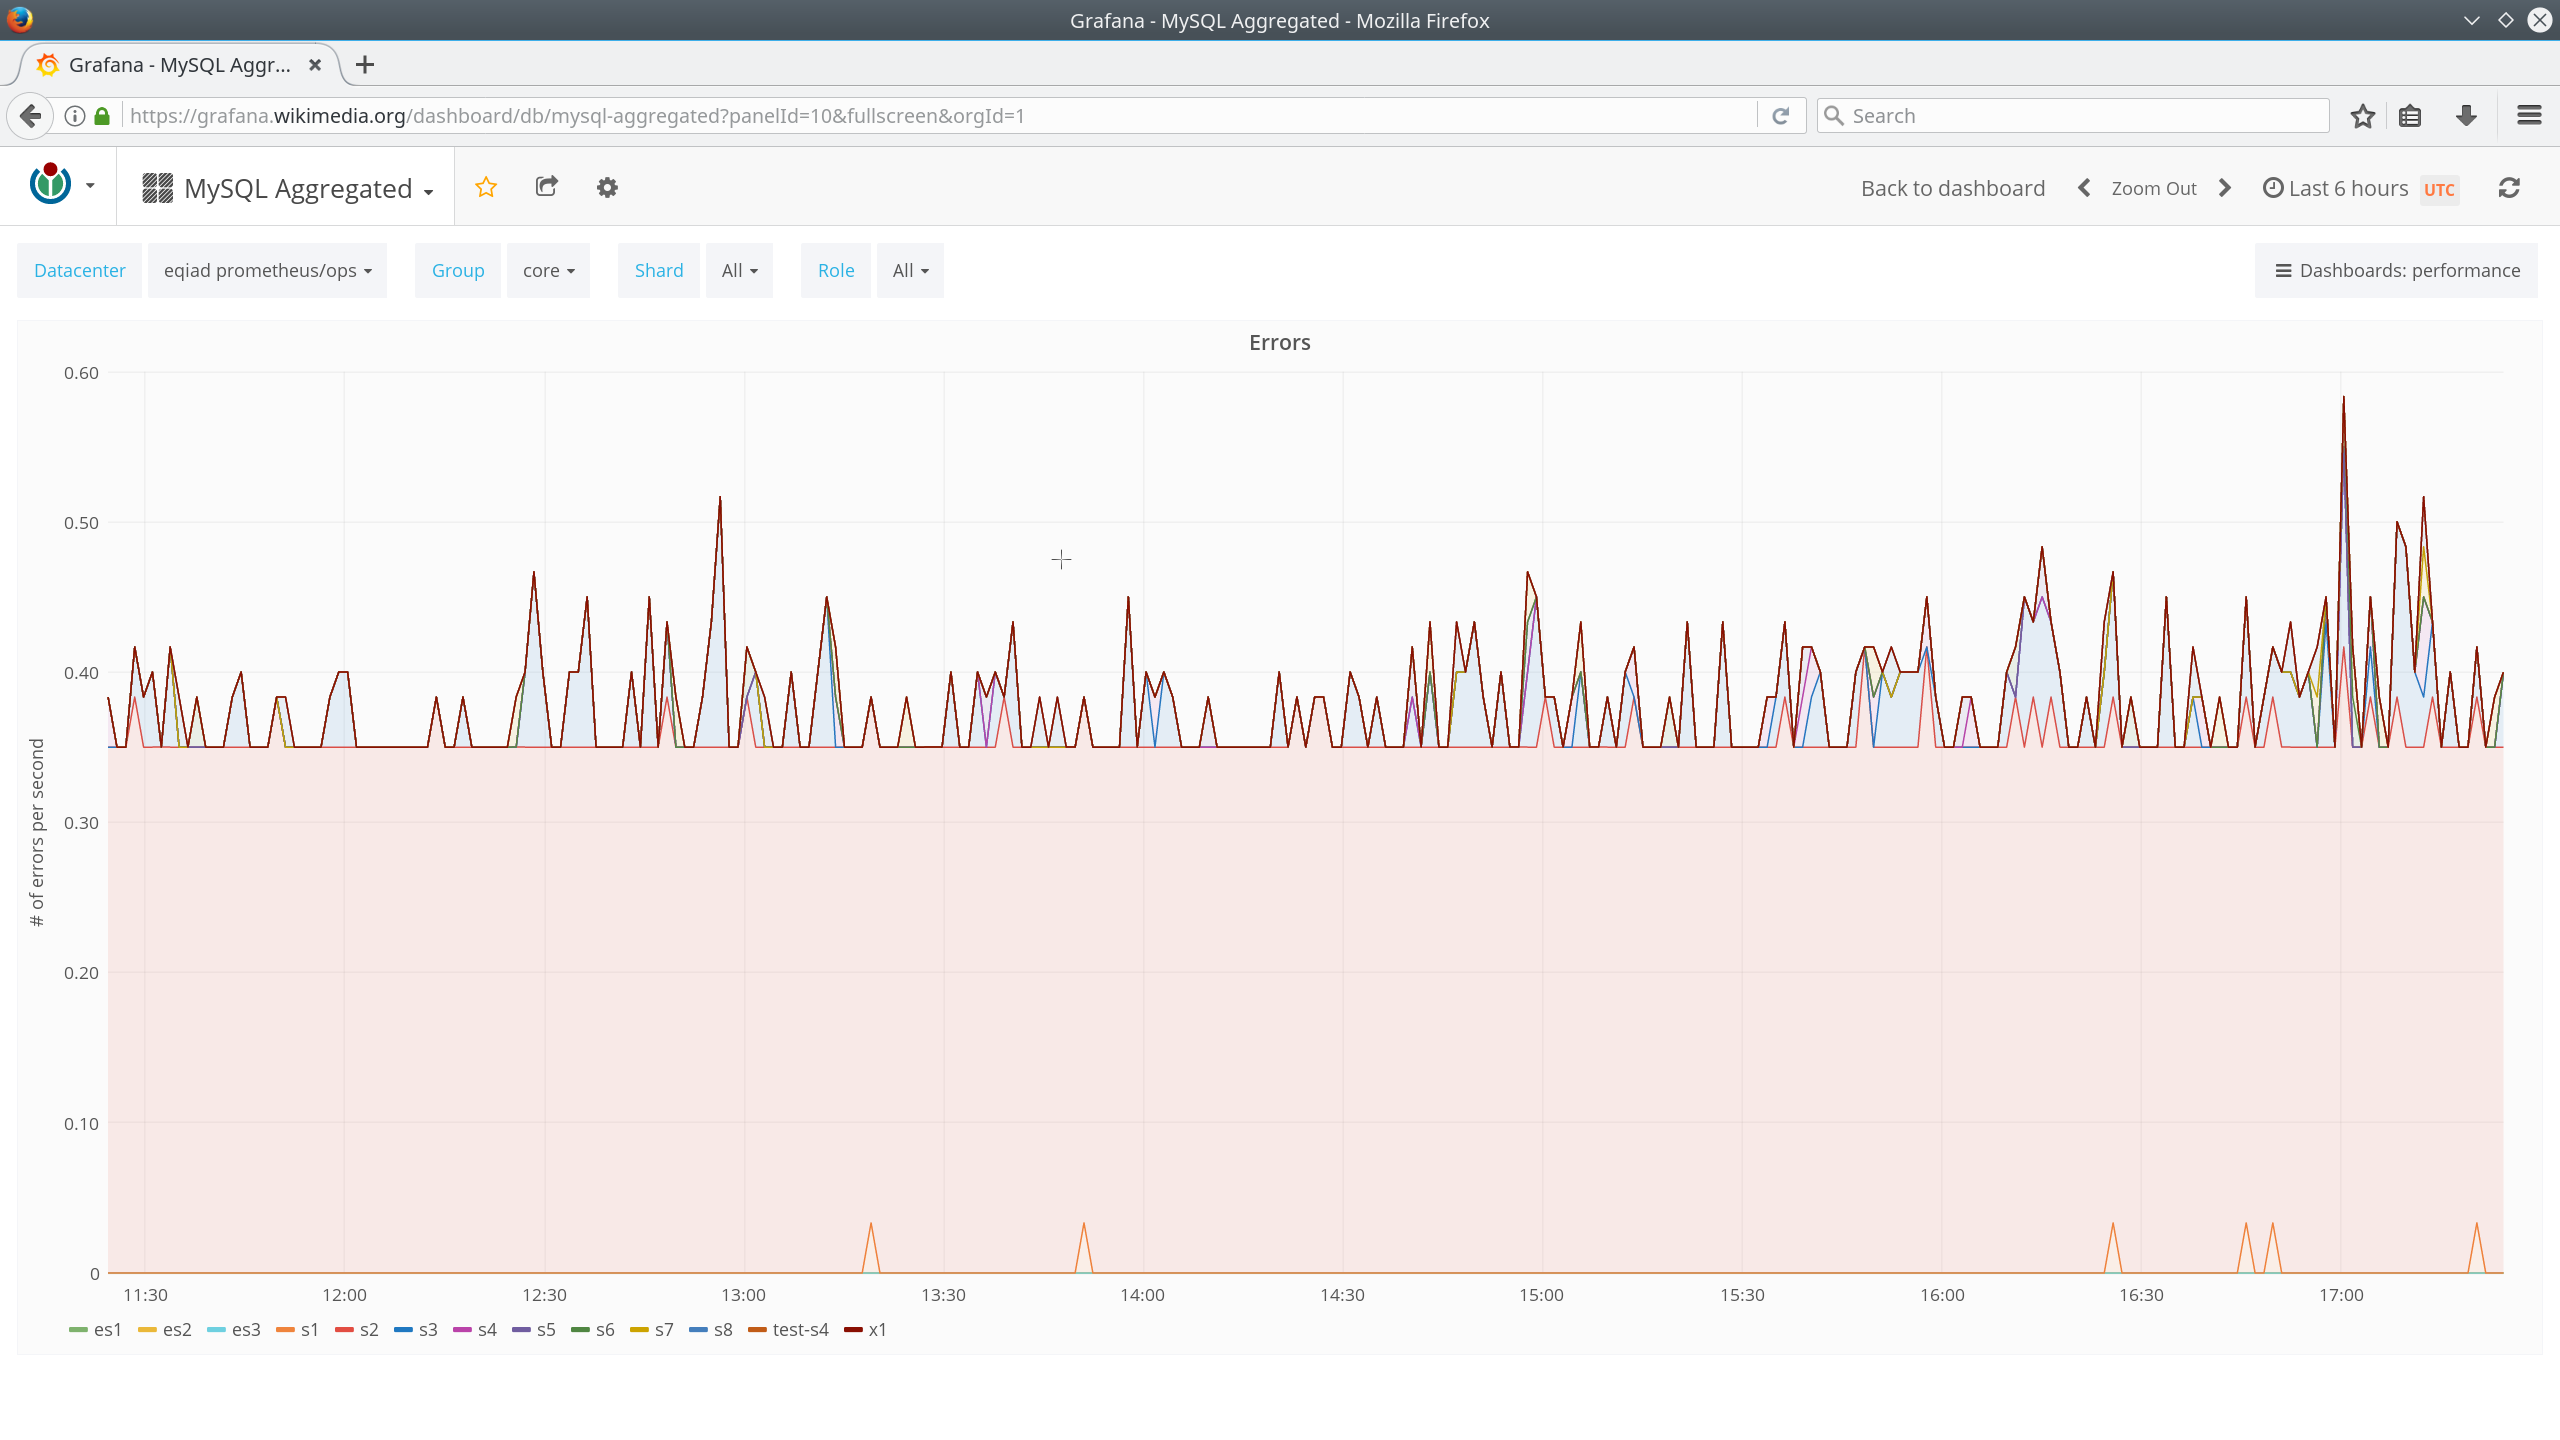
s2 is showing high error rate on prometheus:

Screenshot_20180124_093450.png (1×2 px, 192 KB)

s3 is showing high error connection rate (on db1077, but specially db1078) coming mostly from the job queue:

https://logstash.wikimedia.org/goto/59e95d9d4db3bdd222658e2f08306efd

The real issue, if any, is not yet clear for both cases. It could be some bad permissions, it could be low connection time at PHP side (in which case it should probably be mitigated, and not get its timeout increased); it could be connection overload; it could be some other kind of error).

Event Timeline

The biggest offender is one of the new jobrunners, so while I'd tend to think it has to do with connection overload, but I think this merits a better investigation for sure.

I am not sure I am understanding your comment, on that graph (and the one I posted) it is mostly 0 errors, no?

We followed up on IRC, but we identified this is a terbium process trying to connect to db1067 and not having the right grants. We are not even sure if that should be running, so we may look at what it is and what it is trying to do and either fix it or kill it.

So by doing a traffic capture, I have seen proxysql trying to connect from terbium to db1067 every 10 seconds, which matches what we saw on the logs:

libmariadb._pid.1572._client_version.2.3.1	_platform.x86_64.program_name.proxysql_monitor
16:33:29.362863 IP 10.64.32.13.57126 > 10.64.48.22.3306: Flags [F.], seq 201, ack 176, win 58, options [nop,nop,], length 0
jcrespo assigned this task to Marostegui.

Finally fixed, it was a badly configured proxysql (not on production).