Shows a big increase in traffic on the site, should look into it to see if we can learn anything useful about bots for our upcoming bot project.
Description
Description
Related Objects
Related Objects
Event Timeline
Comment Actions
Seems to mostly be caused by a sustained spike in desktop-only views to the Zimbabwe page. Strange.
Comment Actions
The Zimbabwe page shows an increase of 1000-2000 per day per
https://tools.wmflabs.org/pageviews/?project=en.wikivoyage.org&platform=all-access&agent=user&range=latest-20&pages=Zimbabwe - surely not enough to explain the >100k/day increase for the entire project?
Comment Actions
Oh, your right :) Maybe it's an example of something that's happening on a lot of pages though. The desktop vs. mobile percentage looks very suspicious (<1% mobile) and the increase seems to have started around the same time.
Comment Actions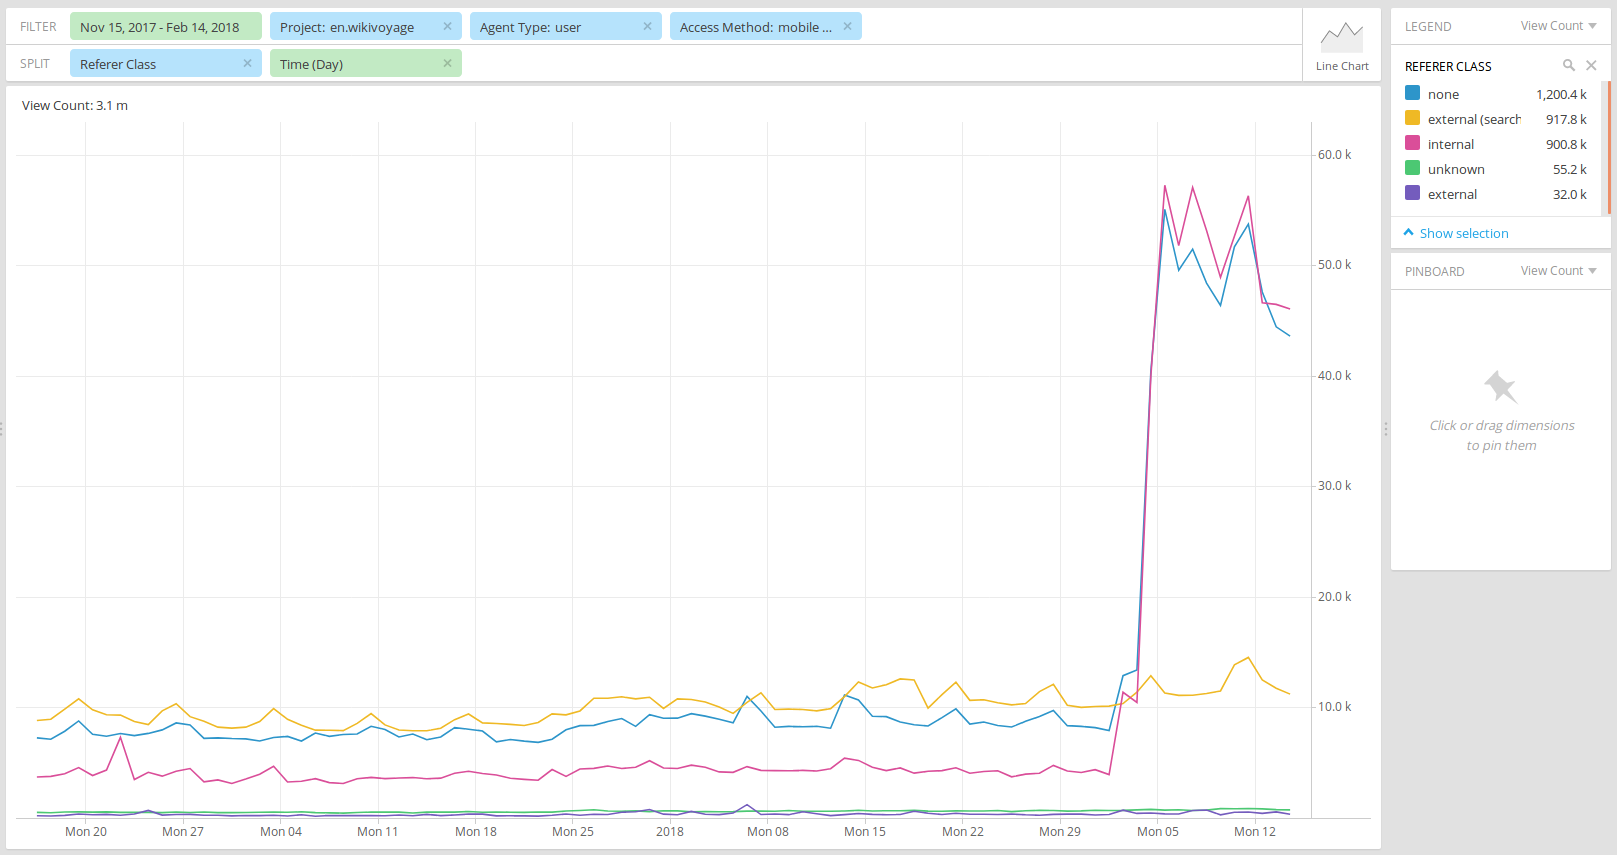
(chart for November 15-February 14, source: PIvot)
My guess, without having verified it in detail, would be that it has to do with the "Wikivoyage month" banner campaign. The timing of the rise in total pageviews (February 2-4) seems to coincide roughly with the activation of the banners. The landing page seems to be this one (for at least some of the banners), and indeed the rise in its pageviews appears to have caused most the project total rise in pageviews.
Out of curiosity I took a quick peek at various dimensions in Pivot. (BTW, we should write up some kind of playbook on efficient initial investigations of such pageview anomalies, as this kind of thing comes up fairly regularly - see e.g. T180621 for another recent example. I may take a stab at this at some point.) Don't have time right now for a more detailed writeup or further investigation, but here are the takeaways so far:
The rise has happened on both desktop and mobile web (it's actually a bit more pronounced on mobile web), and also across geographical regions (continents, countries), operating systems and browsers. That makes it extremely unlikely that we are dealing with a bot.
The only dimension along which the spike is unevenly distributed is referrer class: external referrers (from search engines or other sources) have not changed notably, the rise was concentrated in views with either no referrer or an internal referrer:
(chart for November 15-February 14, source: PIvot)
My guess, without having verified it in detail, would be that it has to do with the "Wikivoyage month" banner campaign. The timing of the rise in total pageviews (February 2-4) seems to coincide roughly with the activation of the banners. The landing page seems to be this one (for at least some of the banners), and indeed the rise in its pageviews appears to have caused most the project total rise in pageviews.
However, that still wouldn't quite explain the rise for the Zimbabwe page, unless it has been linked from some other banners that I didn't check.
Comment Actions
+1 that this doesn't look at all like a bot. @kaldari, any more thoughts? I'll just close this otherwise.
Comment Actions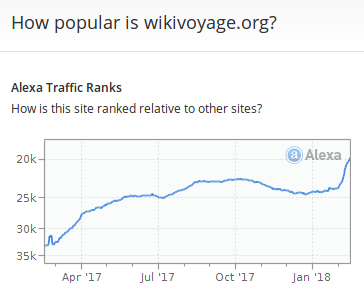
BTW, Alexa has noticed this too:
(and their "What percentage of visits to this site come from a search engine?" chart further down that page shows a corresponding drop)
Offtopic: While this is a short-term rise, both Alexa charts also indicate a longer-term positive trend year-over-year - as observed by @MaxSem today, it looks like Wikivoyage may be closing in on that other site...
Comment Actions
@Tbayer: Nice sleuthing! BTW, now that the WikiVoyage Edit-a-thon is over, the pageviews have gone back to normal.