Profile Information
Name : Sahil Khokhar
Email : sahilkhokhar505@gmail.com
Web Profile : http://sahilkhokhar.com/
Github Handle : sahil505
MediaWiki User Page : sahil505
Medium : sahilkhokhar505
IRC nick : sahil505
Location : New Delhi, India (UTC +5:30)
Typical working hours : 12:00 PM to 07:00 PM & 09:00 PM to 03:00 AM (UTC +5:30)
Synopsis
Wikistats is the public statistics website of the Wikimedia Foundation. Its main purpose is to add context and motivate our editor community by providing a set of metrics through which users can see the impact of their contributions in the projects they are a part of. Wikistats 2.0 is a recently released website, developed by the WMF's Analytics team, that will replace Wikistats in the near future. Wikistats 2.0 is intended to:
- Update the website's (Wikistats) interface.
- Provide access to data in an analytics-friendly form.
- Be easier to maintain and improve.
Wikistats 2.0 is currently in production but still in alpha stage. There are some improvements that need to be made in order to consider Wikistats 2.0 a full replacement of its predecessor (Wikistats). The objective of this GSoC project is to improve Wikistats 2.0 front-end, bringing it closer to a finalised product possibly Beta or RC 1.0. T189210 lists subtasks containing small improvements to be implemented. Some of these subtasks might change during the GSoC timeline but the main purpose and size of them will continue to be the same.
Mentor : @mforns
Benefits
- This project will take Wikistats 2.0 close to a finished product (maybe RC 1.0) meant to replace its predecessor (Wikistats).
- This project will make the frontend of Wikistats 2.0 more user friendly (aesthetically & functionally).
- It will fix some of the minor and major bugs in the Wikistats 2.0 interface which includes some of the markup issues and UI features that misleads a user.
- This project will add some new features to the interface of Wikistats 2.0 that can represent the information in a better way than the current Wikistats 2.0.
Subtask Breakdown
Few of the already listed subtasks and mostly all the new improvements (to be added) for this project will be completed following Object Oriented Analysis and Design principles, broadly in these four stages:
- Analysis & Design
- Implementation
- Testing
- Deployment
Testing stage can be carried out using Exploration testing as it leads to an optimized final unit/feature which is best for many frontend projects. Since this project only adds small features to various parts of Wikistats 2.0 software therefore testing methods such as Jasmine TDD or Sanity & Regression testing doesn’t make much sense. For features/sub-tasks (can be a newly added improvement) that involve data transformation, or complex functionality like the router unit tests can be written as in here.
Completion of every newly added improvement will be followed by its documentation which will contain the design mockups, explanation of the implementation approach & testing process.
Goal will be to keep an optimized balance between documentation/reports and actual feature implementation & testing, spending too much or too less time on any one can be unhealthy for the project.
New Improvements
These improvements are tentative and these might end up changing during the course of GSoC timeline.
- Improve hover background focus color for ‘All wikis’ & ‘Explore Topics’ dropdown (or any other dropdown) and add a horizontal line separator between each dropdown value for ‘All wikis’ & ‘Explore Topics’. Currently, the pinkish background focus color adds a distinguishing touch to two values. Best would be to add a slightly dark grey background focus color and add a horizontal line separator. Example :
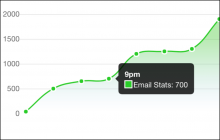
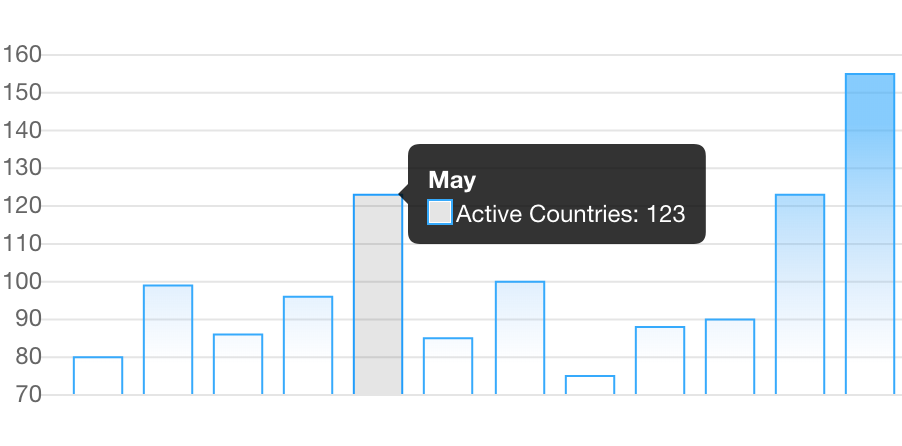
- Display a legend (with the Y axis value) on hover for bar graph in Contributing → New registered users/New pages (or any other bar graph in Wikistats 2.0). Example :

- Improve the solid filled colors in the bar graph. Give them a gradient color look to make them easy to look at. Current color choices blinds you out at times. Might have to think more on what to do if we increase the range which makes the graph more dense. For example refer the above image for gradient color.
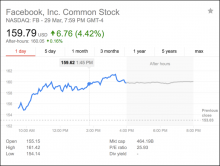
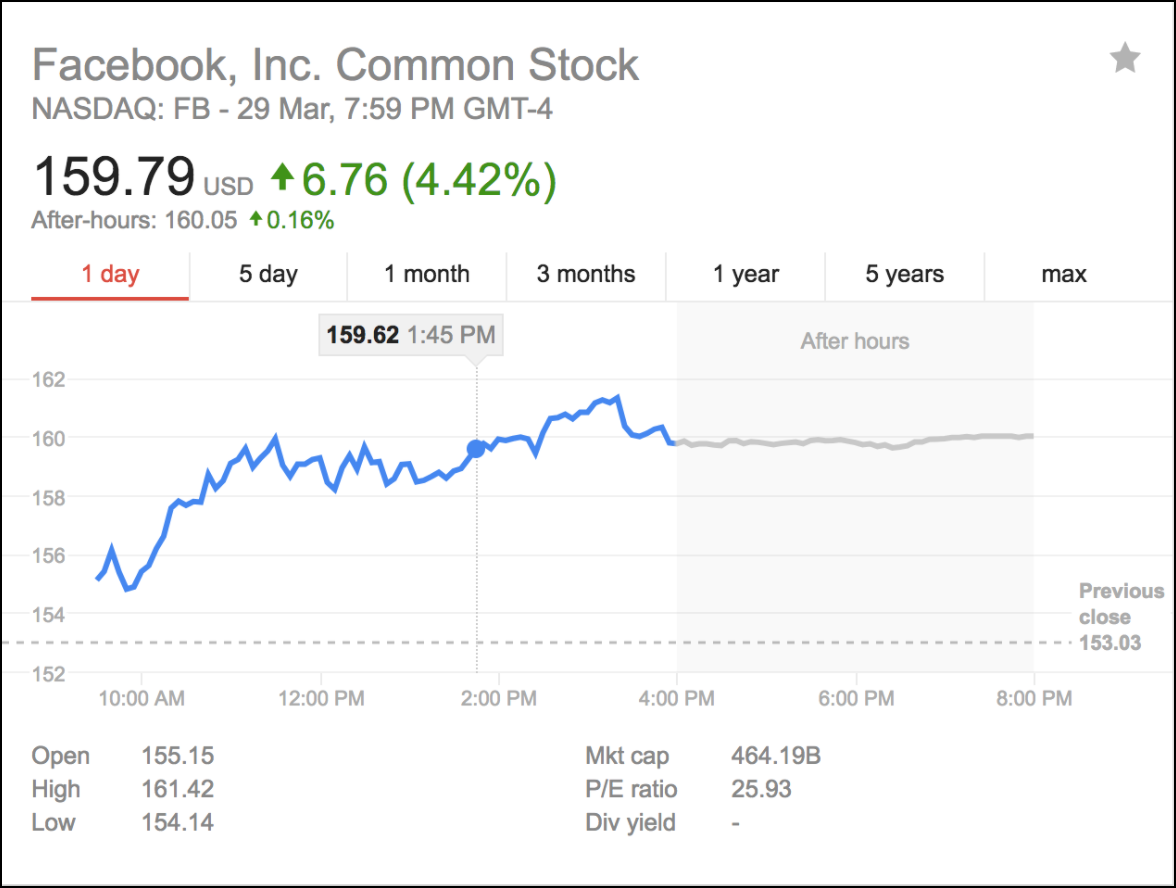
- Make position of the popup-legend dynamic (this has already been included in the subtasks, discussing the implementation here). For line charts as seen here, popup-legend can be made to follow the cursor with its position fixed on the top of the line chart. This implementation can be very effective and efficient in terms of space occupancy and ease of use to the user. Best example of this can be seen when you do a Google search of any Multinational Company’s stock prices, for example a screenshot of facebook inc attached: Google’s implementation of this is very smooth and efficient, wish to achieve the same for Wikistats 2.0 line charts. Apart from hover popup-legend, a lot of other motivation can be taken from this example, one other being the positioning of the time range etc.
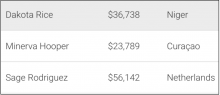
- Add search, sort-by & show ‘x’ entries functionality to data tables, for example : the table implemented here can have a search input on top (to allow user to search for a particular country or any particular field value) and a dropdown to sort data from increasing to decreasing (views, etc) or vice-versa, this can also be implemented by giving an dynamic arrow along side ‘views’ heading so that when a user clicks on it the order toggles. Examples :
 Name would be replaced by anything that needs to sorted.
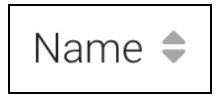
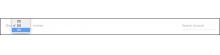
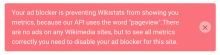
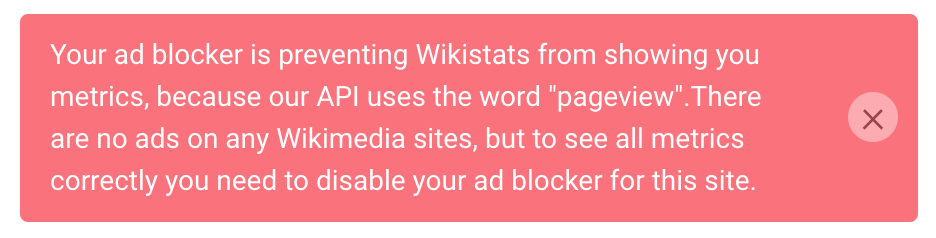
- Show the alert message regarding ad blocker in a better way. As soon as a user lands on the page, an alert (notification) legend (as shown in the attached image) fades in from top. It will not cover the entire width of the page but just 1/4th of it. The slight UI problem with current one is that there is a lot of unused space in the red ad-blocker div.
- Improve overall color schema of line charts and in place of guideline show a small legend on hover. This improvement will make line graphs easy to grasp, as the lines would be made of just a single color with a contrast color given to corner points and area under the graph colored, the color will fade off as you move towards the x-axis. This improvement will resolve combined T183184 & T187429. Example :
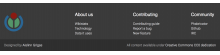
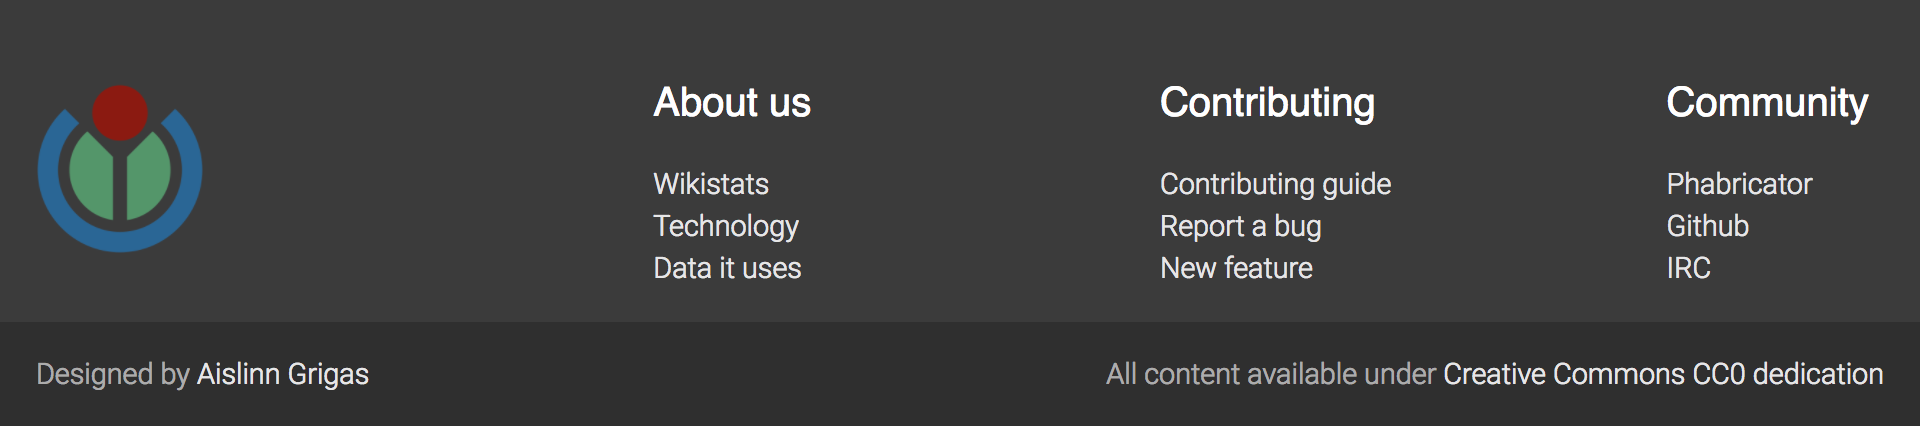
- Currently Wikistats 2.0 footer design seems outdated and it also contains lines/text which are redundant such as "Follow this link to report a bug" which can possibly be replaced with "Report a bug" hyperlink. Space in footer can also be optimised by adding/rearranging content. We can also consider improving the overall interface of the footer.


Timeline
A weekly report/blog will be published at the end of every week starting from the community bonding period.
- [TD 1] Explore Subtasks : Explore all the subtasks listed here. Conduct a premature analysis and prepare design mockups for each subtask. Explore Wikistats 2.0 and suggest other improvements and add these to the subtasks list.
- [TD 2] Student Projects Announced : Google announces accepted student proposals.
- [TD 3] Community Bonding : Improvise and finalize the premature analysis and prepare final design mockups. Continue exploring Wikistats 2.0 for new suggestions and improvements. Start interacting with the Wikistats 2.0 team for inputs on analysis, design and newly suggested changes.
- [TD 4] First Coding Period :
- [TD 5] First Evaluation : Submit first evaluation.
- [TD 6] Second Coding Period :
- [TD 6.1] : Work on T189619.
- [TD 6.2] : Continue work on T189619 + Work on T197103 + T196982.
- [TD 6.3] : Work on T197482 + T198183 + T198168 + T198122 + Discuss the new improvements with @mforns and WMF Analytics community.
- [TD 6.4] : Buffer + Work on T198510 + T198630 + Discuss the new improvements with @mforns and WMF Analytics community.
- [TD 7] Second Evaluation : Submit second evaluation.
- [TD 8] Final Coding Period :
- [TD 9] Buffer : Resolve bugs and backlog (if any).
- [TD 10] Submit Code + Final Evaluation : Submit final code along with the complete documentation and submit my final evaluation.
- [TD 11] Mentors Submit Final Evaluations : Document future improvements to Wikistats 2.0 + Achievements of this project.
| Period | Task |
|---|---|
| Date.now() - April 22 | [TD1] Explore Subtasks |
| April 23 | [TD2] Student Projects Announced |
| April 24 - May 14 | [TD3] Community Bonding |
| May 14 - May 21 | [TD4] First Coding Period → [TD4.1] |
| May 22 - May 29 | [TD4] First Coding Period → [TD4.2] |
| May 30 - June 05 | [TD4] First Coding Period → [TD4.3] |
| June 06 - June 15 | [TD4] First Coding Period → [TD4.4] |
| June 11 - June 15 | [TD5] First Evaluation |
| June 15 - June 22 | [TD6] Second Coding Period → [TD6.1] |
| June 23 - June 30 | [TD6] Second Coding Period → [TD6.2] |
| July 01 - July 07 | [TD6] Second Coding Period → [TD6.3] |
| July 08 - July 13 | [TD6] Second Coding Period → [TD6.4] |
| July 09 - July 13 | [TD7] Second Evaluation |
| July 13 - July 18 | [TD8] Final Coding Period → [TD8.1] |
| July 19 - July 25 | [TD8] Final Coding Period → [TD8.2] |
| July 26 - August 01 | [TD8] Final Coding Period → [TD8.3] |
| August 02 - August 06 | [TD9] Buffer |
| August 06 - August 14 | [TD10] Submit Code + Final Evaluation |
| August 14 - August 21 | [TD11] Mentors Submit Final Evaluations |
| August 22 | Results Announced |
Deliverables
- T192407 T182109 T187429 T191672 T185533 T196983
- Stage 1 [OOAD] : Design and Analyse new improvements for Wikistats 2.0.
- Three published reports/blogs.
Phase I evaluation
- T189619 T197103 T196982 T197482 T198183 T198168 T198122 T198510 T198630
- Finalized new improvement tasks.
- Three published reports/blogs.
Phase II evaluation
- T192416 T183184 T198867
- Stage 2 to 4 [OOAD] : Implement, test and deploy new improvements.
- Three published reports/blogs.
Final evaluation
- Future improvement to Wikistats 2.0 documentation.
- Final GSoC project report/blog.
Results Announced
Note → Some of the above subtasks might change during the GSoC timeline but the main purpose and size of them will continue to be the same.
Participation
- Use Gerrit to create changes for each of the sub-tasks individually and submit the code for review.
- Will stay in regular touch with @mforns over Hangouts and IRC (#wikimedia-analytics) for any required guidance and updates. Will try to keep our conversations and discussion as public as possible over Phabricator (in comments).
- Will share my progress and useful information on Phabricator subtasks in comments.
- Weekly reports will be published on my meta wiki user page and regular blogs regarding my progress and learning from the project on Medium.
- Will be available on Zulip, Email, Phabricator & IRC in working hours and on Email in non-working hours.
About Me
Currently a Junior at the Indian Institute of Technology Delhi (IIT Delhi) where I’m learning how to produce & manufacture products from scratch & deal with the management challenges related to production. My major is Production & Industrial Engineering. I’m a code fanatic and have been one since my freshman semester. Technology excites me in many ways. I love developing softwares & applications that create an impact and are built for people. I have a strong passion for open source projects and have developed various software applications on campus in collaboration with my friends and professors. I strongly believe in the fact that no matter what you are creating or working on there is always a scope of improvement.
I heard about Google Summer of Code from Google’s open source blog, which I follow frequently. I won’t be having any other commitments besides GSoC this coming summer, therefore I would be very comfortable working around 40 to 50 hours a week. As far as this project is concerned I’m really excited to see the efforts of the analytics team in upgrading Wikistats to Wikistats 2.0 and I would be extremely honored to see it through to the end with significant contributions that can make Wikistats 2.0 a finished product.
Past Experience
Developed a Sales Rep Tracking Software during my freshman summer internship (June - July, 2016) at Groupon South Africa to monitor sales team whereabouts (location & time) and fuel spend when out selling. Used Object Oriented Analysis and Design (OOAD) for modelling along with AngularJS to layout the structural framework and Jasmine for Test Driven Development. This was my first time working in a proper development workflow so learnt a lot about different development cycles and how to model and analyse your ideas before beginning to code.
Led a team of 6 developers to develop the website and application for IIT Delhi’s cultural festival, Rendezvous. This was my first experience with a CRUD based application. Used AWS, Node.js, Vue.js, DynamoDB, and PHP to develop a robust and scalable platform that handled a traffic to 10k DAUs.
Have developed various students oriented web-portals for IIT Delhi such as Substance Abuse Helpline Portal and the Academics website of IIT Delhi using Kerberos based authentication and authorization using IIT Delhi LDAP Server and OAuth 2 Server.
Also, I regularly participate in various campus wide hackathons (Microsoft - Code.fun.do, IBM etc.). One thing that I love the most about these hackathons is the collaboration and the team effort required to develop a MVP within 24 hours.
Tasks Completed
- T188221 : Cargo API should display error if field alias starts with "_" : Code Review
- T188208 : Fixed the adblocker alert message overflow for smaller screens : Code Review
- T187427 : Changed '--' to 'Unknown' in Wikistats page views by country table view : Code Review
- T191121 : Solved overlapping issue in the Page Views By Country metric on Dashboard : Code Review
- T188268 : Corrected kebab case - key name mismatch of metrics in topic selector : Code Review
- T191567 : Updated Readme & corrected syntax errors : Code Review
- T192028 : Changed 'NaN' and 'Infinite' to an appropriate message in metrics % change over the selected time range : Code Review
- T192407 : Hide "Load more rows..." once max data is visible in Table Chart : Code Review
- T182109 : Added a friendly metric description to the tooltip of metric link : Code Review
- T187429 : Corrected y-axis labels to one decimal place to avoid similar labels : Code Review
- T191672 : Upgraded Wikistats 2.0 footer UI/design : Code Review
- T185533 : Fixed accessibility/markup issues of Wikistats 2.0 : Code Review
- T197482 : Resolved shortcut icon display : Code Review
- T198122 : Corrected spelling mistakes in description meta tag : Code Review
- T198168 : Corrected order of metric types on Dashboard navbar : Code Review
- T196983 : Corrected Dashboard Metric value CSS : Code Review
- T197103 : Corrected mixed case naming of metrics : Code Review
- T196982 : Improved UI for ‘All wikis’ & ‘Explore Topics’ dropdowns : Code Review
- T189619 : Added pagecounts metric : Code Review
- T198183 : Updated the functioning & styling of filter & split switches : Code Review
- T198510 : Corrected negative number abbreviation in chart axis : Code Review
- T183184 : Changed color shades for sections & charts : Code Review
- T198867 : Improved wikistats2 map zoom : Code Review
- T192416 : Made Bar-chart popup dynamic : Code Review
Tasks In-Progress
- T192416 : Improvements to Wikistats2 chart popups
Tasks Paused
- T190915 : Improve scoping of CSS
- T198630 : Broken down data with different time ranges for each line (or column set) breaks the chart
Bugs Reported & Tasks Created
- T191121 : Page views and Country name table columns overlapping in the Page Views By Country metric on Dashboard.
- T191567 : Updating Wikistats 2.0 Readme
- T191672 : Upgrading Wikistats 2.0 footer UI/design
- T192028 : Change 'NaN' to something more helpful in metrics % change over the selected time range
- T192407 : Hide "Load more rows..." once all the data is visible in Table Chart
- T196983 : Correct Metric value CSS on Dashboard
- T197103 : Correct mixed case naming of metrics WIkistats 2.0
- T196982 : Improve UI for ‘All wikis’ & ‘Explore Topics’ dropdown
- T197482 : Shortcut icon is not showing
- T198122 : Correct spelling mistake in description meta tag of wikistats 2
- T198168 : Correct order of metric types on Dashboard navbar/menu
- T198183 : Disable filter & split radio switches for metrics & reduce the height of wiki div in sidebar of detail page
- T200498 : Provide metric area headings in the 'Explore Topics' dropdown
- T200497 : Bug in time-range selector on detail page
UI Mockups for Cargo Special:Drilldown page
Other Info
I prefer mac OS for development but sometimes switch to debian as well. My native languages are English & Hindi. I'm not applying to any other organization/project in this years GSoC. I’m comfortable in working with a mentor who is several time zones away.