Some time on March 31st the figures recorded in Grafana for WPT alerts started differing from the history on http://wpt.wmftest.org/
Description
Description
Event Timeline
Comment Actions
Early signs of something being funny do match: http://wpt.wmftest.org/result/180331_JZ_8J/
But then, the values stop matching after approximately 2018-03-31 08:00 GMT, with Grafana values significantly higher than what is reported on wpt.wmftest.org. Not only that, none of the SpeedIndex values coming from that run, median or not, are higher than the Grafana value.
The Grafana values don't seem random, they're just... wrong. They don't match any other metric from the same run either.
Comment Actions
I've also looked at other runs in the same timespan and couldn't find these values either.
Comment Actions
The general WPT dashboard, which isn't affected by this, points to us-east metrics, while the alerts dashboard points to us-east-1.
I suspect that the alerts should be updated to point to us-east in order to match everything else?
Comment Actions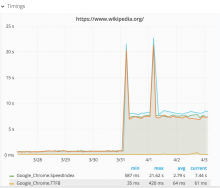
The alerts is still using the Windows machine, the rest of our is using Linux. It seems like the Windows machine went crazy, look at this:

I'm changing the alerts today to use Linux and then make sure each of the other teams WebPageTest dashboards is updated.
Comment Actions
I've updated the alerts now so it uses Linux. Looks good now. The Windows agent is still broken though.