Page MenuHomePhabricator

coal metrics changed after deploying new code
Closed, ResolvedPublic

Description

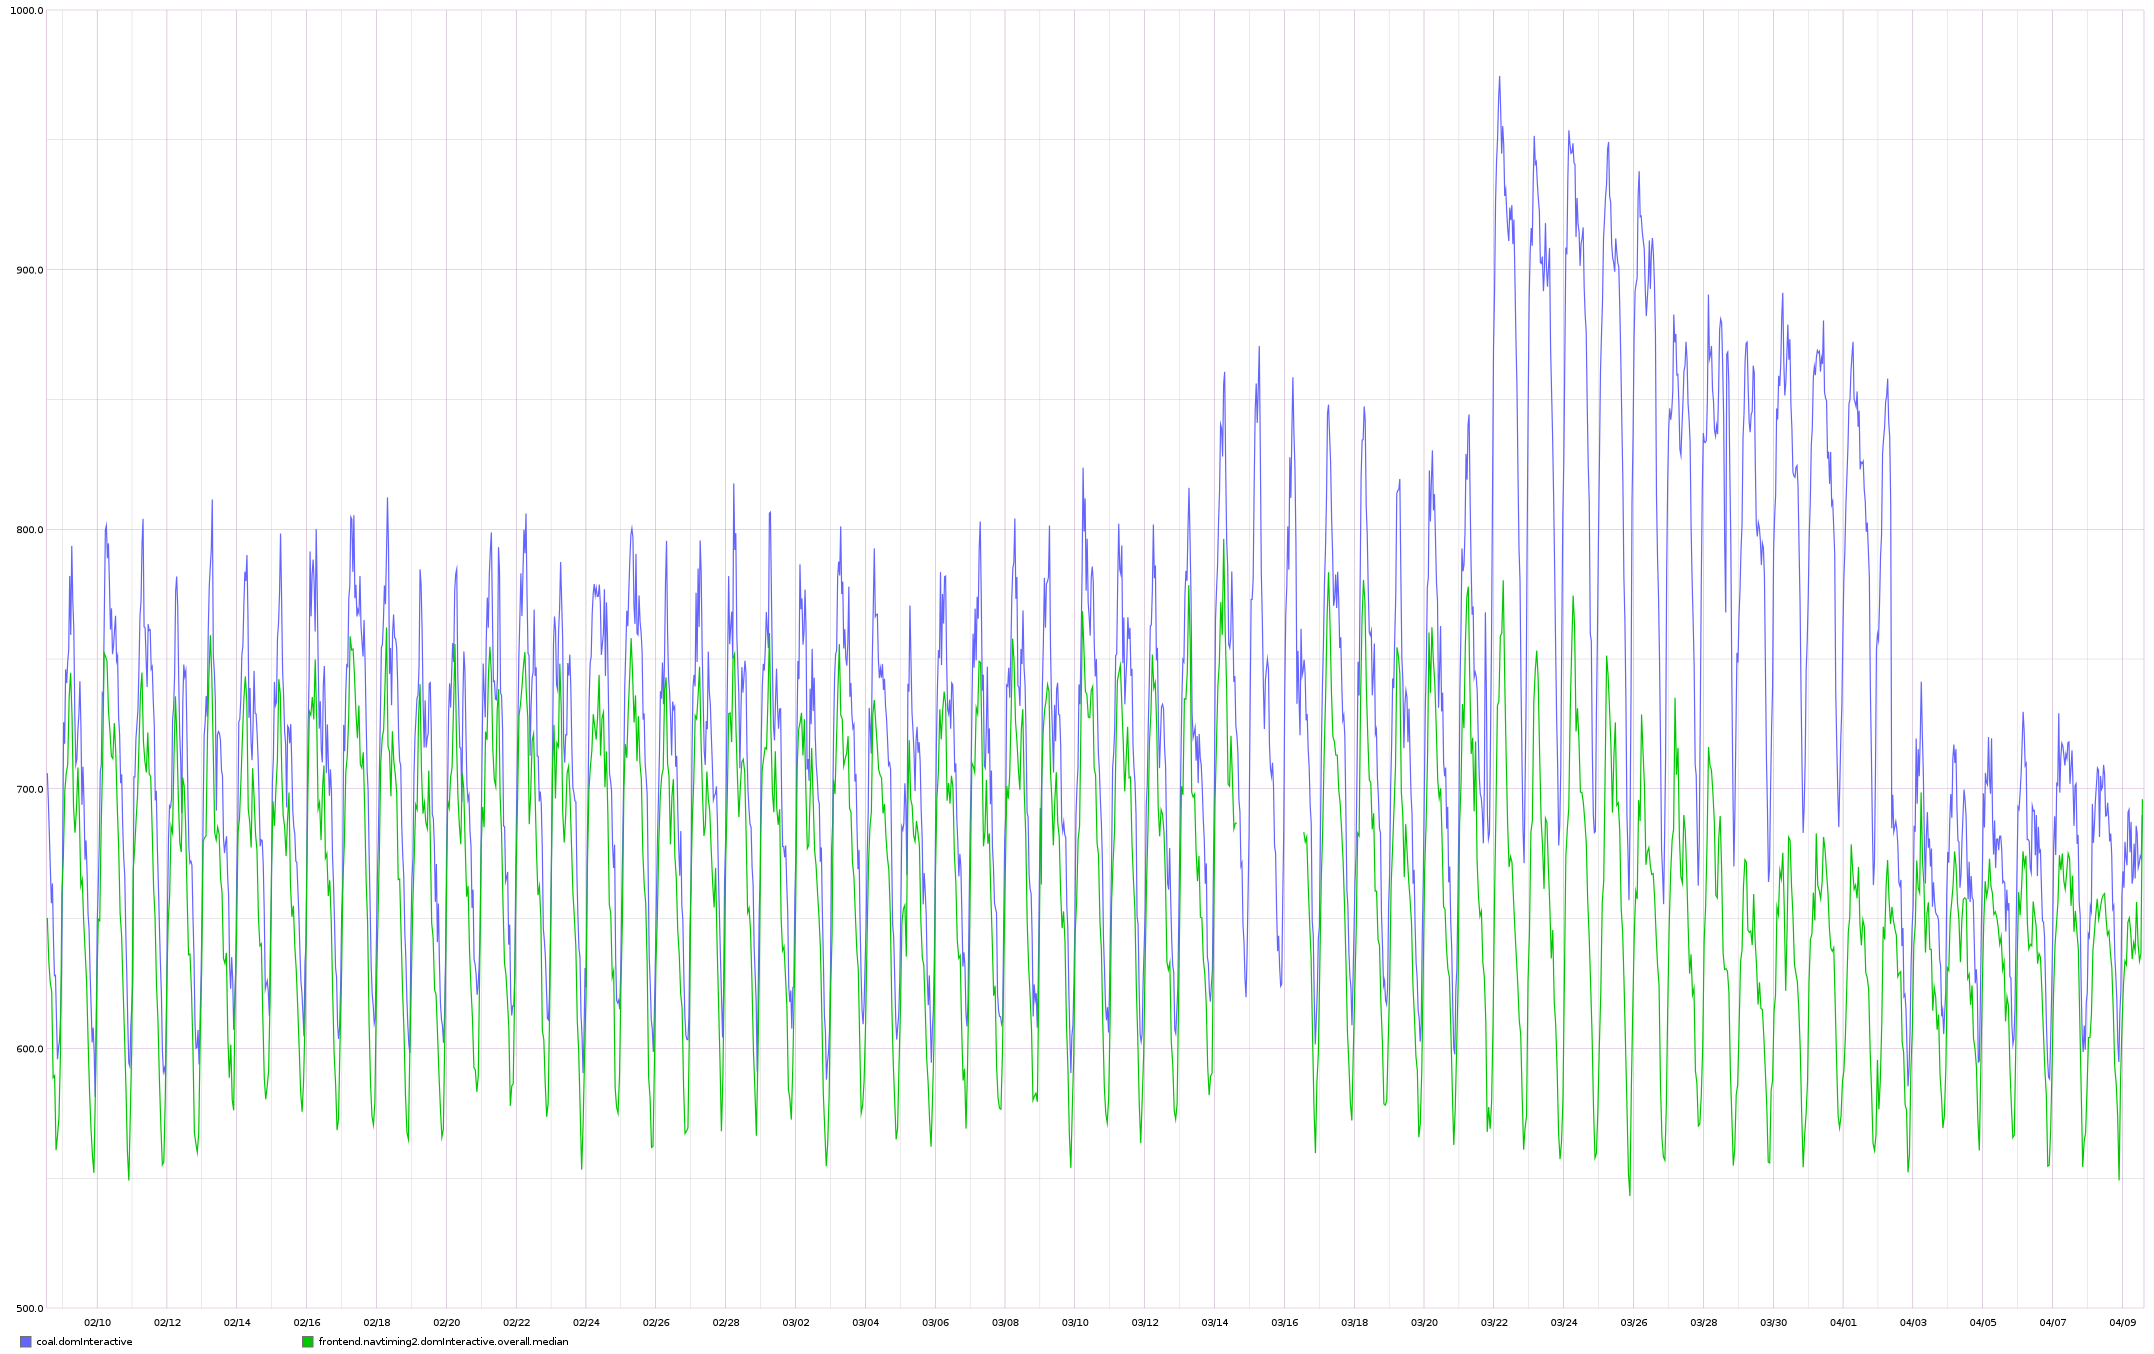
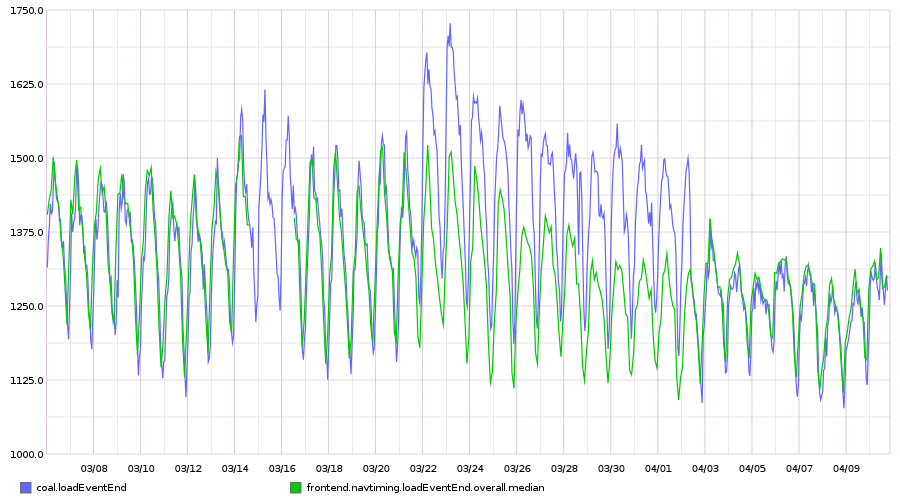
After deploying new coal code, a few of our metrics have changed:

image.png (700×1 px, 124 KB)

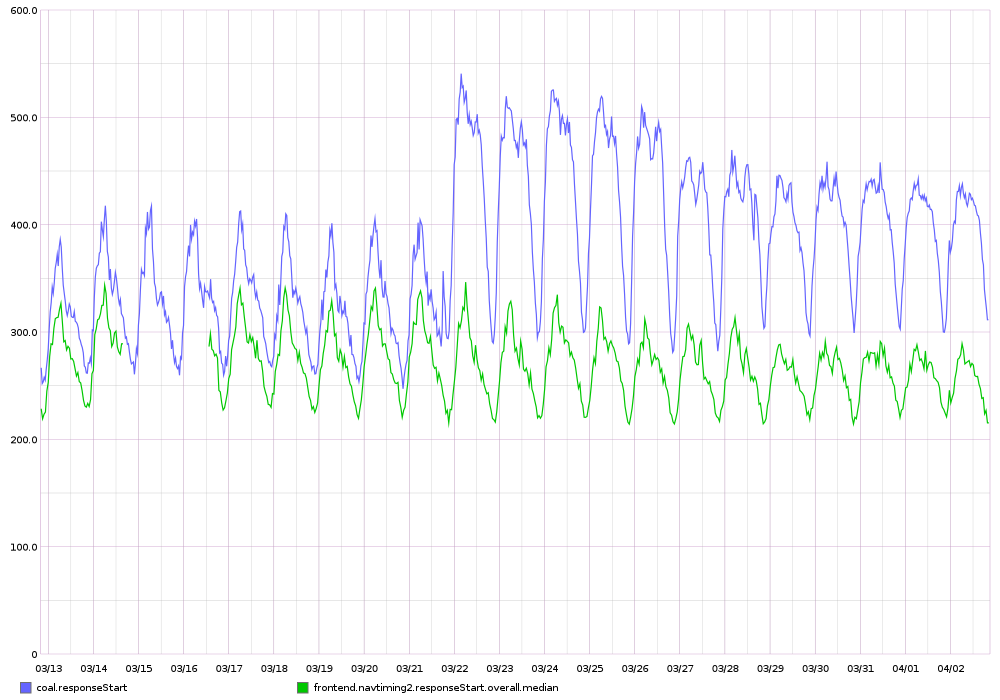
We didn't change the actual calculations, but we did change the logic that results in data being included (or excluded) in certain time windows. That's likely the cause, but we should understand why that had this effect.

image.png (1×864 px, 165 KB)

Event Timeline

I've confirmed that the new code is giving the correct results, and the old code is not.

Here's how I tested:

I wrote a script that would generate NavigationTiming events for a set period of time (20 minutes).

  • It would skew those events in a couple of different ways:
    • The value of 'dt', which is the date/time marker of the event, would be by between 0 and -5 seconds. Meaning, if the event was emitted at 2018-04-06T19:50:47.306961, the value of the 'dt' property might be anywhere between 2018-04-06T19:50:42.306961 and 2018-04-06T19:50:47.306961. This is the same behavior that is seen in production, where the dt value typically skews by 2 or 3 seconds. This also means that events may be delivered out of temporal order. Again, this is as seen in production.
    • The value of a few different timing properties (responseStart, responseEnd, firstPaint -- randomly chosen) was skewed.
      • responseStart was adjusted by +/- 250
      • responseEnd was set to responseStart + randint(1, 150)
      • firstPaint was set to responseEnd + randint(300, 1300)
  • Between each event, the script would wait for a random time between 0 and 1 seconds.
  • Events would be emitted to both a ZeroMQ socket, and to a Kafka topic.
  • At the end of the run, the script would output the details of _every event sent_ -- the 'dt' value, as well as the values of responseStart, responseEnd, and firstPaint.

The effect of this was a set of events that closely resemble production, but with a smaller number of varying elements than usual.

I then ran this script, along with both coal versions (new and old). (Note: I modified the old coal version to add some additional logging, but it was otherwise unchanged).

On the producer side, that resulted in output that looks like this (trimmed quite a bit):

(venv) vagrant@contrib-stretch:/srv/coal$ python produce.py
Emitting 10
Emitting 20
Emitting 30
.
.
.
Emitting 2340
Emitting 2350
Emitting 2360
time,responseStart,responseEnd,firstPaint
2018-04-06T19:46:39.993656,1523043999,351,473,1335
2018-04-06T19:46:39.392430,1523043999,655,667,1088
2018-04-06T19:46:38.885142,1523043998,573,587,1439
2018-04-06T19:46:40.061835,1523044000,324,416,750
.
.
.

The output from new coal looked like this:

(venv) vagrant@contrib-stretch:/srv/coal/new$ python coal.py --brokers 127.0.0.1:9092 --consumer-group v1546 --schema NavigationTiming --verbose
2018-04-06 19:46:44,217 [INFO] (run:412) Starting Kafka connection to brokers (127.0.0.1:9092).
2018-04-06 19:46:44,350 [INFO] (run:421) Subscribing to topics: ['eventlogging_NavigationTiming']
2018-04-06 19:46:44,350 [INFO] (run:424) Beginning poll cycle
2018-04-06 19:46:44,948 [DEBUG] (handle_event:217) [NavigationTiming] Moving oldest boundary marker back to 1523043960
2018-04-06 19:46:44,949 [DEBUG] (handle_event:225) [NavigationTiming] Adding boundary at 1523043960
2018-04-06 19:47:03,174 [DEBUG] (handle_event:225) [NavigationTiming] Adding boundary at 1523044020
2018-04-06 19:48:01,178 [DEBUG] (handle_event:225) [NavigationTiming] Adding boundary at 1523044080
2018-04-06 19:49:02,435 [DEBUG] (handle_event:225) [NavigationTiming] Adding boundary at 1523044140
2018-04-06 19:50:00,642 [DEBUG] (handle_event:225) [NavigationTiming] Adding boundary at 1523044200
2018-04-06 19:51:01,619 [DEBUG] (handle_event:225) [NavigationTiming] Adding boundary at 1523044260
2018-04-06 19:52:01,122 [DEBUG] (handle_event:225) [NavigationTiming] Adding boundary at 1523044320
2018-04-06 19:52:04,326 [DEBUG] (flush_data:296) Flushing data for schema NavigationTiming
2018-04-06 19:52:04,326 [INFO] (flush_data:339) [NavigationTiming] Processing events in boundaries [[1523043960, 1523044020, 1523044080, 1523044140, 1523044200]]
2018-04-06 19:52:04,353 [DEBUG] (flush_data:325) All windows with sufficient data have been processed
2018-04-06 19:52:04,353 [DEBUG] (flush_data:326) Returning last offset 23155
2018-04-06 19:52:04,353 [DEBUG] (commit:384) [NavigationTiming] Committing offset 23156
2018-04-06 19:52:04,358 [INFO] (commit:388) [NavigationTiming] Offset 23156 committed
2018-04-06 19:53:00,435 [DEBUG] (handle_event:225) [NavigationTiming] Adding boundary at 1523044380
2018-04-06 19:53:02,450 [DEBUG] (flush_data:296) Flushing data for schema NavigationTiming
2018-04-06 19:53:02,450 [INFO] (flush_data:339) [NavigationTiming] Processing events in boundaries [[1523044020, 1523044080, 1523044140, 1523044200, 1523044260]]
2018-04-06 19:53:02,463 [DEBUG] (flush_data:325) All windows with sufficient data have been processed
2018-04-06 19:53:02,464 [DEBUG] (flush_data:326) Returning last offset 23275
2018-04-06 19:53:02,464 [DEBUG] (commit:384) [NavigationTiming] Committing offset 23276
2018-04-06 19:53:02,467 [INFO] (commit:388) [NavigationTiming] Offset 23276 committed
2018-04-06 19:54:00,745 [DEBUG] (handle_event:225) [NavigationTiming] Adding boundary at 1523044440
2018-04-06 19:54:01,185 [DEBUG] (flush_data:296) Flushing data for schema NavigationTiming
2018-04-06 19:54:01,185 [INFO] (flush_data:339) [NavigationTiming] Processing events in boundaries [[1523044080, 1523044140, 1523044200, 1523044260, 1523044320]]
2018-04-06 19:54:01,199 [DEBUG] (flush_data:325) All windows with sufficient data have been processed
2018-04-06 19:54:01,199 [DEBUG] (flush_data:326) Returning last offset 23397
2018-04-06 19:54:01,199 [DEBUG] (commit:384) [NavigationTiming] Committing offset 23398
2018-04-06 19:54:01,201 [INFO] (commit:388) [NavigationTiming] Offset 23398 committed
.
.
.

The output from old coal (restricted to only relevant metrics) looked like this:

(venv) vagrant@contrib-stretch:/srv/coal/old$ python coal-old.py tcp://127.0.0.1:5555
2018-04-06 19:46:47,482 [INFO] (run:139) Connecting to %s.
2018-04-06 19:46:47,502 [INFO] (run:157) Entering main loop.
2018-04-06 19:51:47,503 [INFO] (run:170) timer fired
2018-04-06 19:51:47,503 [INFO] (flush_data:213) Flushing data
2018-04-06 19:51:47,517 [INFO] (flush_data:219) [firstPaint] [1523044307] 1315
2018-04-06 19:51:47,530 [INFO] (flush_data:219) [responseEnd] [1523044307] 483
2018-04-06 19:51:47,534 [INFO] (flush_data:219) [responseStart] [1523044307] 412
2018-04-06 19:52:47,499 [INFO] (run:170) timer fired
2018-04-06 19:52:47,499 [INFO] (flush_data:213) Flushing data
2018-04-06 19:52:47,516 [INFO] (flush_data:219) [firstPaint] [1523044367] 1342.0
2018-04-06 19:52:47,526 [INFO] (flush_data:219) [responseEnd] [1523044367] 492.0
2018-04-06 19:52:47,528 [INFO] (flush_data:219) [responseStart] [1523044367] 424.0
2018-04-06 19:53:47,497 [INFO] (run:170) timer fired
2018-04-06 19:53:47,497 [INFO] (flush_data:213) Flushing data
2018-04-06 19:53:47,510 [INFO] (flush_data:219) [firstPaint] [1523044427] 1348.0
2018-04-06 19:53:47,518 [INFO] (flush_data:219) [responseEnd] [1523044427] 513.0
2018-04-06 19:53:47,520 [INFO] (flush_data:219) [responseStart] [1523044427] 436.5
2018-04-06 19:54:47,502 [INFO] (run:170) timer fired
2018-04-06 19:54:47,502 [INFO] (flush_data:213) Flushing data
2018-04-06 19:54:47,518 [INFO] (flush_data:219) [firstPaint] [1523044487] 1342.5
2018-04-06 19:54:47,542 [INFO] (flush_data:219) [responseEnd] [1523044487] 513.0
2018-04-06 19:54:47,544 [INFO] (flush_data:219) [responseStart] [1523044487] 433.0
.
.
.

The expectation was that the whisper files would reflect the timestamps of the data flushes. This was _not_ the actual behavior.

The whisper files created by new coal had timestamps at 4260, 4320, etc, as expected:

(graphite) vagrant@contrib-stretch:/opt/graphite$ whisper-dump.py storage/whisper/new/firstPaint.wsp | head -n 30
Meta data:
  aggregation method: average
  max retention: 31556940
  xFilesFactor: 0.5

Archive 0 info:
  offset: 28
  seconds per point: 60
  points: 525949
  retention: 31556940
  size: 6311388

Archive 0 data:
0: 1523044260,       1311
1: 1523044320,       1315
2: 1523044380,       1342
3: 1523044440,       1350
4: 1523044500,     1355.5
5: 1523044560,       1361
6: 1523044620,     1356.5
7: 1523044680,       1341
8: 1523044740,     1324.5
9: 1523044800,       1323
10: 1523044860,       1333
11: 1523044920,     1317.5
12: 1523044980,       1323
13: 1523045040,     1320.5
14: 1523045100,       1306
15: 0,          0
16: 0,          0

The whisper files created by old coal were expected to use timestamps of 1523044307, 1523044367, 1523044327, and so on. However, they do not. They use timestamps aligned along the 60-second boundaries:

(graphite) vagrant@contrib-stretch:/opt/graphite$ whisper-dump.py storage/whisper/old/firstPaint.wsp | head -n 30
Meta data:
  aggregation method: average
  max retention: 31556940
  xFilesFactor: 0.5

Archive 0 info:
  offset: 28
  seconds per point: 60
  points: 525949
  retention: 31556940
  size: 6311388

Archive 0 data:
0: 1523044260,       1315
1: 1523044320,       1342
2: 1523044380,       1348
3: 1523044440,     1342.5
4: 1523044500,       1355
5: 1523044560,       1352
6: 1523044620,       1342
7: 1523044680,     1324.5
8: 1523044740,       1320
9: 1523044800,       1329
10: 1523044860,       1340
11: 1523044920,       1319
12: 1523044980,       1327
13: 1523045040,       1306
14: 1523045100,       1301
15: 1523045160,       1301
16: 1523045220,       1301

Finally, I took the full set of events that was output by the generator script, and plugged it in to a spreadsheet. I then manually calculated the median for each window of time. For firstPaint, it looks like this:

4260	1311
4320	1315
4380	1342
4440	1350
4500	1355.5
4560	1361
4620	1356.5
4680	1384
4740	1324.5

I'm unclear on why it is that the old data appeared to be generally lower than the new, but I'm satisfied with the knowledge that the new data is being calculated correctly. I continue to suspect that the reason for the difference is likely due to timing issues.

Change 424761 had a related patch set uploaded (by Imarlier; owner: Imarlier):
[operations/puppet@production] coal: Fix property name that indicates an oversample

https://gerrit.wikimedia.org/r/424761

Woke up in the middle of the night knowing what was going on. The code was checking for the presence of "is_oversample" and discarding if true, but the property is actually named "isOversample". Was getting thrown off because we do that a little differently in navtiming.py.

Change 424761 merged by Elukey:
[operations/puppet@production] coal: Fix property name that indicates an oversample

https://gerrit.wikimedia.org/r/424761

Fix is deployed, and I'm re-running the data that's in kafka. It starts at Monday, April 2, 2018 8:53:00 AM, meaning that we can reprocess going back just over 1 week. Unfortunately we'll have a window where the data is skewed due to oversampling from Asia prior to that, but it's not worth the time/energy to fix, IMO.

Reprocessing is also running in codfw, to make sure that data center is correct.

After re-processing, medians are lining up as before

median comparison after reprocessing.png (1×2 px, 417 KB)

I'm going to see about re-running the data from 3/20-4/2, by pulling from the eventlogging database and dumping into a new Kafka queue, then running a special coal instance against that queue.

Mentioned in SAL (#wikimedia-operations) [2018-04-10T18:07:35Z] <Krinkle> Stopping coal on graphite1001 to manually repopulate for T191239

Mentioned in SAL (#wikimedia-operations) [2018-04-11T14:38:02Z] <Krinkle> Turned regular coal back on (T191239)

All affected data has been reprocessed, and the graphs look like they should.

Mentioned in SAL (#wikimedia-operations) [2018-04-11T15:20:25Z] <Krinkle> disabling coal service on graphite2001 and disabling puppet – T191239

graphite2001$ sudo disable-puppet 'stop coal' && sudo systemctl disable coal

graphite1001$ cp -R /var/lib/coal "coal-$(date -I)" && tar -cvzpf coal.tar.gz coal-2018-04-11

graphite2001$ ls -halF /var/lib/coal
graphite2001$ tar -xvzf coal-2018-04-11.tar.gz && sudo -u coal cp coal-2018-04-11/* /var/lib/coal
graphite2001$ ls -halF /var/lib/coal # confirm same ownership and chmod

graphite2001$ sudo systemctl enable coal && sudo systemctl start coal && sudo enable-puppet 'coal is done'