Page MenuHomePhabricator

Logstash packet loss
Closed, ResolvedPublic

Assigned To
Authored By
tstarling
Aug 2 2018, 2:14 AM
Referenced Files
F25243853: 2018-08-23-003102_1759x1167_scrot.png
Aug 22 2018, 10:53 PM
F24735392: Screen Shot 2018-08-09 at 3.21.56 PM.png
Aug 9 2018, 7:31 PM
F24734444: heap-after-gc.png
Aug 9 2018, 3:39 PM
F24734465: heap-after-gc-long.png
Aug 9 2018, 3:39 PM
F24690529: 2018-08-08-174518_523x295_scrot.png
Aug 8 2018, 3:47 PM
F24436565: logstash loss rate.png
Aug 2 2018, 7:18 AM
F24436562: logstash restart.png
Aug 2 2018, 7:18 AM
Tokens
"Orange Medal" token, awarded by mmodell."Orange Medal" token, awarded by Krinkle.

Description

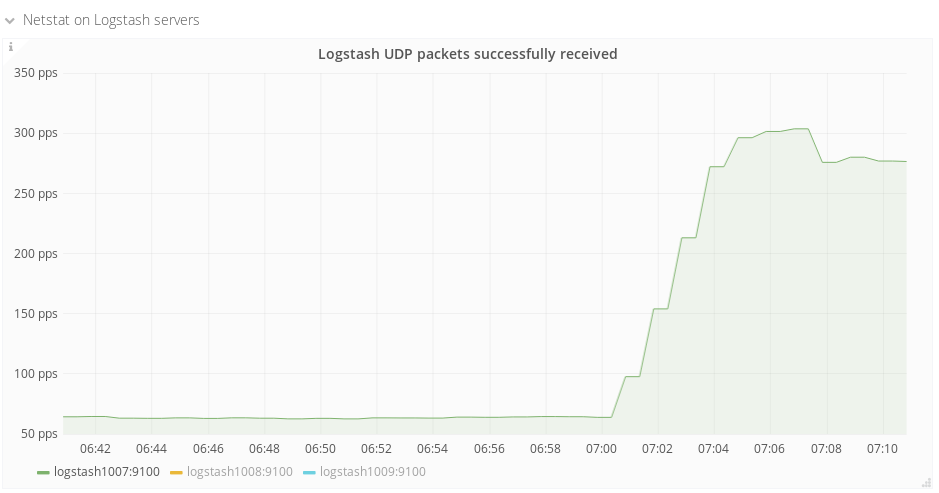
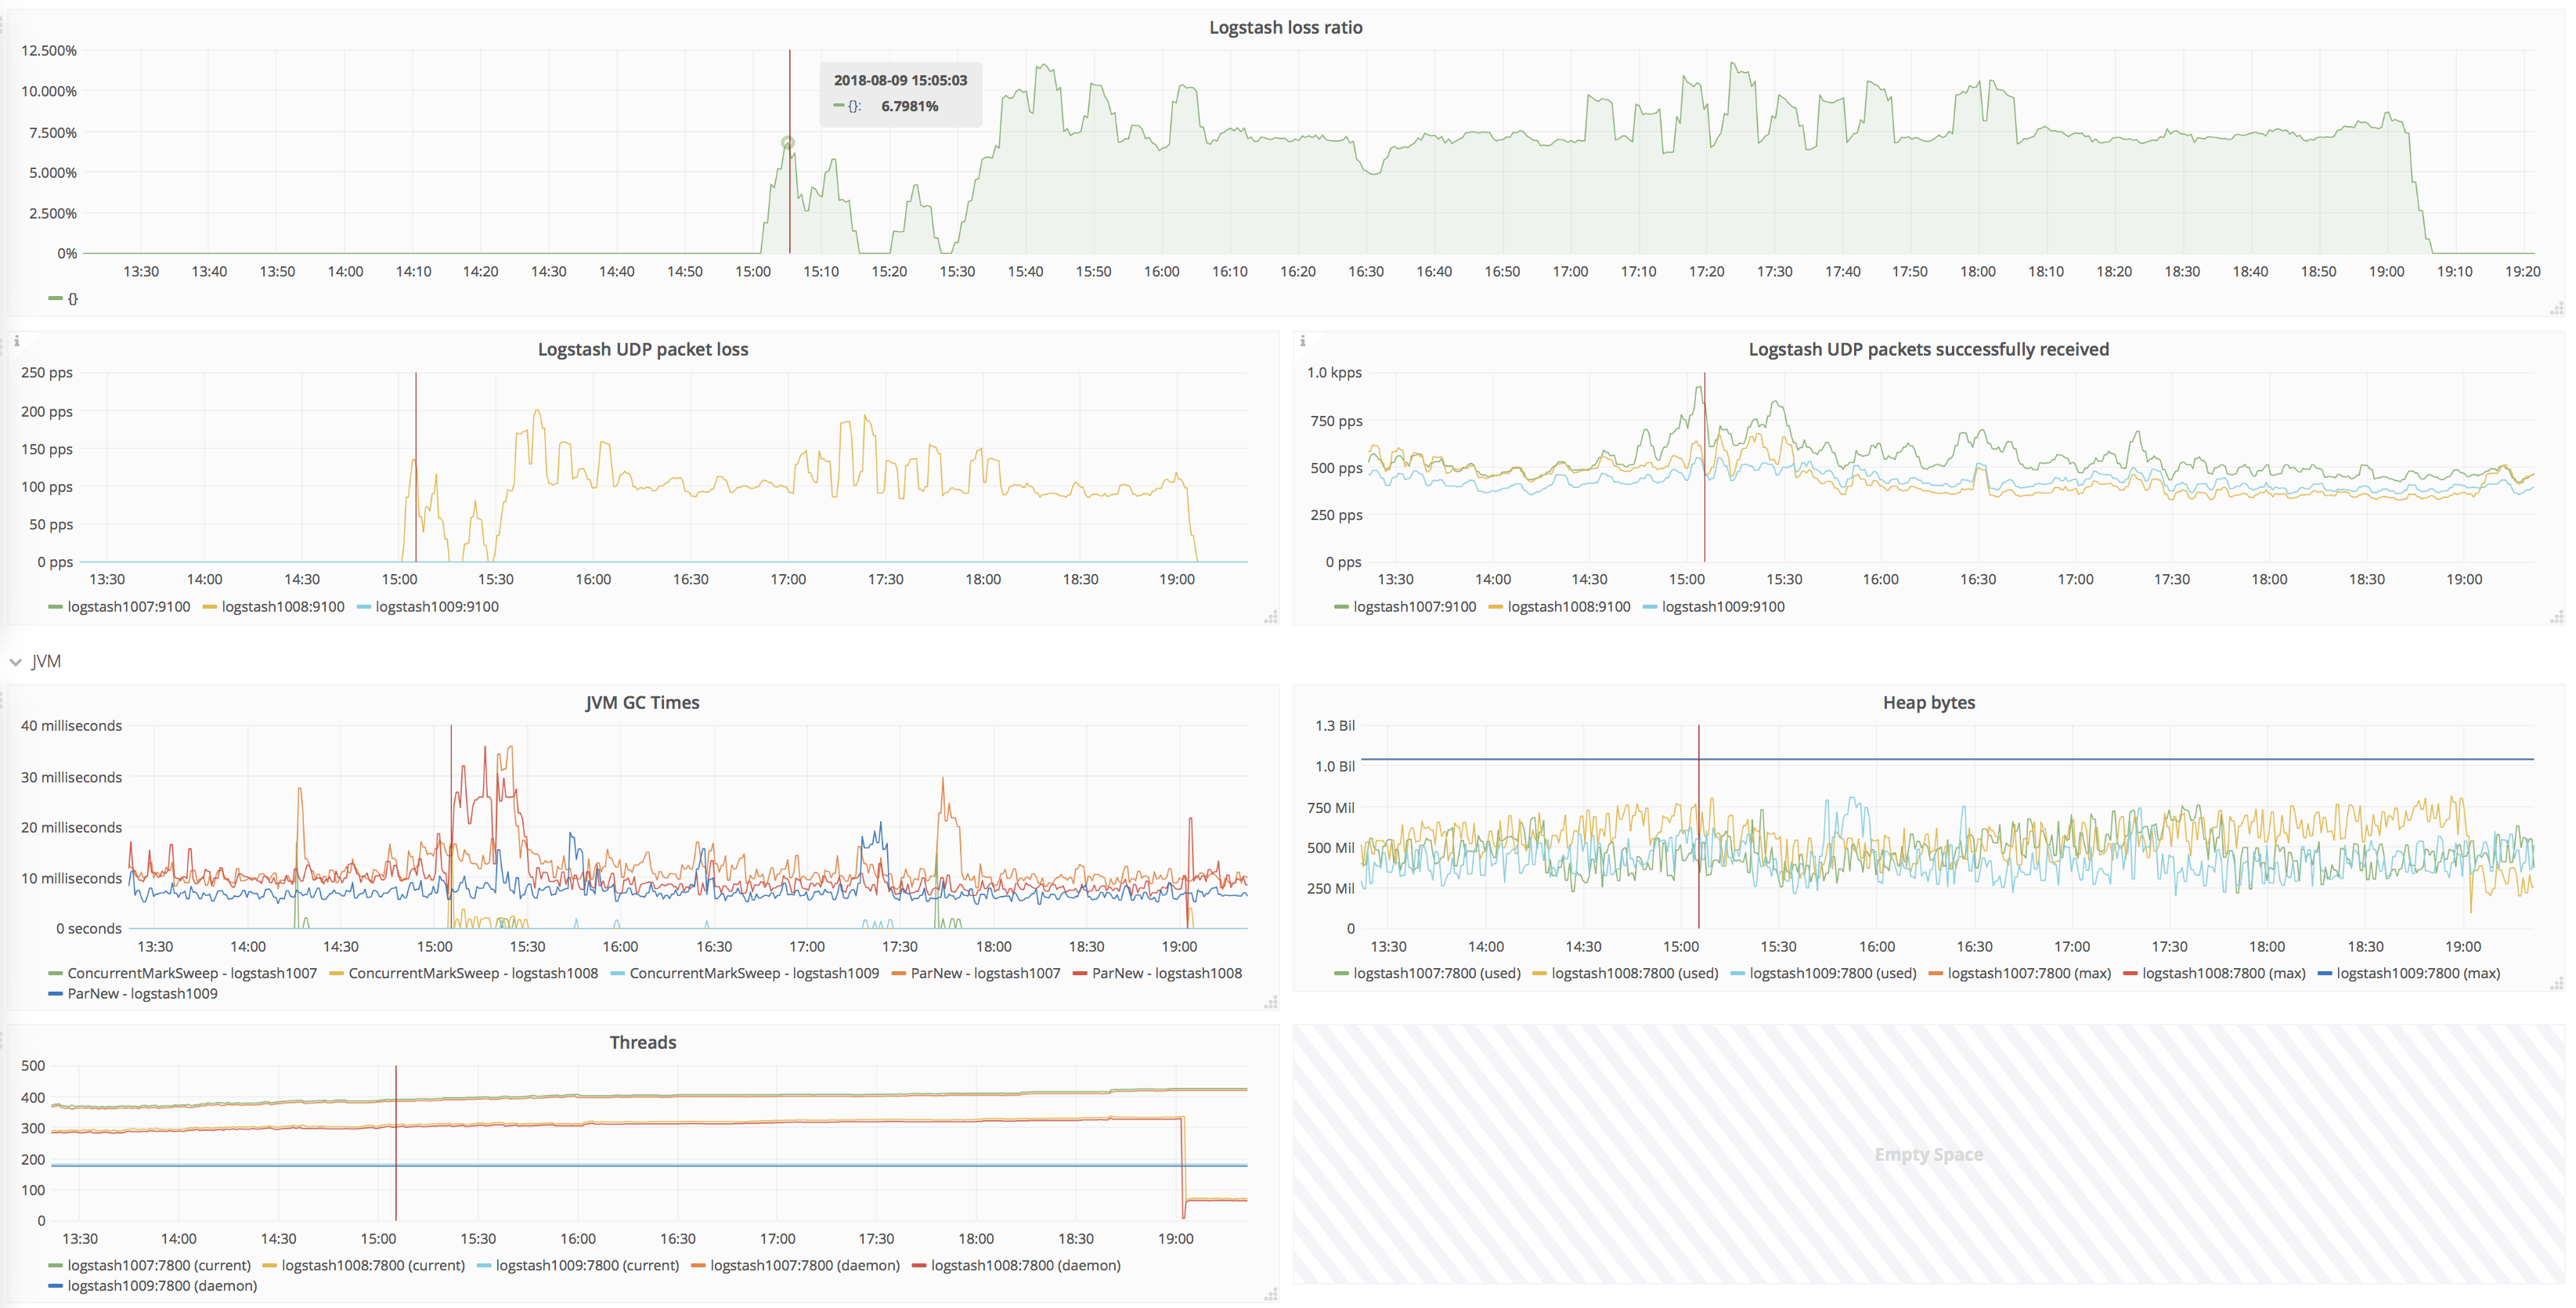
Logstash is losing about 3000-4000 UDP packets per second. The loss rate suddenly jumped up on about June 29. I made a Grafana dashboard showing the problem: https://grafana.wikimedia.org/dashboard/db/logstash?orgId=1

@Krinkle reported that many log events were missing from search results. The high loss rate would seem to explain this.

Logstash has a metrics API giving timing information for pipeline plugins. If we plotted rates from it, we might be able to figure out what the bottleneck is. For example:

[0209][root@logstash1007:~]$ curl -s 'localhost:9600/_node/stats/pipeline' | jq '.pipeline.plugins.inputs[0].events.queue_push_duration_in_millis' ; sleep 10; curl -s 'localhost:9600/_node/stats/pipeline' | jq '.pipeline.plugins.inputs[0].events.queue_push_duration_in_millis'
1619816401
1619823795

This shows the syslog input plugin (a single thread) consuming 74% of available time. Does it sleep for the other 26%?

Event Timeline

There are a very large number of changes, so older changes are hidden. Show Older Changes
tstarling renamed this task from Logstash has high packet loss since June 29 to Logstash has ~90% packet loss since June 29.Aug 2 2018, 3:34 AM

There is T200362 for exporting logstash metrics.

I tried restarting logstash on logstash1007 with no other change, to avoid confounding the test, then I quadrupled the default receive buffer size (net.core.rmem_default) and restarted it again. The restart alone increased throughput by a factor of 4.7, nice but hardly enough to put a dent in the packet loss graph. The receive buffer change had no effect or a negative effect.

See the graphs below where the first restart is at 06:59 and the second restart is at 07:07.

logstash restart.png (493×939 px, 32 KB)

logstash loss rate.png (490×931 px, 37 KB)

Netstat confirms that the receive buffer in question is now 800KB.

Proto Recv-Q Send-Q Local Address           Foreign Address         State      
udp6  853248      0 [::]:10514              [::]:*

I'll restart logstash on the other servers for now.

After the restart on logstash1007 syslog shows taking about 90% time:

# curl -s 'localhost:9600/_node/stats/pipeline' | jq '.pipeline.plugins.inputs[0].events.queue_push_duration_in_millis' ; sleep 10; curl -s 'localhost:9600/_node/stats/pipeline' | jq '.pipeline.plugins.inputs[0].events.queue_push_duration_in_millis'
1966233
1975302

A ton of these messages (from tcpdump), likely spamming syslog

"message":"Use of LanguageGetMagic hook (used in LabeledSectionTransclusion::setupMagic) was deprecated in MediaWiki 1.16. [Called from Hooks::run in /srv/mediawiki/php-1.32.0-wmf.14/includes/Hooks.php at line 202]"

Change 449958 had a related patch set uploaded (by Filippo Giunchedi; owner: Filippo Giunchedi):
[operations/puppet@production] logstash: alert on udp packet loss

https://gerrit.wikimedia.org/r/449958

Change 449958 merged by Filippo Giunchedi:
[operations/puppet@production] logstash: alert on udp packet loss

https://gerrit.wikimedia.org/r/449958

Change 449984 had a related patch set uploaded (by Filippo Giunchedi; owner: Filippo Giunchedi):
[operations/puppet@production] prometheus: fix udp loss alert

https://gerrit.wikimedia.org/r/449984

Change 449984 merged by Filippo Giunchedi:
[operations/puppet@production] prometheus: fix udp loss alert

https://gerrit.wikimedia.org/r/449984

Mentioned in SAL (#wikimedia-operations) [2018-08-02T10:19:12Z] <godog> test bumping rmem_default to 4MB on logstash1007 - T200960

Mentioned in SAL (#wikimedia-operations) [2018-08-02T10:47:32Z] <godog> test bumping heap to 512mb on logstash1007 - T200960

The logspam patches removed the extra demand caused by the 1.32.0-wmf.10 deployment. Packet loss is now down to ~20%, i.e. still bad but comparable to the long term average of available Prometheus data, which starts in May. There was a drop in successfully consumed packets with this demand drop, which should leave logstash with some capacity headroom. So the next most obvious theory is stalling, and yet the 4MB receive buffer didn't help reduce the packet loss, which is amazing since the bitrate is low, 4MB should correspond to a stall of about 2.7 seconds. It seems to be slow or stalling for even longer periods of time than that.

Mentioned in SAL (#wikimedia-operations) [2018-08-02T11:03:12Z] <godog> comment "pipeline.workers: 1" from logstash1007 - T200960

Mentioned in SAL (#wikimedia-operations) [2018-08-02T11:17:38Z] <godog> temporarily remove multiline filter from logstash to allow using multiple workers - T200960

Mentioned in SAL (#wikimedia-operations) [2018-08-02T11:22:46Z] <godog> temporarily remove multiline filter from logstash100[789] and bump pipeline workers to 4 - T200960

I poked at logstash a little more and packet loss has gone away after these changes (not yet in puppet):

  1. pipeline.workers: 1 was explicit in the logstash configuration, I commented it to get #workers == #CPUs working on the pipeline
  2. the multiline filter isn't thread safe so even with the setting above I had to remove multiline filter for now (used only by hhvm-fatal)
  3. increased the default receive buffer to 4MB on all logstash hosts, that's enough headroom for logstash to catch up

I'll followup with puppet patches for these changes.

Change 450026 had a related patch set uploaded (by Filippo Giunchedi; owner: Filippo Giunchedi):
[operations/puppet@production] logstash: remove multiline filter

https://gerrit.wikimedia.org/r/450026

Change 450027 had a related patch set uploaded (by Filippo Giunchedi; owner: Filippo Giunchedi):
[operations/puppet@production] logstash: use default number of queue workers

https://gerrit.wikimedia.org/r/450027

Change 450028 had a related patch set uploaded (by Filippo Giunchedi; owner: Filippo Giunchedi):
[operations/puppet@production] logstash: default to 4MB receive buffer

https://gerrit.wikimedia.org/r/450028

Not directly a fix for the specific issues here, but while @tstarling was first investigating he noticed our LVS for the logstash UDP services was maintaining full connection state for stateless protocols. As it turns out, we've already deployed "one packet scheduler" to address this for other similar cases (our recdns LVS service), so it's a pretty easy efficiency win to turn it on for the stateless logstash UDP services. Patch inbound to this ticket shortly.

Change 449913 had a related patch set uploaded (by BBlack; owner: BBlack):
[operations/puppet@production] use one-packet-scheduler for most logstash UDPs

https://gerrit.wikimedia.org/r/449913

Change 450028 merged by Filippo Giunchedi:
[operations/puppet@production] logstash: default to 4MB receive buffer

https://gerrit.wikimedia.org/r/450028

Change 450026 merged by Filippo Giunchedi:
[operations/puppet@production] logstash: remove multiline filter

https://gerrit.wikimedia.org/r/450026

Change 450027 merged by Filippo Giunchedi:
[operations/puppet@production] logstash: use default number of queue workers

https://gerrit.wikimedia.org/r/450027

Change 450195 had a related patch set uploaded (by Filippo Giunchedi; owner: Filippo Giunchedi):
[operations/puppet@production] logstash: default workers to processorcount

https://gerrit.wikimedia.org/r/450195

Change 450195 merged by Filippo Giunchedi:
[operations/puppet@production] logstash: default workers to processorcount

https://gerrit.wikimedia.org/r/450195

UDP loss has been minimized now, though even with the current settings I've seen the receive buffer spike to ~1.5MB before getting drained. Short term what we could do is spool syslog traffic to disk (via logstash itself and persistent queues or rsyslog) instead of relying on being fast enough to drain the receive buffer.

Slightly related, I asked syslog logstash input upstream to add settings for receive buffers: https://github.com/logstash-plugins/logstash-input-syslog/issues/50

Back up to ~60% loss now, due to a slow drop in capacity on logstash1008 and logstash1009. And there was a similar event on August 4, which was fixed when @fgiunchedi restarted logstash. Can we have a daily restart cron job now?

Change 450522 had a related patch set uploaded (by Filippo Giunchedi; owner: Filippo Giunchedi):
[operations/puppet@production] logstash: alert on udp loss ratio

https://gerrit.wikimedia.org/r/450522

Change 450522 merged by Filippo Giunchedi:
[operations/puppet@production] logstash: alert on udp loss ratio

https://gerrit.wikimedia.org/r/450522

Change 450527 had a related patch set uploaded (by Filippo Giunchedi; owner: Filippo Giunchedi):
[operations/puppet@production] logstash: daily bandaid restart

https://gerrit.wikimedia.org/r/450527

Change 450527 merged by Filippo Giunchedi:
[operations/puppet@production] logstash: daily bandaid restart

https://gerrit.wikimedia.org/r/450527

Daily restart is in place now and a packet loss alert too. Unfortunately packet loss shows up some hours after a restart too, with not only the syslog receive buffer filling up but also the gelf port (12201 udp). In addition to that logstash laments errors while receiving gelf, so possibly related:

[2018-08-06T10:12:46,227][WARN ][logstash.inputs.gelf     ] Gelfd failed to parse a message skipping {:exception=>#<Gelfd::TooManyChunksError: 140 greater than 128>, :backtrace=>["/usr/share/logstash/vendor/bundle/jruby/1.9/gems/gelfd-0.2.
0/lib/gelfd/chunked_parser.rb:40:in `parse_chunk'", "/usr/share/logstash/vendor/bundle/jruby/1.9/gems/gelfd-0.2.0/lib/gelfd/chunked_parser.rb:8:in `parse'", "/usr/share/logstash/vendor/bundle/jruby/1.9/gems/gelfd-0.2.0/lib/gelfd/parser.rb:10:in `parse'", "/usr/share/logstash/vendor/bundle/jruby/1.9/gems/logstash-input-gelf-3.0.5/lib/logstash/inputs/gelf.rb:104:in `udp_listener'", "/usr/share/logstash/vendor/bundle/jruby/1.9/gems/logstash-input-gelf-3.0.5/lib/logstash/inputs/gelf.rb:77:in `run'", "/usr/share/logstash/logstash-core/lib/logstash/pipeline.rb:456:in `inputworker'", "/usr/share/logstash/logstash-core/lib/logstash/pipeline.rb:449:in `start_input'"]}

Change 450552 had a related patch set uploaded (by Filippo Giunchedi; owner: Filippo Giunchedi):
[operations/puppet@production] logstash: bump udp loss thresholds

https://gerrit.wikimedia.org/r/450552

Change 450552 merged by Filippo Giunchedi:
[operations/puppet@production] logstash: bump udp loss thresholds

https://gerrit.wikimedia.org/r/450552

Change 450609 had a related patch set uploaded (by Herron; owner: Herron):
[operations/puppet@production] logstash: double jvm heap size to 512m

https://gerrit.wikimedia.org/r/450609

Change 450609 merged by Herron:
[operations/puppet@production] logstash: double jvm heap size to 512m

https://gerrit.wikimedia.org/r/450609

Mentioned in SAL (#wikimedia-operations) [2018-08-06T18:04:40Z] <herron> double logstash jvm heap size from 256m to 512m and rolling restart of logstash instances T200960

Change 450971 had a related patch set uploaded (by Filippo Giunchedi; owner: Filippo Giunchedi):
[operations/puppet@production] logstash: enable persistent queues

https://gerrit.wikimedia.org/r/450971

Change 450971 merged by Filippo Giunchedi:
[operations/puppet@production] logstash: enable persistent queues

https://gerrit.wikimedia.org/r/450971

Change 450976 had a related patch set uploaded (by Filippo Giunchedi; owner: Filippo Giunchedi):
[operations/puppet@production] logstash: brown paperbag fix

https://gerrit.wikimedia.org/r/450976

Change 450976 merged by Filippo Giunchedi:
[operations/puppet@production] logstash: brown paperbag fix

https://gerrit.wikimedia.org/r/450976

I've enabled disk persisted queues in logstash, early to tell now but it looks like that "fixed" (papered over) the issue so slow pipelines and outputs don't affect inputs anymore. I'll remove the daily restart later today if things look in order.

Change 450991 had a related patch set uploaded (by Herron; owner: Herron):
[operations/puppet@production] logstash: double jvm heap size to 1g

https://gerrit.wikimedia.org/r/450991

Change 450991 merged by Herron:
[operations/puppet@production] logstash: double jvm heap size to 1g

https://gerrit.wikimedia.org/r/450991

Change 450992 had a related patch set uploaded (by Filippo Giunchedi; owner: Filippo Giunchedi):
[operations/puppet@production] logstash: don't restart daily

https://gerrit.wikimedia.org/r/450992

Change 450992 merged by Filippo Giunchedi:
[operations/puppet@production] logstash: don't restart daily

https://gerrit.wikimedia.org/r/450992

fgiunchedi triaged this task as Medium priority.Aug 8 2018, 9:16 AM

I am not seeing packet loss anymore after moving to persisted queues, I'm resolving this though feel free to reopen. There is still the issue of slow pipelines of course, which hopefully we'll get more insights with logstash metrics exported into prometheus.

fgiunchedi claimed this task.

Reopening since I just saw a brief 40 packets/s loss on logstash1008

fgiunchedi renamed this task from Logstash has ~90% packet loss since June 29 to Logstash packet loss.Aug 8 2018, 11:02 AM

I've added java threads and heap bytes to the dashboard, looks like there's a thread leak on 2 out of 3 hosts (unclear though if that's involved in packet loss)

2018-08-08-174518_523x295_scrot.png (295×523 px, 32 KB)

Mentioned in SAL (#wikimedia-operations) [2018-08-08T17:55:17Z] <herron> performing rolling restart of logstash instances T200960

Looking at GC logs, it seems that we have a correlation between GC activity and packet loss (at least to some extend)

Heap Occupancy After GC:

heap-after-gc.png (943×1 px, 144 KB)

Looking at GC logs over a longer period, we can see that there is a semi-regular high GC activity:

heap-after-gc-long.png (991×1 px, 196 KB)

I would have expected this to correlate with ingestion rates, but I can't see a similar pattern in grafana. We might have one specific ingester that is more expensive than others and that has an unregular load pattern. Or we might have an output which drives this load pattern.

We might want to investigate using G1 as a mitigation, but this might just hide a deeper issue.

Mentioned in SAL (#wikimedia-operations) [2018-08-09T19:02:36Z] <herron> logstash1008:~# systemctl restart logstash T200960

Looking at https://grafana.wikimedia.org/dashboard/db/logstash-herron-wip timing indeed does seem to line up between UDP loss on logstash1008 and GC activity on the same instance. In this timeframe logstash1008 continues dropping UDP packets until it is manually restarted.

Screen Shot 2018-08-09 at 3.21.56 PM.png (1×3 px, 1 MB)

Interestingly logstash1008 appears to be an outlier in terms of heap bytes used.

Shortly after 19:00 (when logstash on logstash1008 was restarted) logstash1008 packet loss, heap and threads drop off.

A couple of days ago a sudden spike of syslog udp input caused again packet loss. IOW we have mitigated the common cases but sudden udp surges will still causes loss.

Next option is to have something much faster like rsyslog listen for syslog messages, write to a file and instruct logstash to tail that file instead.

2018-08-23-003102_1759x1167_scrot.png (1×1 px, 211 KB)

A couple of days ago a sudden spike of syslog udp input caused again packet loss. IOW we have mitigated the common cases but sudden udp surges will still causes loss.

Next option is to have something much faster like rsyslog listen for syslog messages, write to a file and instruct logstash to tail that file instead.

Since we (SRE) will be working on T205849: Begin the implementation of Q1's Logging Infrastructure design (2018-19 Q2 Goal) this quarter, making the current Logstash inputs more resilient to sudden spikes isn't an immediate priority. Resolving the task for now also because alerting is in place, if over the next weeks input spikes become much more severe we can reevaluate.

Change 468938 had a related patch set uploaded (by Filippo Giunchedi; owner: Filippo Giunchedi):
[operations/puppet@production] logstash: bump default receive buffer

https://gerrit.wikimedia.org/r/468938

Change 468938 merged by Filippo Giunchedi:
[operations/puppet@production] logstash: bump default receive buffer

https://gerrit.wikimedia.org/r/468938

Change 493610 had a related patch set uploaded (by Herron; owner: Herron):
[operations/puppet@production] logstash: disable persisted queue

https://gerrit.wikimedia.org/r/493610

Change 493610 merged by Herron:
[operations/puppet@production] logstash: disable persisted queue

https://gerrit.wikimedia.org/r/493610

FTR:

Twice in two months we've seen all the logstashen in one cluster 'lock up' at around the same time: stop processing incoming events, huge backlog of socket recv-Q bytes, JVM threads drop, CPU usage plummets, threads blocked on futex().

What seemed to resolve it was clearing the persistent queue on each machine and restarting the logstash service.

Happened first on 2018-12-26 and again on 2019-02-28 (and in that last instance I believe happened twice in quick succession?)