Problem
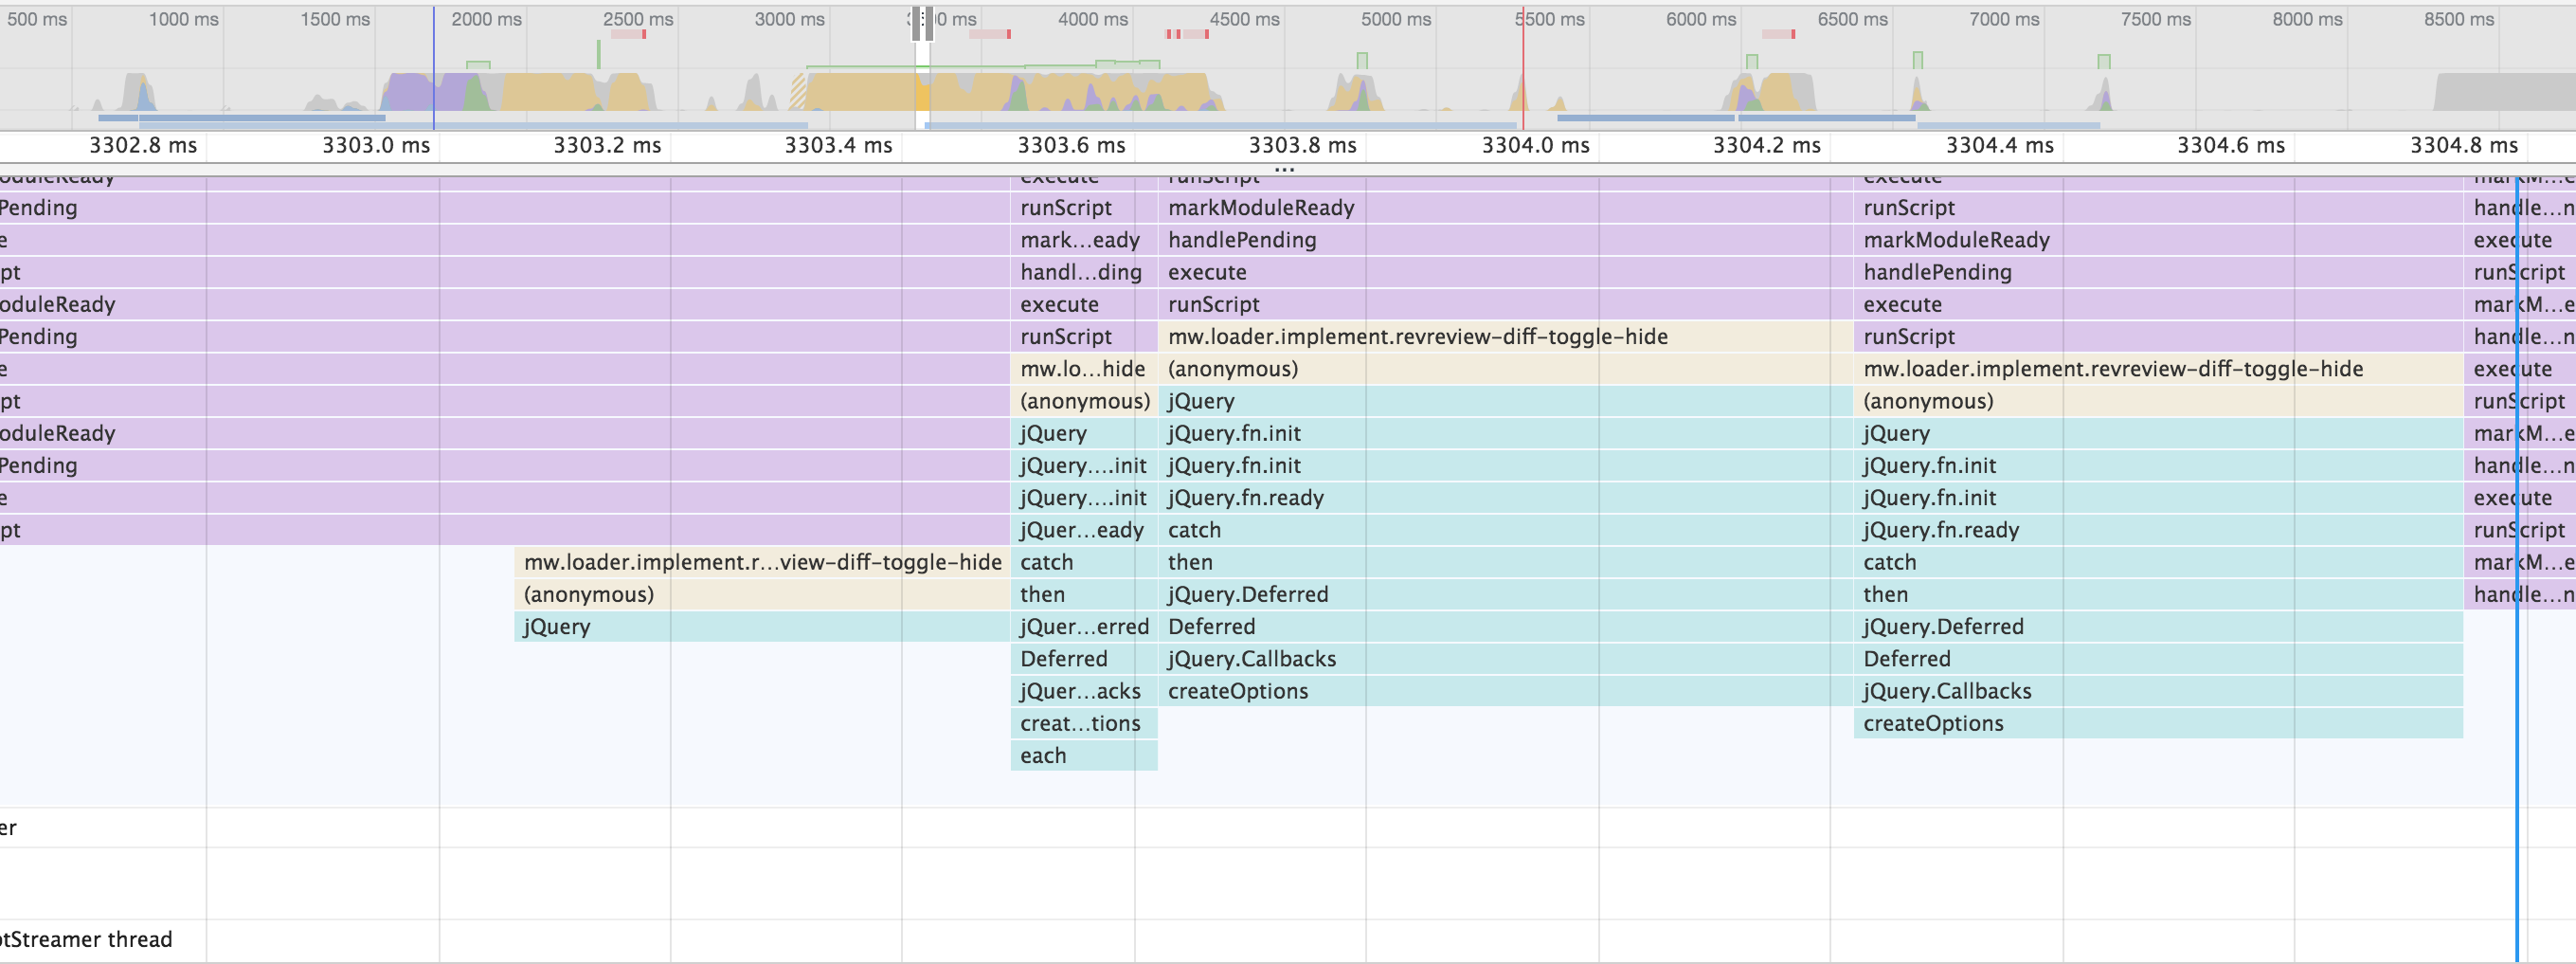
When inspecting a performance timeline (e.g. in Chrome), it initially appears as if none of the source code that we load on pages is actually executing. This is because the first many layers of the call stack are occupied by mw.loader internals.
Aside from burying actual module code deep down the graph, it also makes it hard to debug mw.loader itself, and to see how and where it spends time, because similar calls are not aligned with each other.
This means that vertically, all time spent in a particular entry point is fragmented between varying levels of recursion.
Details
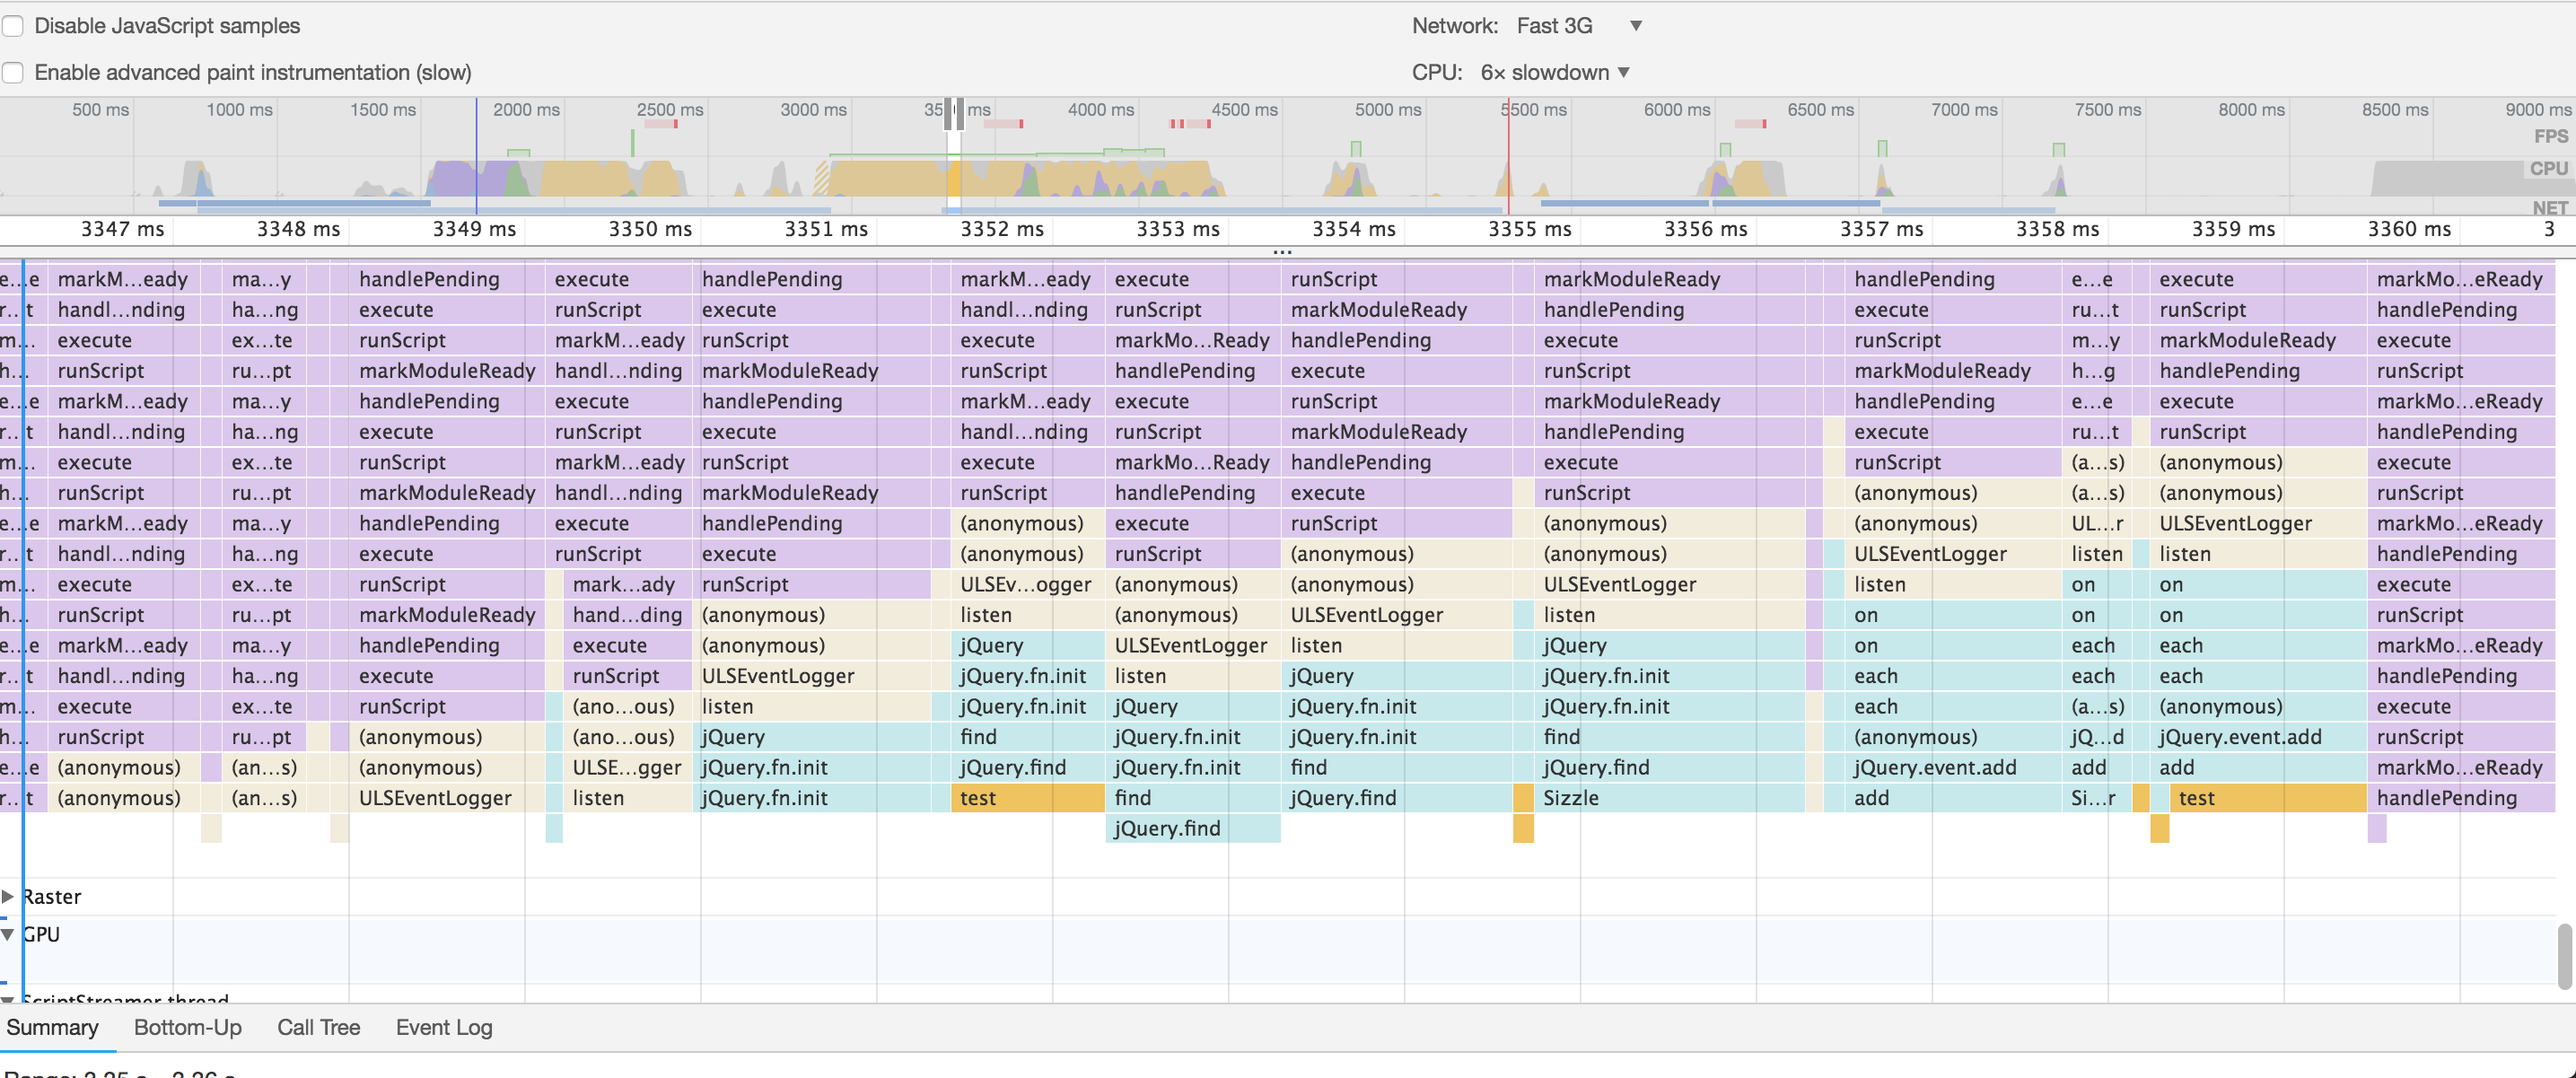
The current way that one module executes after another makes for very difficult debugging and very deep and inconsistent stacks.
For example, here is a "normal" timeline of 19 simple script-only modules executing one after the other.
Which is effectively
execute() # module 1
 runScript() # module 1
  markModuleReady() #module 1
   handlePending()
    execute() # module 2
     runScript() # module 2
      markModuleReady() # module 2
       handlePending()
        execute() #module 3
          ..
and so on.
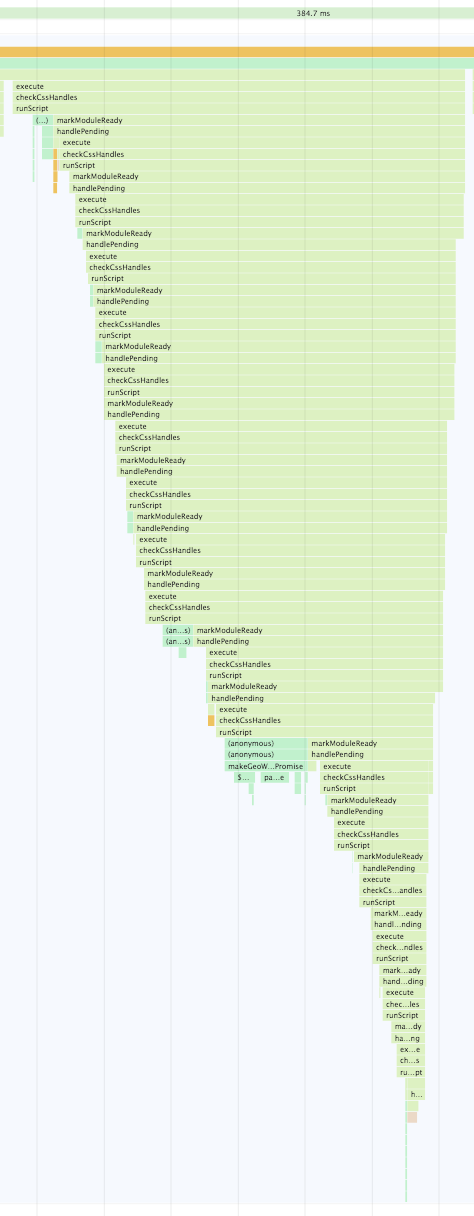
This would be much simpler to debug and understand the performance of, if after the end of execute(), it would resume the outer handlePending() rather than starting another one inside of it.
Outcome
- The stack in which runScript() is called, should not start from "Animation frame fired" (requestAnimationFrame). Instead, it should start from an event (e.g. script response directly), or from requestIdleCallback.
- The stack should not involve a runScript call inside another runScript call. Instead, when the next module is invoked, it should start again from the higher level in the stack, presumably the same layer that initiated the previous runScript.