Page MenuHomePhabricator

Mcrouter periodically reports soft TKOs for mc1029 (was mc1035, mc1022) leading to MW Memcached exceptions
Closed, ResolvedPublicPRODUCTION ERROR

Description

Icinga periodically reports Mediawiki Memcached exceptions that usually auto-resolve in a couple of minutes. Each time this is the workflow followed to narrow down the root cause:

It usually contains something like:

Sep  7 12:04:27 mw1342 mcrouter[48145]: I0907 12:04:27.248368 48146 ProxyDestination.cpp:453] 10.64.48.157:11211 marked soft TKO. Total hard TKOs: 0; soft TKOs: 1. Reply: mc_res_timeout
Sep  7 12:04:41 mw1342 mcrouter[48145]: I0907 12:04:41.204443 48146 ProxyDestination.cpp:453] 10.64.48.157:11211 unmarked TKO. Total hard TKOs: 0; soft TKOs: 0. Reply: mc_res_ok

The soft TKO is always for 10.64.48.157, that is mc1035.

What is a TKO? -> https://github.com/facebook/mcrouter/wiki/Features#health-checkauto-failover

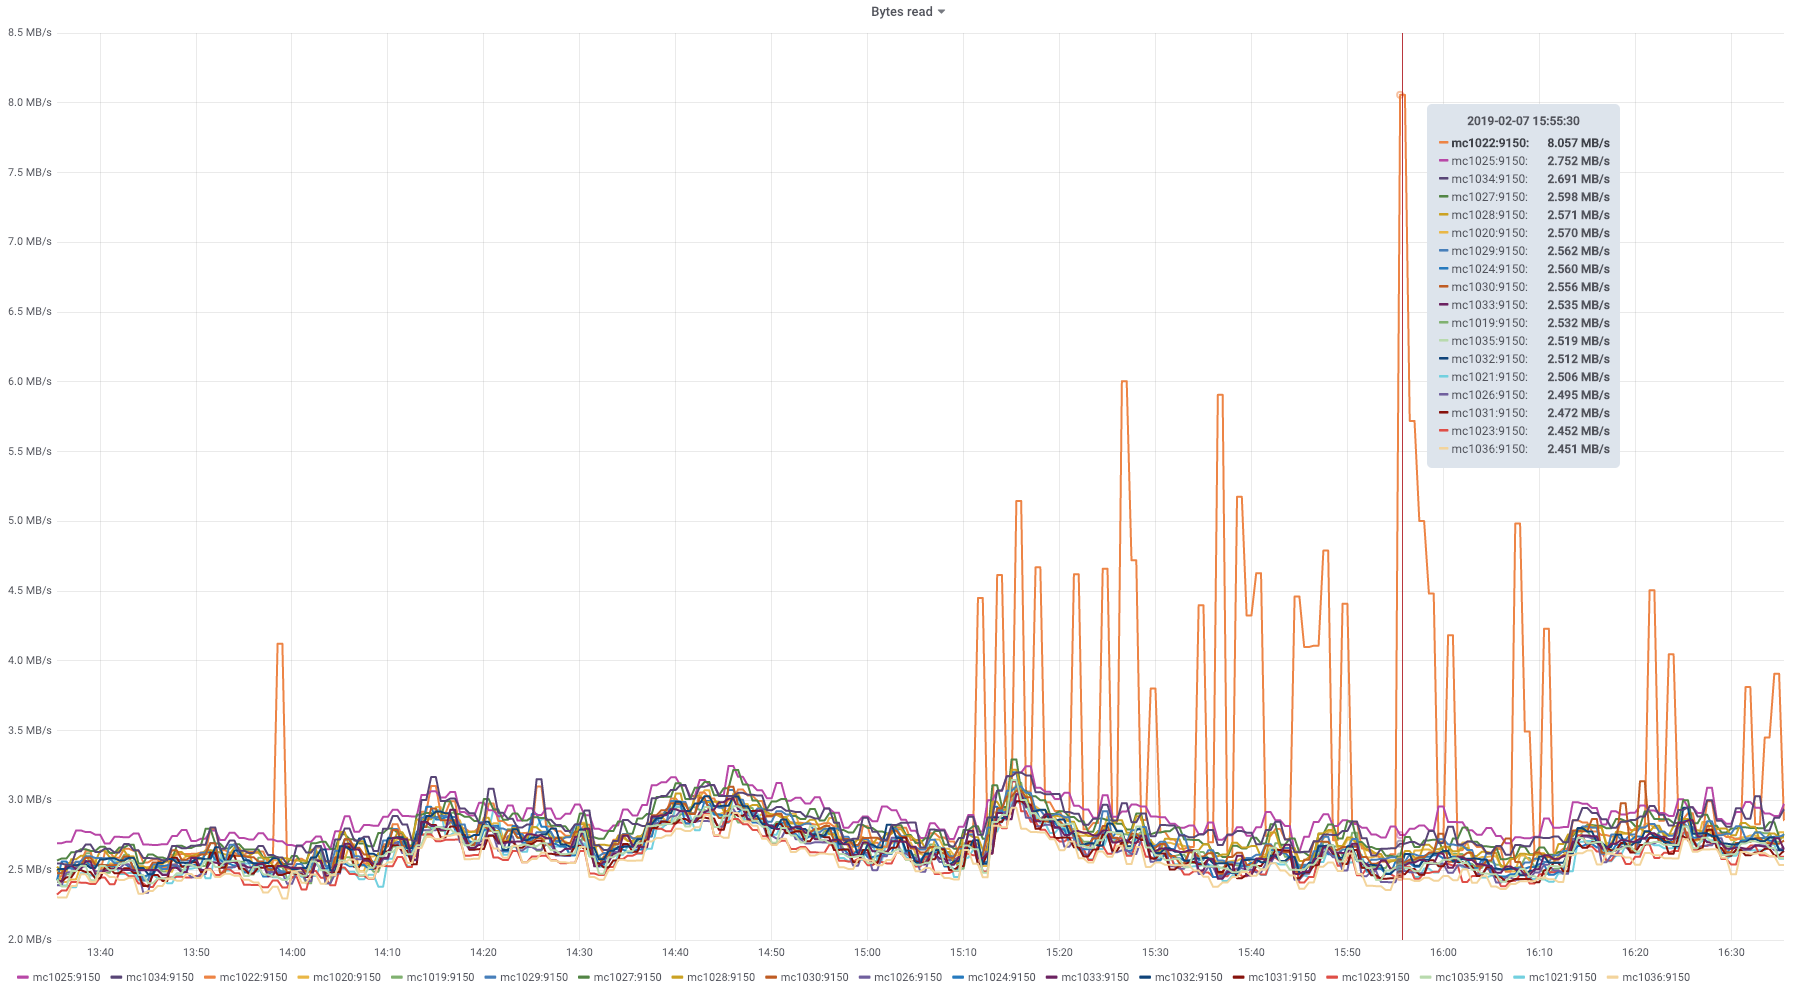
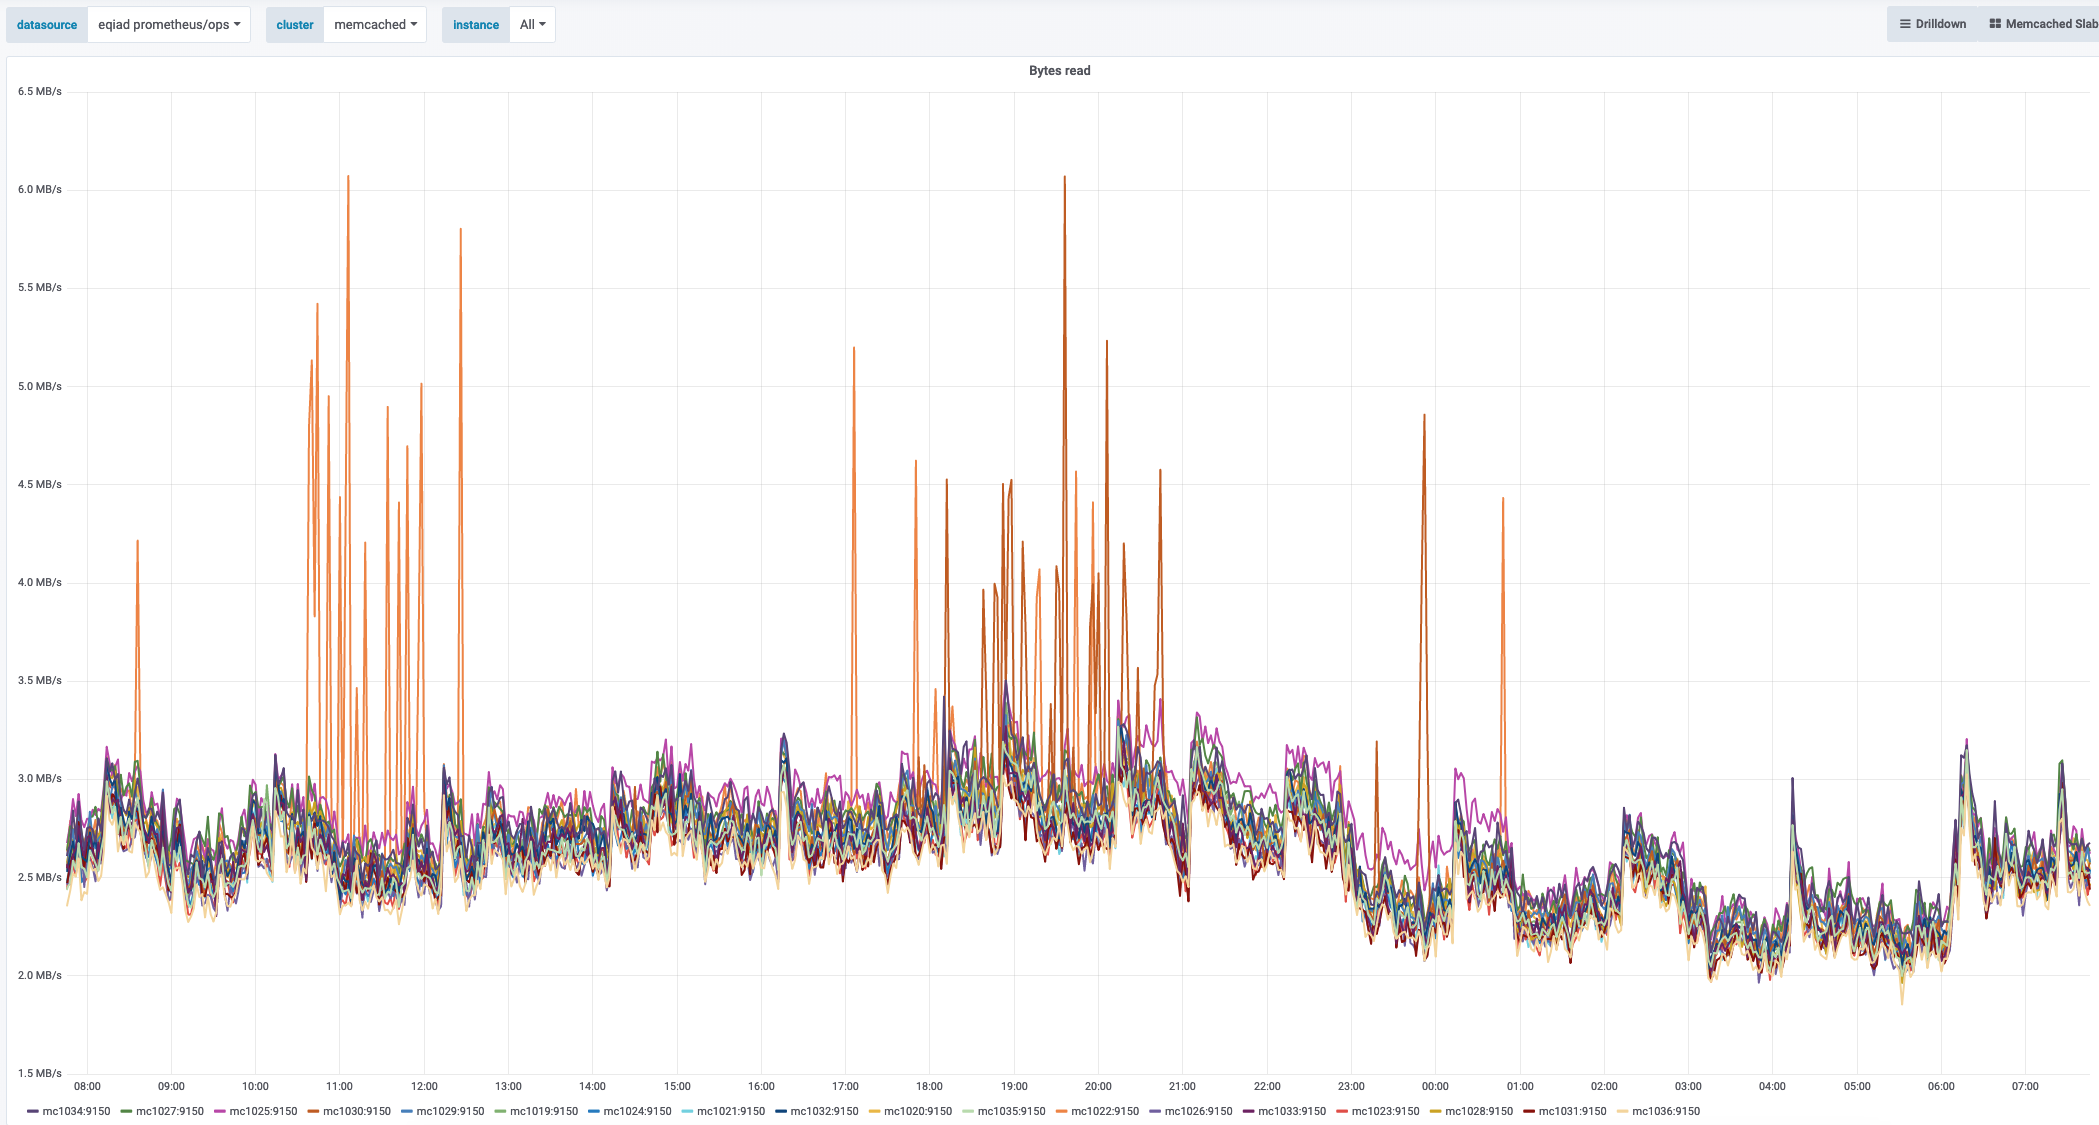
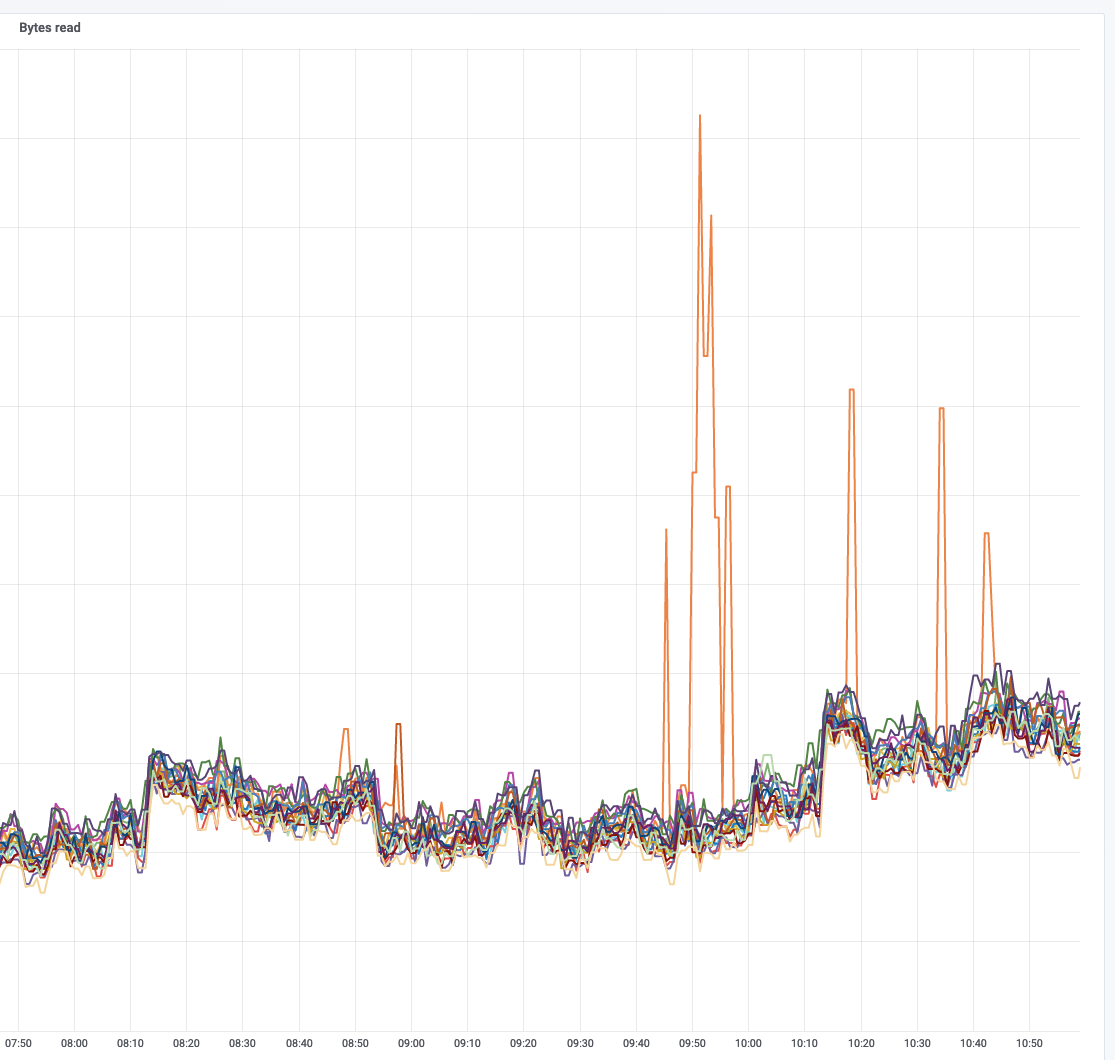
This graph shows an unusual amount of SETs to a specific slab slot, and the key highlighted the most from memtop and logstash seems to be related to WANCache:t:commonswiki:gadgets-definition and WANCache:m:commonswiki:gadgets-definition:9:2.

There has been some discussion between @Joe and @Krinkle about this issue on IRC, I tried to report everything in this description but I am not sure if it is complete or not :)

Details

SubjectRepoBranchLines +/-
mediawiki/coremaster+2 -81
operations/puppetproduction+1 -7
operations/puppetproduction+17 -1
mediawiki/extensions/VisualEditormaster+25 -3
mediawiki/coremaster+25 -11
mediawiki/corewmf/1.33.0-wmf.23+25 -0
operations/puppetproduction+2 -5
mediawiki/coremaster+25 -0
mediawiki/coremaster+256 -130
mediawiki/extensions/Translatemaster+1 -0
mediawiki/corewmf/1.33.0-wmf.18+85 -32
mediawiki/coremaster+85 -32
mediawiki/coremaster+2 -1
mediawiki/extensions/Translatemaster+37 -36
mediawiki/extensions/Translatemaster+6 -11
operations/puppetproduction+2 -2
mediawiki/extensions/Translatemaster+88 -64
operations/puppetproduction+1 -1
mediawiki/extensions/Translatemaster+1 -1
operations/puppetproduction+7 -0
mediawiki/extensions/Gadgetsmaster+2 -2
operations/puppetproduction+9 -0
mediawiki/extensions/Gadgetsmaster+4 -1
operations/puppetproduction+2 -0
operations/puppetproduction+19 -4
operations/puppetproduction+19 -1
Show related patches Customize query in gerrit

Related Objects

Event Timeline

There are a very large number of changes, so older changes are hidden. Show Older Changes

Change 487622 merged by jenkins-bot:
[mediawiki/core@master] objectcache: avoid duplicate set() calls with lockTSE when no value is in cache

https://gerrit.wikimedia.org/r/487622

Next step:

  • ssh to mc1022 and execute echo "delete WANCache:v:metawiki:translate-groups" | nc -q 1 localhost 11211
  • observe network traffic and slab statistics + logstash errors

I confirm that this simple repro case triggers all the problems that we are seeing, so it seems that the root cause are indeed memcached evictions not handled properly by the object cache. https://gerrit.wikimedia.org/r/487622 should hopefully be a good last fix (fingers crossed!).

So group 1 has been deployed (that should contain metawiki) and so far I keep seeing the same problem:

Screen Shot 2019-02-07 at 5.50.51 PM.png (990×1 px, 362 KB)

Change 468363 abandoned by Elukey:
mcrouter: allow to tune server timeout and timeouts until tko

https://gerrit.wikimedia.org/r/468363

@aaron Any more ideas about what could be tuned to make this work? I am also wondering if https://gerrit.wikimedia.org/r/487622 should work out of the box or if a change is in the translation extension is needed to make the lockTSE logic working?

@aaron Any more ideas about what could be tuned to make this work? I am also wondering if https://gerrit.wikimedia.org/r/487622 should work out of the box or if a change is in the translation extension is needed to make the lockTSE logic working?

There should be no other changes needed. I realize the change is probably inert for us, since $isHot will be false in the relevant cases (e.g. no value at the key at all). It only helps for the "key is a tombstone and no interim key exists" case and not the "key does not exist at all case" (e.g. eviction). I'll need another patch for that.

Change 490527 had a related patch set uploaded (by Aaron Schulz; owner: Aaron Schulz):
[mediawiki/core@master] objectcache: avoid duplicate cache sets for missing keys with lockTSE

https://gerrit.wikimedia.org/r/490527

Change 490527 merged by jenkins-bot:
[mediawiki/core@master] objectcache: avoid duplicate cache sets for missing keys with lockTSE

https://gerrit.wikimedia.org/r/490527

Change 491795 had a related patch set uploaded (by Krinkle; owner: Aaron Schulz):
[mediawiki/core@wmf/1.33.0-wmf.18] objectcache: avoid duplicate cache sets for missing keys with lockTSE

https://gerrit.wikimedia.org/r/491795

Mentioned in SAL (#wikimedia-operations) [2019-02-22T07:28:01Z] <elukey> manually delete WANCache:v:metawiki:translate-groups from memcache on mc1022 to test fix for T203786

Some awesome news - the test that I did above didn't end up in a spike in timeouts or memcache bytes read!

There is something that I don't explain though:

Screen Shot 2019-02-22 at 8.46.07 AM.png (1×2 px, 533 KB)

The deployment happened, according to the SAL at around 20:18 UTC. I can see spikes in bytes read even nearly after that, that we can probably not consider, but then I can see two spikes for mc1022 and one for mc1030 later on. I checked and the last two (the biggest ones) caused TKOs. I checked the related slabs (mc1022:168 and mc1030:154) and they both show evictions around the time of the spikes in memcache bytes read. I am wondering if there is one last corner case that needs to be fixed, but let's check during the following days how many spikes we'll get.

Great work Aaron!

It definitely keeps happening:

Screen Shot 2019-02-22 at 12.00.37 PM.png (1×1 px, 220 KB)

I missed the fact that the last patch merged was for mw core master branch, https://gerrit.wikimedia.org/r/#/c/mediawiki/core/+/491795/ is a cherry pick for the current (deployed) version that Timo needs to roll out. So the last fix still need to be tested.

Interesting that my manual drop of the key didn't trigger any problem though!

Anyway, waiting for the (hopefully) last patch to be deployed :)

Change 491795 merged by jenkins-bot:
[mediawiki/core@wmf/1.33.0-wmf.18] objectcache: avoid duplicate cache sets for missing keys with lockTSE

https://gerrit.wikimedia.org/r/491795

Mentioned in SAL (#wikimedia-operations) [2019-02-25T18:44:53Z] <krinkle@deploy1001> Synchronized php-1.33.0-wmf.18/includes/libs/objectcache/WANObjectCache.php: rMW79a1593cae48 / T203786 (duration: 00m 48s)

Took a look to some metrics and so far everything seems really good:

Screen Shot 2019-02-26 at 1.32.07 PM.png (1×2 px, 334 KB)

Timo deployed Aaron's path at around 18:45 UTC, it is really nice to see how the bytes_read spikes are basically gone. This is also confirmed by the absence of spikes for CAS non-hit from the related mc1022 slab.

In https://grafana.wikimedia.org/d/000000614/memcache-elukey?orgId=1&panelId=11&fullscreen&edit&from=now-24h&to=now I am also seeing some activity related to the new cooloff_bounce object cache metric.

Last but not the least, TKOs registered by the api-appservers:

https://grafana.wikimedia.org/d/000000549/mcrouter?panelId=9&fullscreen&orgId=1&var-source=eqiad%20prometheus%2Fops&var-cluster=api_appserver&var-instance=All&from=now-24h&to=now

In this case I do see a spike during the EU morning for mc1022, and the logs confirm:

Feb 26 09:44:17 mw1348 mcrouter[34534]: I0226 09:44:17.697255 34535 ProxyDestination.cpp:453] 10.64.0.83:11211 marked soft TKO. Total hard TKOs: 0; soft TKOs: 1. Reply: mc_res_timeout
Feb 26 09:44:21 mw1348 mcrouter[34534]: I0226 09:44:21.116739 34535 ProxyDestination.cpp:453] 10.64.0.83:11211 unmarked TKO. Total hard TKOs: 0; soft TKOs: 0. Reply: mc_res_ok

Feb 26 10:07:04 mw1348 mcrouter[34534]: I0226 10:07:04.627399 34535 ProxyDestination.cpp:453] 10.64.0.83:11211 marked soft TKO. Total hard TKOs: 0; soft TKOs: 1. Reply: mc_res_timeout
Feb 26 10:07:08 mw1348 mcrouter[34534]: I0226 10:07:08.374341 34535 ProxyDestination.cpp:453] 10.64.0.83:11211 unmarked TKO. Total hard TKOs: 0; soft TKOs: 0. Reply: mc_res_ok

But for this event (that impacted a few apis) I only see a correspondent spike in GET requests (for the two time window outlined above), that might be unavoidable due to how big the key is. Will keep metrics monitored but so far it seems a big improvement.

Change 493148 had a related patch set uploaded (by Aaron Schulz; owner: Aaron Schulz):
[mediawiki/core@master] objectcache: optimize WAN cache key updates during HOLDOFF_TTL

https://gerrit.wikimedia.org/r/493148

The callback/get-set-cycle delay metric at https://graphite.wikimedia.org/render/?width=1162&height=586&_salt=1551241484.127&uniqueLegend=true&hideLegend=false&from=-24hours&target=highestMax(MediaWiki.wanobjectcache.*.regen_set_delay.p75%2C5) suggests that the translate key is sometimes 10+ seconds, which overruns the WANObjectCache::LOW_TTL constant. I can try bumping it for that caller.

Taking longer to renegerate than the "lowTTL" parameter means that preemptive regeneration will sometimes not happen in time and the key will suddenly fall out due to its memcached TTL.

Change 493149 had a related patch set uploaded (by Aaron Schulz; owner: Aaron Schulz):
[mediawiki/extensions/Translate@master] Bump "lowTTL" cache option in getCachedGroupDefinitions()

https://gerrit.wikimedia.org/r/493149

Change 493149 abandoned by Aaron Schulz:
Bump "lowTTL" cache option in getCachedGroupDefinitions()

Reason:
Ah, good catch! I forgot that I bumped it back in I2e4372bf4c6d28d09347012926d8c0a9deda4183

https://gerrit.wikimedia.org/r/493149

I wonder if --target-max-inflight-requests/--target-max-pending-requests should be adjusted to flatten traffic spikes to specific servers a bit.

My 2 cents:

  • from this graph (mw1344's mcrouter ops, picked at random) it seems that every mcrouter instance handles ~100 ops. We mark a shard as TKO after 3x1s timeouts, that seems really sensitive compared to the dramatic action (and consequence) that it will be taken (basically fail traffic to one shard for some seconds). We will work on the "gutter" pool (hopefully soon), but even relying fully on it is not the best way to go in my opinion (in fact I'd love to see the gutter pool used only occasionally for sporadic failures, not regularly).
  • It was the same setting that we had with nutcracker (3x1s timeouts), but in that case we had the auto-re-shard/failover mechanism that was masking the problem (I think).
  • a 400K key (that can potentially grow more and more) with this amount of traffic is really dangerous, so T213802 is probably the best thing to fix first. I am afraid that we'd risk to over-optimize mcrouter leaving "easy" wins aside (like say reducing the key size by 50/60% in this case).

There is one thing that I don't get from the metrics. The last mcrouter TKO stream (that, to be clear, it has been reduced a lot!) happened around 22:50 UTC (February 27th). I checked the mc1022:slab-168's metrics and I can see the following:

  • CAS non-hit rate (basically the CAS ended up with a failure) went down from previous peaks of MBs to KBs (that is incredibly good).
  • Some evictions happened at that time, so probably the translate key was involved.
  • GET requests peak to ~40MBs

Is there a reason for a peak of GET like that? I know that the key is requested frequently, but I would have expected only a rise in CAS when an eviction happens, not in GETs (at least, the GETs should be more or less similar, in my mind, to a previous baseline). Any ideas? Is it due to how getwithsetcallback works?

getWithSetCallback() should not internally cause that. From https://graphite.wikimedia.org/render/?width=1155&height=613&_salt=1551474387.554&from=00%3A00_20190227&until=23%3A59_20190227&target=MediaWiki.wanobjectcache.translate_groups.*.*.rate at it looks like the number of calls *to* getWithSetCallback() spiked. I didn't see anything interesting in logstash.

I think that the main recurrent CAS issue is now resolved, the last occurrence of TKOs was for mc1022 but slab 159 (a big spike of thousands sets that I don't see in memcached's bytes_read, so a bit weird). The gutter pool will help but we should really figure out when SRE/Performance need to step in and investigate/fix, otherwise there are a million rabbit holes that we can get into :D

The spike in GETs (generating several MBs of traffic) happened again, adding some links to follow up:

  • mcrouter
  • mc1022 slab 168 (from the mcrouter logs mc1022 was the culprit, and definitely slab 168's traffic matches the mcrouter impact).

I have done something like echo "stats cachedump 168 400" | nc -q 1 localhost 11211 > dump.txt and then cat dump.txt | grep -v END | cut -d " " -f 2,5| sort -n -k 2| awk '{printf("%s ",$1) ; system("date -d @"$2)}' right after the impact to have an idea about TTLs (assuming 24h TTLs it is easy to see the keys generated).

WANCache:v:metawiki:translate-groups Tue Mar  5 17:53:17 UTC 2019  --> definitely evicted

translate-groups was the only one with a March 5th TTL and time around the impact.. I can say that the issue is definitely not on CAS anymore, since the traffic is really low for that, and I don't see anymore spikes in bytes_read from memcached, so it must be the spike in GETs generating this issue. It seems correlated with evictions, but I don't have more ideas..

Some TKOs happened also at around 3:33 UTC this morning (March 5th), so I took a look to some of the apache httpd logs of the appservers getting timeouts and I found out something interesting (that I brought up also a while ago IIRC). When the rise of GETs happens, I can clearly see a ton of POSTs to meta.wikimedia.org interleaved by GETs following this format:

https://meta.wikimedia.org/w/api.php?format=json&action=query&prop=info%7Crevisions&rawcontinue=1&rvprop=content%7Cids%7Ctimestamp%7Csize%7Csha1%7Ccontentmodel&rvslots=main&revids=18797943

I had a chat with @Nikerabbit and he explained that Parsoid parsing pages can be due to a number of reasons/use-cases, for example when a page is re-marked for translation by an admin mediawiki inserts a TranslateRenderJob for the page in the Job Queue, that in turn means an update of all the translated pages (can be dozens).

I tried to compare TKOs vs TranslateJob events (enqueued in Kafka), there seems to be some correlation but not a real 1:1 match:

https://grafana.wikimedia.org/d/000000614/memcache-elukey?orgId=1&panelId=1&fullscreen&from=now-2d&to=now

Anyway, let's focus on reducing the size of the translate-groups key and see after that how it goes :)

Change 493148 merged by jenkins-bot:
[mediawiki/core@master] objectcache: optimize WAN cache key updates during HOLDOFF_TTL

https://gerrit.wikimedia.org/r/493148

@aaron if you have time can you explain what https://gerrit.wikimedia.org/r/493148 does? I didn't get the "spam" reference in the description of the change: does it mean removing actual ADD/GET commands sent to Memcached?

It reduces set()/setInterimKey() calls to volatile (recently invalidated) keys. Each of those calls translates into a GET/CAS since they use merge(). I don't think it will prevent the huge GET spikes we saw (since most did not correspond to CAS and were probably not merge() calls).

Today I have executed some tests on mw2222 and the codfw shards and I was able to trigger a mcrouter TKO. These are the scripts that I have executed in parallel (they are horrible I know but style wasn't a priority :D):

  • Bursts of CAS commands with a ~400k key
#!/bin/bash

data="AAAAAAAAAAAAAAAAAAAAAAAAAAAAAAAAAAAAAAAAAAAAAAAAAAAAAAAAAAAAAAAAAAAAAAAAAAAAAAAAAAAAAAAAAAAAAAAAAAAAAAAAAAAAAAAAAAAAAAAAAAAAAAAAAAAAAAAAAAAAAAAAAAAAAAAAAAAAAAAAAAAAAAAAAAAAAAAAAAAAAAAAAAAAAAAAAAAAAAAAAAAAAAAAAAAAAAAAAAAAAAAAAAAAAAAAAAAAAAAAAAAAAAAAAAAAAAAAAAAAAAAAAAAAAAAAAAAAAAAAAAAAAAAAAAAAAAAAAAAAAAAAAAAAAAAAAAAAAAAAAAAAAAAAAAAAAAAAAAAAAAAAAAAAAAAAAAAAAAAAAAAAAAAAAAAAAAAAAAAAAAAAAAAAAAAAAAAAAAAAAAAAAAAAAAAAAAAAAAAAAAAAAAAAAAAAAAAAAAAAAAAAAAAAAAAAAAAAAAAA"

length=${#data}
command="set testelukey 0 900 ${length}\n${data}"

echo -e "\nTEST LEN: ${length}"

time (echo -e $command | nc -q 1 localhost 11213)

for el in {1..10}; do data="${data}${data}"; done

length=${#data}
token_command="echo gets testelukey |nc -q 1 localhost 11213 | head -n 1 | cut -d \" \" -f 5"
echo -e "\nTEST LEN: ${length}"

for el in {1..1000}
do
   token=$(eval $token_command)
   command="cas testelukey 0 900 ${length} ${token}\n${data}"
   time (echo -e $command | nc -q 1 localhost 11213) &
done
  • Bursts of GETs commands for the same key
#!/bin/bash

for el in {1..1000}
do
   time (echo "get testelukey" | nc -q 1 localhost 11213 > /dev/null) &
done

If I execute the first (CAS burst) alone everything works fine and I get constant client timings, all like this:

real	0m0.081s
user	0m0.076s
sys	0m0.012s

Not that I get also some EXISTS response from memcached, that should be a sign of the CAS racing to update the same value (so not only doing that in a simple sequential way - note the & at the end of the command).

If I run the second in isolation, I get a rapid increase of time up to 1s, ending up in:

Mar 25 08:23:10 mw2222 mcrouter[17659]: I0325 08:23:10.869783 17660 ProxyDestination.cpp:453] 10.192.0.83:11211 marked soft TKO. Total hard TKOs: 0; soft TKOs: 1. Reply: mc_res_timeout
Mar 25 08:23:14 mw2222 mcrouter[17659]: I0325 08:23:14.817100 17660 ProxyDestination.cpp:453] 10.192.0.83:11211 unmarked TKO. Total hard TKOs: 0; soft TKOs: 0. Reply: mc_res_ok

I run the tests bypassing mcrouter (so hitting mc2019 directly) I can get the same result. Interesting that for the latter (GET bursts) I can see timings get up to 2s.

Also very interesting that if I removed the & from the GET burst I get a very nice, consistent and fast execution for all the commands:

real	0m0.008s
user	0m0.000s
sys	0m0.000s

Today I've ran tcpdump on mc1022 and stopped when a TKO event happened:

Mar 25 14:58:51 mw1225 mcrouter[40220]: I0325 14:58:51.021003 40223 ProxyDestination.cpp:453] 10.64.0.83:11211 marked soft TKO. Total hard TKOs: 0; soft TKOs: 1. Reply: mc_res_timeout
Mar 25 14:58:54 mw1225 mcrouter[40220]: I0325 14:58:54.325156 40223 ProxyDestination.cpp:453] 10.64.0.83:11211 unmarked TKO. Total hard TKOs: 0; soft TKOs: 0. Reply: mc_res_ok

This is the GET traffic registered for the translate-groups key:

  1 14:58:02
  1 14:58:03
  1 14:58:04
  1 14:58:13
  1 14:58:15
  1 14:58:18
  1 14:58:19
  2 14:58:22
  1 14:58:24
  1 14:58:34
  2 14:58:36
  1 14:58:39
  2 14:58:41
  1 14:58:43
  2 14:58:44
  1 14:58:47
  1 14:58:48
179 14:58:49
144 14:58:50
 14 14:58:51
  8 14:58:52
 81 14:58:53
224 14:58:54
 93 14:58:55
 92 14:58:56
107 14:58:57
  9 14:58:58
  1 14:59:06
  1 14:59:11
  2 14:59:17
  1 14:59:18
  2 14:59:21
  1 14:59:22
  1 14:59:27
  1 14:59:28
  2 14:59:29
  1 14:59:30
  3 14:59:35
  1 14:59:39
  2 14:59:41
  1 14:59:44
  1 14:59:47
  1 14:59:48

The requests came from multiple api-appservers, not a specific one.

Traffic from mw1225 (only translate-groups key):

14:58:49 - 10.64.48.60 => 48 bytes b'gets WANCache:v:metawiki:translate-groups\r\n'
14:58:50 - 10.64.48.60 => 48 bytes b'gets WANCache:v:metawiki:translate-groups\r\n'
14:58:54 - 10.64.48.60 => 48 bytes b'gets WANCache:v:metawiki:translate-groups\r\n'

14:58:54 - 10.64.48.60 => 24701 bytes b'cas WANCache:v:metawiki:translate-groups 52 86400 389111 6556847198 [..]'

14:58:54 - 10.64.48.60 => 48 bytes b'gets WANCache:v:metawiki:translate-groups\r\n'
14:58:55 - 10.64.48.60 => 48 bytes b'gets WANCache:v:metawiki:translate-groups\r\n'

14:58:55 - 10.64.48.60 => 16430 bytes b'add WANCache:v:metawiki:translate-groups 52 86400 389111\r\n [..]

14:58:55 - 10.64.48.60 => 48 bytes b'gets WANCache:v:metawiki:translate-groups\r\n'
14:58:56 - 10.64.48.60 => 48 bytes b'gets WANCache:v:metawiki:translate-groups\r\n'
14:58:57 - 10.64.48.60 => 48 bytes b'gets WANCache:v:metawiki:translate-groups\r\n'

Even more interesting, is that if I run the GET bursts script on mc2019 in localhost, I cannot see latencies rising.. So it could be a problem of the 1g link saturated, even if I don't see any sign of it in the switch's metrics.

Change 499045 had a related patch set uploaded (by Aaron Schulz; owner: Aaron Schulz):
[mediawiki/core@master] Prune old edit stash entries from users as they create more

https://gerrit.wikimedia.org/r/499045

Tried with ifstat to monitor the interface on mc2019 when the burst of GETs happened, and this is the result:

elukey@mc2019:~$ ifstat  -n -b
       eth0
 Kbps in  Kbps out
  699.46    166.11
  755.43    199.69
  725.92    196.64
  924.83    214.24
  839.49    191.80
  747.60    161.80
 6535.12  598594.4
 9915.87  985499.7        <======
10161.01  985410.2       <======
    0.00      0.00
 9734.97  985820.9        <======
 3222.86  299138.6
  430.07    106.62
  351.33    115.98
  372.98    102.52
  608.64    164.31
  409.65    114.61
  611.71    190.20
  469.69    119.03
  801.58    205.34
  750.96    188.19
  968.60    276.43
 1075.30    250.17
  799.29    184.31
  838.02    201.75
  436.35     98.52

Change 472099 had a related patch set uploaded (by Elukey; owner: Elukey):
[operations/puppet@production] role::memcached: apply interface::rps to all the hosts

https://gerrit.wikimedia.org/r/472099

Mentioned in SAL (#wikimedia-operations) [2019-03-26T11:21:57Z] <elukey> temporary install ifstat on mc1022 + tmux session to log in/out bandwidth usage every 1s for T203786

Some TKOs happened from 11:38 to 11:44 UTC:

https://grafana.wikimedia.org/d/000000549/mcrouter?panelId=9&fullscreen&orgId=1&var-source=eqiad%20prometheus%2Fops&var-cluster=api_appserver&var-instance=All&from=1553600001901&to=1553600788145

From ifstat:

  Time           eth0
HH:MM:SS   Kbps in  Kbps out

11:38:00  40701.01  129543.5
11:38:01  44449.36  134787.5
11:38:02  42748.98  128031.3
11:38:03  44784.41  137569.7
[..]
11:38:22  39861.78  129557.3
11:38:23  43144.97  134886.1

11:38:24  39631.96  471084.7      <==========
11:38:25  56780.43  983517.4      <==========
11:38:26  51610.77  479600.7      <==========

11:38:27  46484.13  328694.3
11:38:28  40915.30  249095.3
11:38:29  38555.13  133495.3
11:38:30      0.00      0.00
11:38:31  43288.78  118981.2
11:38:32  39457.21  124233.6
11:38:33  38421.00  121141.8
11:38:34  41407.58  200029.9

11:38:35  42833.03  620886.0      <==========

11:38:36  38288.99  238971.4
11:38:37  40293.89  131664.7
11:39:13  41625.14  148276.5
11:39:14  41003.10  175592.7
11:39:15      0.00      0.00

11:39:16  52116.48  938330.3      <==========
11:39:17  62327.80  805628.2      <==========

11:39:18  49905.04  365858.3
11:39:19  47352.13  368891.8
11:39:20  38164.95  162290.7
11:39:21  37491.73  117768.2
11:39:22  41106.63  127165.2
11:39:23  40346.70  118750.9
11:39:24  39184.44  121348.3

11:39:25  42042.17  499499.0      <==========

11:39:26  40631.41  364676.2
[..]
11:40:27  42507.43  156967.3

11:40:28  45826.00  425777.9      <==========
11:40:29  46970.40  668367.0      <==========
11:40:30  45710.05  620797.7      <==========
11:40:31  45233.12  519147.3      <==========

11:40:32  41751.40  278781.0
11:40:33  41380.39  171880.2
11:40:34  37473.15  142011.2
11:40:35  36516.74  134892.6
11:40:36  40406.70  413306.4      <==========
11:40:37  43500.59  439517.2      <==========
11:40:38  43203.87  471677.7      <==========
11:40:39  44168.34  550864.0      <==========
11:40:40  43853.24  456392.2      <==========
11:40:41  39964.65  225497.6
11:40:42  43753.80  186900.6
11:40:43  37768.62  183876.3
11:40:44      0.00      0.00
11:40:45  43615.51  434141.5      <==========
11:40:46  45100.46  402164.1      <==========
11:40:47  46025.57  569820.9      <==========
11:40:48  44190.61  434615.4      <==========
11:40:49  40504.72  207472.3
[..]
11:42:53  40207.67  130555.0
11:42:54  39057.81  124635.9
11:42:55  41054.70  129300.7
11:42:56  44568.26  141688.9
11:42:57  40536.00  124253.2
11:42:58  42762.54  135203.0
11:42:59      0.00      0.00
11:43:00  40818.66  135722.1
11:43:01  43794.43  134618.4
11:43:02  43950.96  151185.4
11:43:03  44689.61  143516.9
11:43:04  42900.94  143018.7
11:43:05  46277.64  137679.5
11:43:06  39135.83  125898.6
11:43:07  41117.86  146446.3

11:43:08  46597.35  933560.3      <==========

11:43:09  53968.11  493137.2      <==========
11:43:10  43227.09  148739.2
11:43:11  37343.55  118132.5
11:43:12  34813.70  115277.4
11:43:13  35568.13  109410.6
11:43:14  36220.38  119105.1
11:43:15  38939.67  115100.8
11:43:16  40924.88  122423.6

It is easy to see how the mc1022's interface out traffic sometimes gets up to ~1Gbps, saturating the link and triggering mcrouter timeouts.

It seems that we found the root cause of the problem, namely keys bigger than 200k (from my tests) with a sufficient high traffic volume can cause saturations of the memcached host's interface (traffic going out of the host). The perfect solution would be to have 10g interfaces, but this is more a long term solution that a short/medium one. I propose to keep going with the efforts to reduce the translate-groups key as much as possible, together with possibly figuring out why those bursts happen (the current theory is a burst of calls from Parsoid).

Change 499331 had a related patch set uploaded (by Krinkle; owner: Aaron Schulz):
[mediawiki/core@wmf/1.33.0-wmf.23] Prune old edit stash entries from users as they create more

https://gerrit.wikimedia.org/r/499331

Change 499045 merged by jenkins-bot:
[mediawiki/core@master] Prune old edit stash entries from users as they create more

https://gerrit.wikimedia.org/r/499045

Change 472099 merged by Elukey:
[operations/puppet@production] role::memcached: apply interface::rps to all the hosts

https://gerrit.wikimedia.org/r/472099

Mentioned in SAL (#wikimedia-operations) [2019-03-27T15:19:25Z] <elukey> slowly rolling out interface::rps to all the mcXXXX nodes - T203786

Mentioned in SAL (#wikimedia-operations) [2019-03-27T16:38:30Z] <elukey> mc20XX and mc1022 have interface::rps enabled - T203786

Mentioned in SAL (#wikimedia-operations) [2019-03-27T18:10:16Z] <elukey> interface::rps applied to all the mc10XX hosts - T203786

Change 499331 merged by jenkins-bot:
[mediawiki/core@wmf/1.33.0-wmf.23] Prune old edit stash entries from users as they create more

https://gerrit.wikimedia.org/r/499331

Mentioned in SAL (#wikimedia-operations) [2019-03-28T00:21:45Z] <krinkle@deploy1001> Synchronized php-1.33.0-wmf.23/includes/api/ApiStashEdit.php: Ic357dbfcd9ab / T203786 (duration: 00m 57s)

Change 499693 had a related patch set uploaded (by Aaron Schulz; owner: Aaron Schulz):
[mediawiki/core@master] objectcache: make WANObjectCache use ADD over GET/CAS simple misses

https://gerrit.wikimedia.org/r/499693

Change 499693 merged by jenkins-bot:
[mediawiki/core@master] objectcache: make WANObjectCache prefer ADD over GET/CAS for misses

https://gerrit.wikimedia.org/r/499693

Change 499846 had a related patch set uploaded (by Aaron Schulz; owner: Aaron Schulz):
[mediawiki/extensions/VisualEditor@master] Avoid keeping excess keys from storeInSerializationCache() in cache

https://gerrit.wikimedia.org/r/499846

Summary of what each team is currently working on:

  • SRE - we discovered 1G NIC interfaces for memcached are not enough for some use cases, namely big keys accessed frequently (the bandwidth of outgoing traffic from the mc hosts is saturated for few seconds periodically). A possible solution could be to add 10G interfaces to the mc hosts, but this would required invasive maintenance/downtime. Until we resolve T208934 this idea is probably not viable.
  • Performance - https://gerrit.wikimedia.org/r/499693 should help in avoiding gets requests to memcached to get the key's token needed for subsequent cas commands. This should help a lot in reducing bandwidth usage. Aaron is also working on automatically purging big keys to ease the pressure of some slabs and avoid evictions (the translate-groups key may be co-located in the same slab).
  • Language - A lot of progresses in T213802, there is a patch that should be ready for the next MW train aimed to reduce the size of the translate-groups key. The name of the key will change so it will likely be hashed by mcrouter to a different memcached shard.

Change 499846 merged by jenkins-bot:
[mediawiki/extensions/VisualEditor@master] Avoid keeping excess keys from storeInSerializationCache() in cache

https://gerrit.wikimedia.org/r/499846

elukey renamed this task from Mcrouter periodically reports soft TKOs for mc1022 (was mc1035) leading to MW Memcached exceptions to Mcrouter periodically reports soft TKOs for mc1029 (was mc1035, mc1022) leading to MW Memcached exceptions.Apr 9 2019, 6:30 AM

A lot of changes went out with .wmf24, and I can see metrics differences:

https://grafana.wikimedia.org/d/000000316/memcache?orgId=1&from=1554734317253&to=1554774043127

  • CAS traffic dropped a lot (in favor of ADD)
  • GET traffic (mostly hits) increased, but probably not related to the new pruning of old keys logic added? Can't think about anything else. Maybe new keys?
  • A new translate-groups key was deployed, replacing the old one: WANCache:v:metawiki:translate-groups:v2 [301137 b; 1554885810 s]. Very nice reduction from ~400K to 300K. mcrouter's hashing stored it in mc1029 slab163

I have observed some TKOs happened a couple of hours after the deployment for the appservers apis, and all of them reported mc1029 as the problematic shard. Let's see how metrics will look like during the next days.

I have left ifstat running on all the mc1* hosts, these are the hosts showing up TX bandwidth usage >= 60%:

elukey@mc1022:~$ cat ifstat.log | awk '{print $1" "$3}' | egrep '[0-9][0-9]:[0-9][0-9]:[0-9][0-9]\ [6789][0-9]{5}'
HH:MM:SS   Kbps out
10:15:29 694392.0
10:15:30 680259.8
10:15:32 654537.0
10:15:33 646251.9
10:15:34 603199.7
22:22:42 733055.9
22:22:43 674385.2

elukey@mc1023:~$ cat ifstat.log | awk '{print $1" "$3}' | egrep '[0-9][0-9]:[0-9][0-9]:[0-9][0-9]\ [6789][0-9]{5}'
20:11:41 606637.9
15:24:27 733077.0
15:24:30 687763.6
15:24:33 609838.2
15:42:21 603708.3
16:01:57 669550.0
16:02:00 635459.4
18:24:17 664856.6
18:24:19 635535.9
18:41:53 632162.1
18:41:57 791744.5
18:41:58 697442.1
19:21:36 658028.3
19:33:29 611707.1
20:00:55 760687.7
20:46:49 633746.8
20:47:52 656273.9
20:48:39 605417.9
20:49:06 649346.2
20:49:15 641036.0
20:51:05 655218.8
20:59:40 649063.3
21:04:04 612776.5
23:26:45 624427.3
00:15:07 882679.6
01:54:00 725448.9
02:02:31 668849.4
07:54:02 678239.5
21:03:33 723811.9
22:20:05 614685.7
22:32:46 642554.4
22:33:51 702016.6
22:35:02 665824.9
22:36:08 728427.2

elukey@mc1027:~$ cat ifstat.log | awk '{print $1" "$3}' | egrep '[0-9][0-9]:[0-9][0-9]:[0-9][0-9]\ [6789][0-9]{5}'
HH:MM:SS   Kbps out
16:13:16 682321.2
16:13:18 693694.2
16:13:19 673332.8
16:13:20 628932.2
16:13:26 603088.3
16:33:40 669259.1
16:33:41 651088.7
17:14:02 624460.0
17:14:03 653440.3
17:14:04 622370.0
19:36:40 600641.3
19:36:41 636177.2
19:36:42 616653.2
19:36:43 612826.0

elukey@mc1029:~$ cat ifstat.log | awk '{print $1" "$3}' | egrep '[0-9][0-9]:[0-9][0-9]:[0-9][0-9]\ [6789][0-9]{5}'
[..]
# Only the last 24h shown, this script started way before the others
[..]
HH:MM:SS   Kbps out
00:19:14 831693.2
00:19:15 917587.3
00:19:16 842107.6
00:19:17 799194.3
00:19:18 770673.1
00:19:19 767366.7
00:19:23 615004.5
00:19:24 738827.8
00:19:25 829502.4
00:19:26 899392.8
00:19:27 775977.5
00:23:02 681301.4
00:23:03 916328.5
01:45:43 648100.2
02:29:16 722901.1
02:29:17 913113.5
02:29:18 963445.9
02:29:19 967491.2
02:29:20 959776.2
02:29:21 789879.3
02:29:22 694404.2
02:29:26 600769.9
02:29:27 688639.5
02:48:33 679360.3
02:48:34 689909.4
02:48:35 627567.2
02:48:36 729855.8
02:48:37 801266.7
02:48:38 904450.9
02:48:39 821560.8
02:48:40 734680.0
02:48:41 726970.2
02:48:42 641012.6
03:08:13 691808.5
03:08:14 872481.9
03:08:15 805637.7
03:08:16 646479.4
03:57:03 916819.2
03:57:40 965041.2
03:58:17 898599.7
04:09:07 871537.8
05:24:00 780667.5
05:24:01 981216.5
05:24:02 981771.0
05:24:03 981087.5
05:24:04 956039.2
05:24:05 726768.2
05:24:08 642311.0
05:24:09 688561.6
05:24:10 814192.2
05:24:11 803686.3
05:35:44 824453.0
05:35:45 981809.4
05:35:46 980228.0
05:35:47 940312.1
05:35:48 734471.1
05:44:26 631469.8
05:44:27 867342.6
05:44:28 771970.4
05:44:29 787446.9
05:44:30 723165.1
05:44:31 737531.5
05:44:32 682674.3
05:44:37 660153.0
05:44:38 703097.7
05:44:39 809622.5
05:44:40 705897.2
05:56:25 660291.7
05:56:26 639202.9
06:17:53 613982.8
06:17:54 651624.5

elukey@mc1030:~$ cat ifstat.log | awk '{print $1" "$3}' | egrep '[0-9][0-9]:[0-9][0-9]:[0-9][0-9]\ [6789][0-9]{5}'
HH:MM:SS   Kbps out
20:04:50 673435.4
06:57:19 653717.1
07:47:10 619705.4
09:01:29 682972.1
10:52:20 630958.1
12:23:02 651025.0
17:29:25 689902.4
20:17:56 680535.8
20:17:57 676086.4
20:17:58 725377.4
20:17:59 665003.3
20:18:00 658815.3
20:18:02 640419.7
01:06:21 645542.7
08:43:33 605582.9
09:49:34 603052.0
16:13:16 705918.0
16:13:17 756195.3
16:13:18 738974.2
16:13:19 713087.7
16:13:20 667741.4
16:13:21 607340.1
16:13:25 665851.5
16:13:26 715697.5
16:13:27 626348.9
16:33:39 727002.9
16:33:40 752063.5
16:33:41 686723.1
16:33:50 624727.8
16:33:51 600950.1

elukey@mc1031:~$ cat ifstat.log | awk '{print $1" "$3}' | egrep '[0-9][0-9]:[0-9][0-9]:[0-9][0-9]\ [6789][0-9]{5}'
HH:MM:SS   Kbps out
17:57:10 654525.1
17:57:11 672509.6
17:57:12 610388.9
17:57:18 629925.5
18:11:55 709341.8
18:11:56 753520.9
18:11:57 706459.1
18:11:58 606235.5
18:12:07 602013.5
18:28:28 696726.3
18:28:29 772988.0
18:28:30 775883.9
18:28:31 649574.7
18:28:35 639262.4
18:28:36 610591.7
18:44:57 663823.0
18:44:58 746798.3
18:44:59 696619.8
18:46:51 681341.7
18:46:52 668121.2
18:58:42 614932.9
18:58:43 653807.4
18:58:44 609168.8

elukey@mc1032:~$ cat ifstat.log | awk '{print $1" "$3}' | egrep '[0-9][0-9]:[0-9][0-9]:[0-9][0-9]\ [6789][0-9]{5}'
HH:MM:SS   Kbps out
19:49:09 647631.2

elukey@mc1033:~$ cat ifstat.log | awk '{print $1" "$3}' | egrep '[0-9][0-9]:[0-9][0-9]:[0-9][0-9]\ [6789][0-9]{5}'
HH:MM:SS   Kbps out
17:29:20 633552.6
17:29:21 603253.9

elukey@mc1035:~$ cat ifstat.log | awk '{print $1" "$3}' | egrep '[0-9][0-9]:[0-9][0-9]:[0-9][0-9]\ [6789][0-9]{5}'
HH:MM:SS   Kbps out
17:14:02 724531.3
17:14:03 789327.7
17:14:04 820572.8
17:14:05 762759.2
17:14:06 714686.0
17:14:07 672623.2
17:14:08 684501.8
17:14:09 675450.2
17:14:10 664382.2
17:14:11 614860.0
17:35:05 602157.8
17:35:06 619774.5
18:00:40 670322.3
18:00:41 651516.6
18:23:32 604746.2
19:04:23 623415.5
19:04:24 627015.1
19:36:39 659218.6
19:36:40 749309.0
19:36:41 782916.7
19:36:42 777130.6
19:36:43 759608.2
19:36:44 732785.8
19:36:45 689072.5
19:36:46 650569.4
19:36:47 644795.8
19:36:48 619328.1
19:48:18 624090.2
21:01:17 624364.0
21:01:18 637484.7
21:01:19 616644.9

elukey@mc1036:~$ cat ifstat.log | awk '{print $1" "$3}' | egrep '[0-9][0-9]:[0-9][0-9]:[0-9][0-9]\ [6789][0-9]{5}'
HH:MM:SS   Kbps out
20:45:14 642143.6
20:45:15 850641.4
20:45:16 692361.2

mc1029 is of course the major bandwidth user among all the hosts, thanks to the translate-groups key, but some of the others are dangerously crossing the 70/80% mark as well in some occasions.

elukey changed the task status from Open to Stalled.Apr 18 2019, 7:28 AM

I had a conversation on IRC with @Nikerabbit about the next steps, and we agreed that trying to reduce the translate-groups keys is still needed (even if we already had a ton of improvements). We also agreed that T213802 is not a Unbreak Now task, but "high" is a good priority, given the fact that we don't want to disrupt too much the other deliverables of the Language team. So during the next weeks we'll probably have some progress on the keys reduction front.

I don't see any clear actionable from SRE/Performance (besides monitoring the current status and see if anything gets worse), so setting the task as stalled.

aaron removed aaron as the assignee of this task.May 6 2019, 7:05 PM

Very good news from the task opened to the Language team: https://gerrit.wikimedia.org/r/508112 is merged and going to be part of this week's mediawiki train. It may very well be the last fix needed, fingers crossed :)

Change 468363 restored by Elukey:
mcrouter: allow to tune server timeout and timeouts until tko

Reason:
Bring this back up

https://gerrit.wikimedia.org/r/468363

The translate-groups key has been successfully reduced by the Language team. We now have multiple keys, but none of them is below 100k, a really great result.

TKOs down to zero now? Doesn't seem so.. The frequency of the TKOs is way less now, and spread to multiple shards. I have no evidence that it is related to the above, since I don't clearly see spikes in cas/sets/gets/etc.. when I look to the memcached slabs metrics. The plan forward for me is the following:

  • Raise the number of timeouts before tkos from 3 to 10 with https://gerrit.wikimedia.org/r/#/c/operations/puppet/+/468363. In my opinion mcrouter should be a bit more tolerant to failures before marking a shard as TKO, I hope it will reduce TKO events further.
  • Instruct the prometheus mcrouter exporter to publish more metrics, especially the ones related to each memcached shard. This should give to us more insights about what happens during TKOs.

Change 468363 merged by Elukey:
[operations/puppet@production] mcrouter: allow to tune timeouts until tko

https://gerrit.wikimedia.org/r/468363

Mentioned in SAL (#wikimedia-operations) [2019-06-05T13:57:06Z] <elukey> restart mcrouter on MediaWiki app/api canaries to pick up new config change (timeouts before marking a memcached shard as TKO from 3 to 10) - T203786

Change 514656 had a related patch set uploaded (by Elukey; owner: Elukey):
[operations/puppet@production] profile::mediawiki::mcrouter_wancache: set timeouts_until_tko to 10

https://gerrit.wikimedia.org/r/514656

Change 514656 merged by Elukey:
[operations/puppet@production] profile::mediawiki::mcrouter_wancache: set timeouts_until_tko to 10

https://gerrit.wikimedia.org/r/514656

After the last round of rolling restarts (happened days ago) I didn't see any TKO event related to mc1* shards. The only ones that I can see now, very sporadically, are related connection timeouts related to codfw proxies (causing very little impact but worth to investigate in a separate task).

I think that we reached the end of this infinite task, and we can close it. @Krinkle or @aaron let me know your thoughts :)

Seems reasonable.

mmodell changed the subtype of this task from "Task" to "Production Error".Aug 28 2019, 11:09 PM

Change 830706 had a related patch set uploaded (by Krinkle; author: Krinkle):

[mediawiki/core@master] [DNM] objectcache: Disable cool-off bounce feature

https://gerrit.wikimedia.org/r/830706

Change 902376 had a related patch set uploaded (by Krinkle; author: Krinkle):

[mediawiki/core@wmf/1.41.0-wmf.1] objectcache: Disable cool-off bounce feature

https://gerrit.wikimedia.org/r/902376

Change 830706 merged by jenkins-bot:

[mediawiki/core@master] objectcache: Remove WANObjectCache's internal cool-off bounce feature

https://gerrit.wikimedia.org/r/830706