Page MenuHomePhabricator

Add 'Event Summary' data to downloadable csv report
Closed, ResolvedPublic3 Estimated Story Points

Description

The Event Summary downloadable report gives top-line metrics designed to provide an overview of the event and its impact. By providing organizers with a CSV file, we enable them to sort or combine data with other reports to meet their various reporting needs.

  • Metric definitions: See below, under "Definitions of Metrics"
  • Event details: In addition to the data/metrics, the CSV file will contain some descriptive information about the event and the report. See below under "Event details."
  • Report filename: when the user saves the report, the filename should follow this format: event-summary_event-name

Report Content

Metrics/column names

  • The left-most column of the report will be a the labels listed below; the second column will contain data. In other words, this will be a two-column report.

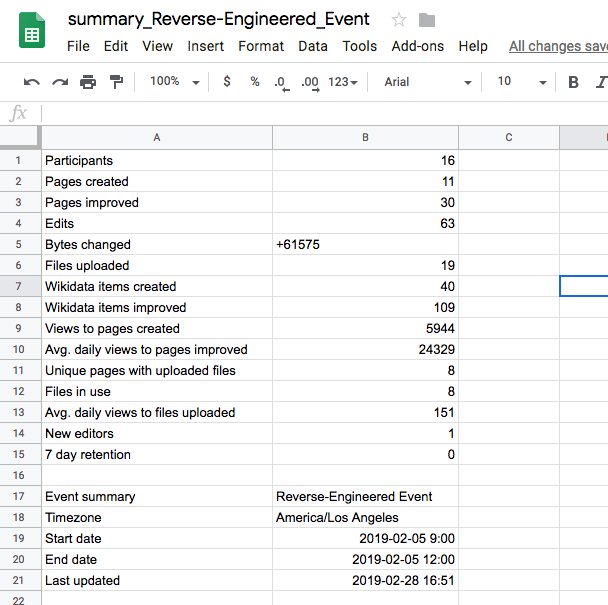
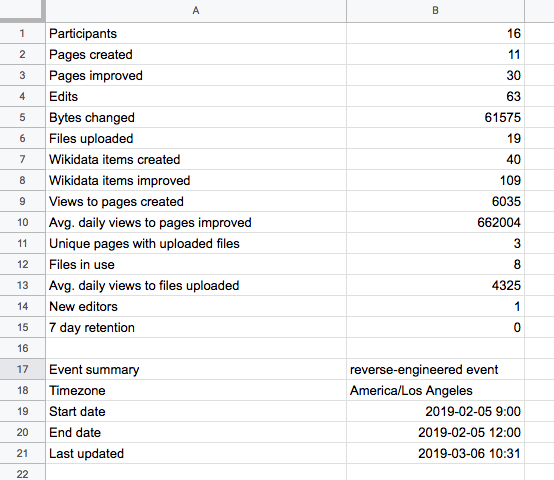
The labels for each row will be, in order (pls use this approved wording):

  • Participants [method defined in T208546]
  • Pages created
  • Pages improved
  • Edits [method defined in T206821]
  • Bytes changed [method defined in T206820]
  • Files uploaded [method defined in T206819]
  • Wikidata items created [method defined in T206818]
  • Wikidata items improved [method defined in T206818]
  • Views to pages created [method defined in T206817]
  • Avg. daily views to pages improved [method defined in T206817]
  • Unique pages with uploaded files [method defined in T206819]
  • Uploaded files in use [method defined in T206819]
  • Avg. daily views to files uploaded [method defined in T206700; also in T206819]!!
  • New editors [method defined in T208546]
  • 7-day retention [method defined in T214102]

Event details

At the bottom of the csv report below the data above, please list the data in the table below.

  • Please separate the event details from the report with a line of 7 dashes as shown, and/or just a blank row.
  • The timezone notation and all dates/times are the timezone of the event as per the Settings, not of the user who did the downloading.
  • The "last updated" time is the time of the last Update, not of the download,
———————
Event Summary:Eventname
Timezone:Timezonecountry/City
Start date:yyyy-mm-dd hh:mm
End date:yyyy-mm-dd hh:mm
Last updated:yyyy-mm-dd hh:mm

Definitions of metrics

  • Participants If we have a participants list, then this is a simple count. If not, we derive it by applying the active filters, counting contributions, and then determining all the unique actors who made those contributions [method defined in T208546]
  • New editors a count of new accounts created, including users who registered up to 14 days before the event (on any wiki). [method fully defined in T208546] I
  • 7 day retention The % of New Editors (see definition above) who make at least one edit, in any Wikimedia project (in any namespace), between 7 days after the event and the time that the report is run.
    • If the organizer supplies no figures for the event, do not include these columns at all in the downloadable csv report.
  • Pages created # of Main space pages created during the event in the specified wikis and consistent with whichever filters are active (Participant and/or Category and/or Worklist).
  • Pages improved # of Main space pages edited during the event in the specified wikis and consistent with whichever filters are active (Participant and/or Category and/or Worklist). Pages Improved and Pages Created are mutually exclusive categories; Pages Improved does not include Pages Created, and the total of the two would equal all pages worked on during the event.
  • Edits An edit count of all edits saved during the event (even if later reverted, etc.) Until we create a namespace filter, this will count Main namespace only.
  • Bytes changed The net bytes changed in Main space pages for specified wikis. If the Bytes Changed is a negative number, please include a - (but don't use a + for positive numbers).
  • Files uploaded A count of the files uploaded during the event.
    • Unlike the current Grant Metrics, we will counts files uploaded to to the individual specified wikis as well as to Commons.
    • As on current Grant Metrics, Commons is counted only if Commons is specified as a wiki of interest during setup.
  • Wikidata items created A count of all Wikidata items created during the event. If Wikidata is not specified for the event, then Wikidata figures will not be looked up or displayed.
  • Wikidata items improved A count of all Wikidata items edited during the event. If Wikidata is not specified for the event, then Wikidata figures will not be looked up or displayed.
    • Mutually exclusive: Wikidata Items Created and Items Improved are mutually exclusive categories. An Item Created does not become an Item Improved; the sum of the two is the total number of items involved in the event.
  • Views to pages created (also called "Pageviews, cumulative" in some reports) Cumulative pageviews to all pages created in Main space of specified wikis during the event, from creation until last data update. If the user requests stats during the same day when all articles are newly created, we will show "n/a", for "not available" rather than 0, which is misleading. However, if the event is long and we have stats for some pages but not others, show the total what we have and count the new pages as 0.
  • Avg. daily views to pages improved (also called "Avg. daily pageviews" in some reports) Cumulative pageviews is not relevant to pages improved, so we will give an average daily count for all "pages improved" (see definition above). Avg. daily views will be an average over the preceding 30 days. If 30 days are not available for certain pages, use the average of however many days are available for each of those pages.
  • Unique pages with uploaded files A count of how many non-duplicate pages contain uploaded files, on all wikis (i.e., not just those specified for the event). Please see the definition of "Files uploaded", above.
  • Uploaded files in use A count of the uploaded files that are in use on at least one page on any wiki. (Please see the definition of "Files uploaded", above. )
  • Avg. daily views to files uploaded Pageviews per day to all pages on which Files Uploaded have been placed (see definition of Files Uploaded above) . Includes all file types and counts pageviews on all wikis that include articles with uploaded files—not just wikis specified as wikis of interest in event setup. Avg. is calculated from a 30-day sample; if 30 days are not available, use the number of days that are available. If no days are available (i.e., if it's the first day), then display "n/a" for "not available".

Data that are fixed at event close vs. data that continue to develop

Figures like Pageviews naturally continue to develop after the event is over. Other figures can be considered fixed once the event period is over; these could be stored and need never be calculated again. Here is a breakdown for this report:

Remain fixed

  • Participants
  • New editors
  • Pages created
  • Pages improved
  • Edits
  • Bytes changed
  • Uploaded files
  • Wikidata items created

Continue to develop

  • Views to pages created
  • Views to pages improved
  • Views to uploaded files
  • Pages with uploaded files
  • Uploaded files in use

Related Objects

Event Timeline

There are a very large number of changes, so older changes are hidden. Show Older Changes

@MusikAnimal, I understand you want to delve into this one with teh data we already have -- I think that's a good idea, even to start flushing out any challenges we haven't yet seen with the current data.

Do you want to split this ticket to only cover what we have, or do you want to use this ticket but "tick" ([x] thing) the things you can implement at the moment? I ask mostly for QA purposes and to be able to move the ticket along.

The ticking [x] sounds good to me! I mostly see this ticket as "show the data we have", so we can check them off as we build all the new metrics.

@MusikAnimal, Moriel and I talked about the UI for providing the report. What do you think about temporarily making the UI for Event Summary—until we have the next report, Pages Created, ready to go—using exactly the same UI as you're showing on Edit List. So on Edit List the Download button lets you download that report, and on Event Summary it lets you download Event Summary? Would that make sense?

@MusikAnimal, Moriel and I talked about the UI for providing the report. What do you think about temporarily making the UI for Event Summary—until we have the next report, Pages Created, ready to go—using exactly the same UI as you're showing on Edit List. So on Edit List the Download button lets you download that report, and on Event Summary it lets you download Event Summary? Would that make sense?

Sure! We don't need any UI at all, if you'd prefer not to. The work would be just to expose the endpoint (e.g. /programs/:id/events/:id/summary?format=csv), and for testing purposes you could just manually browse to it.

Let me ask about T206692: Implement ‘Event Summary’ downloadable Wikitext report. That is supposed to be the same data, no? There are some metrics listed here that are not listed there. Anyway, it's easier for me to do wikitext first, only because it's less annoying to check as I'm doing my work (e.g. I can view the wikitext in the browser, rather than having to open up spreadsheet software). Once the wikitext one is done, CSV is a quick breeze as I only need to change the syntax.

In T205561#4904066, @MusikAnimal wrote:

...We don't need any UI at all, if you'd prefer not to. The work would be just to expose the endpoint (e.g. /programs/:id/events/:id/summary?format=csv), and for testing purposes you could just manually browse to it.

Use whichever route you prefer.

Let me ask about T206692: Implement ‘Event Summary’ downloadable Wikitext report. That is supposed to be the same data, no? There are some metrics listed here that are not listed there. Anyway, it's easier for me to do wikitext first, only because it's less annoying to check as I'm doing my work (e.g. I can view the wikitext in the browser, rather than having to open up spreadsheet software). Once the wikitext one is done, CSV is a quick breeze as I only need to change the syntax.

Yes, you can do the Wikitext first if you prefer. No, Wikitext does not present identical metrics to the CSV. It offers a subset, for a few reasons. One is that the table needs to be pasted on a page, and space isn't infinite, as it is for the CSV. Also, the whole purpose of the WIkitext version is for public posting. But there are some metrics that organizers have said they prefer to keep private (because the numbers make them feel judged, I think), like Retention and New Users. Also, these are just not the focus of most organizers.

(BTW, the wikitext mockup is for formatting and style only; the labels and metrics in that example are not correct. The ticket is the authority for content.)

jmatazzoni renamed this task from Implement 'Event Summary' downloadable csv report to Add 'Event Summary' data to downloadable csv report.Jan 29 2019, 7:18 PM

Deprecated metrics, not for MVP

  • Words added [T206690
  • New page survival rate [T206695]
  • Plays to uploaded audio/video [see T206817 and T206819]
  • Wikidata claims added Same as above but for claims. [Complicated, not for MVP]

PR here: https://github.com/wikimedia/eventmetrics/pull/199

Not sure though how the "Event details" should be added to the CSV - just to the bottom of the same table?

PR here: https://github.com/wikimedia/eventmetrics/pull/199

Not sure though how the "Event details" should be added to the CSV - just to the bottom of the same table?

I'm not sure what is possible for this. What do you recommend Max?

Not sure though how the "Event details" should be added to the CSV - just to the bottom of the same table?

I'm assume we can put this at the bottom, with an empty row between it and the previous table:

Event details
Event Summary dataEventname
Start dateStart date/time
End dateEnd date/time (timezone)
Last updatedyyyy-mm-dd hh:mm (timezone)

Right? I would recommend using ISO 8601 format (yyyy-mm-dd hh:mm) for all dates, and maybe putting the timezone in its own cell. LibreOffice and Google Sheets both don't seem to be able to parse a datetime if it includes the timezone.

Also note the "Last updated at" message, as opposed to "Data updated". The former is an existing message and is used on the Event Summary page and wikitext report, hopefully it's okay to use it here rather than create a new message.

jmatazzoni updated the task description. (Show Details)

In T205561#4982073, @MusikAnimal wrote:

Not sure though how the "Event details" should be added to the CSV - just to the bottom of the same table?

I'm assume we can put this at the bottom, with an empty row between it and the previous table:

Event details
Event Summary dataEventname
Start dateStart date/time
End dateEnd date/time (timezone)
Last updatedyyyy-mm-dd hh:mm (timezone)

Right? I would recommend using ISO 8601 format (yyyy-mm-dd hh:mm) for all dates, and maybe putting the timezone in its own cell. LibreOffice and Google Sheets both don't seem to be able to parse a datetime if it includes the timezone.

Also note the "Last updated at" message, as opposed to "Data updated". The former is an existing message and is used on the Event Summary page and wikitext report, hopefully it's okay to use it here rather than create a new message.

OK, I've changed the Description above to respond to Leon's points (I think) and to make this more appropriate for a tabular format. It now reads like this:

————————
Event Summary:Eventname
Timezone:Timezonecountry/City
Start date:yyyy-mm-dd hh:mm
End date:yyyy-mm-dd hh:mm
Last updated:yyyy-mm-dd hh:mm
  • @MusikAnimal and @MaxSem , is that what you were asking for? (I'm trying to make this easier, as requested.)
  • I got rid of the separate heading line that said "Event detais", which was unnecessary.
  • Re. your point about not putting timezone in the cell with the times, I moved it into its own line. That is better, since it's undesirable to repeat the timezone three times anyway. Now we can omit from the three times (if that's OK).
  • If we can make the new first line (report and event names) bold, that would be nice. If that is not possible in CSV say so and I will change.
  • Please note the new request to fill a cell above this, between this and the data, with dashes or something. Is that OK? Otherwise this will just look like part of the spreadsheet. Do you have a suggestion?
  • Once we've arrived at a desirable format for this I will copy it to the other CSV report tickets.
jmatazzoni updated the task description. (Show Details)

MusikAnimal and MaxSem , is that what you were asking for? (I'm trying to make this easier, as requested.)

Yes, thank you.

If we can make the new first line (report and event names) bold, that would be nice. If that is not possible in CSV say so and I will change.

It's possible to do it within some spreadsheet software but apparently there is no function or syntax to instruct the software to bolden text. So no, not possible.

Please note the new request to fill a cell above this, between this and the data, with dashes or something. Is that OK? Otherwise this will just look like part of the spreadsheet. Do you have a suggestion?

I would say one or two empty rows would suffice, but dashes won't hurt anything either.

In T205561#4987055, @MusikAnimal wrote:

MusikAnimal and MaxSem , is that what you were asking for? (I'm trying to make this easier, as requested.)

Yes, thank you.

If we can make the new first line (report and event names) bold, that would be nice. If that is not possible in CSV say so and I will change.

It's possible to do it within some spreadsheet software but apparently there is no function or syntax to instruct the software to bolden text. So no, not possible.

Please note the new request to fill a cell above this, between this and the data, with dashes or something. Is that OK? Otherwise this will just look like part of the spreadsheet. Do you have a suggestion?

I would say one or two empty rows would suffice, but dashes won't hurt anything either.

Great, thanks. I've updated the Description (to remove the bold ad specify 7 dashes) and will now copy this to the other CSV report tickets.

I did a preliminary check and everything is here and in the right place. See the screenshot below. Great job @MaxSem! Dom will do a more thorough check to make sure the numbers are what they are supposed to be.

Meanwhile, I noted one little thing to tweak:

  • My spec called for notating "Bytes changed" with +/-. Max informs me that the + causes that number to align left. So I've changed the spec in the Description, as follows:
    • Bytes changed The net bytes changed in Main space pages for specified wikis. If the Bytes Changed is a negative number, please include a - (but don't use a + for positive numbers).

Screen Shot 2019-02-28 at 5.03.47 PM.png (605×608 px, 87 KB)

If it makes it easier for testing, this uses the exact same data/methods/etc. as T206692. The only difference is the format (CSV instead of wikitext). If something is broken here it should be broken in the wikitext, too.

@MaxSem I think it might be counting the same page more than once. For example, event https://eventmetrics-dev.wmflabs.org/programs/120/events/290 reports 'Unique pages with uploaded files' as 3.
It has 3 files uploaded:
https://commons.wikimedia.org/wiki/File:Woodland_Park_Ad_from_the_Columbus_Dispatch_1904.jpg
https://commons.wikimedia.org/wiki/File:COTA_Bus_Stop_on_Broad_Street_in_Woodland_Park,_Columbus,_OH.JPG
https://commons.wikimedia.org/wiki/File:Entryway_to_Ohio_State_Hospital_East_Branch.JPG
but all three are only included in one article:
https://en.wikipedia.org/wiki/Woodland_Park,_Columbus,_Ohio

(this effects both the wikitext and csv reports, but I am reporting it here as this task is still in progress).

@MaxSem I think it might be counting the same page more than once.

Indeed, looks like there is no DISTINCT or GROUP BY in the query. Should be an easy fix.

@MusikAnimal, so why did you remove it?

Haha nice catch! The idea here was to return the results as two separate fields (hence the removal of DISTINCT), but there should be a GROUP BY in its place. I'll fix this now.

I'm guessing your event was changed since your comment; the current one does in fact have files used on 3 different pages. Your assessment is correct however, the query was returning multiple results for the same page. I went by your linked example images above, and this user's uploads are a great example (they all are used on the same page): https://commons.wikimedia.org/wiki/Special:Contributions/Krupin.1. I've fixed the query and added a test case.

PR: https://github.com/wikimedia/eventmetrics/pull/208

I recreated the event I mentioned above (T205561#4993826) and checked that "Unique pages with uploaded files"=1. https://eventmetrics-dev.wmflabs.org/programs/118/events/296.

@MaxSem @MusikAnimal, sorry, I missed this discrepancy when I went through the download before. Please fix one label:

  • "Files in use" should be "Uploaded files in use"

(The goal is consistency—once we fix the other labels, as per T217083, to have the same style this is supposed to they will be "Uploaded files," "Uploaded files in use," and "Avg. daily views to uploaded files.")

Actually, cancel that. Since it didn't get done with this ticket I'll just add it to T217083.

I'm going to close this, since every thing is here. But @dom_walden I am seeing some odd metrics when I compare the report I pulled today, below, with the one above from 2/28. E.g., it seems suspicious that "Unique pages with uploaded files" would have gone down (from 8 to 3), while at the same time "Avg. daily views to files uploaded" should have gone up so much (from 151 to 4,325). Will investigate.

Screen Shot 2019-03-06 at 11.07.56 AM.png (480×554 px, 65 KB)