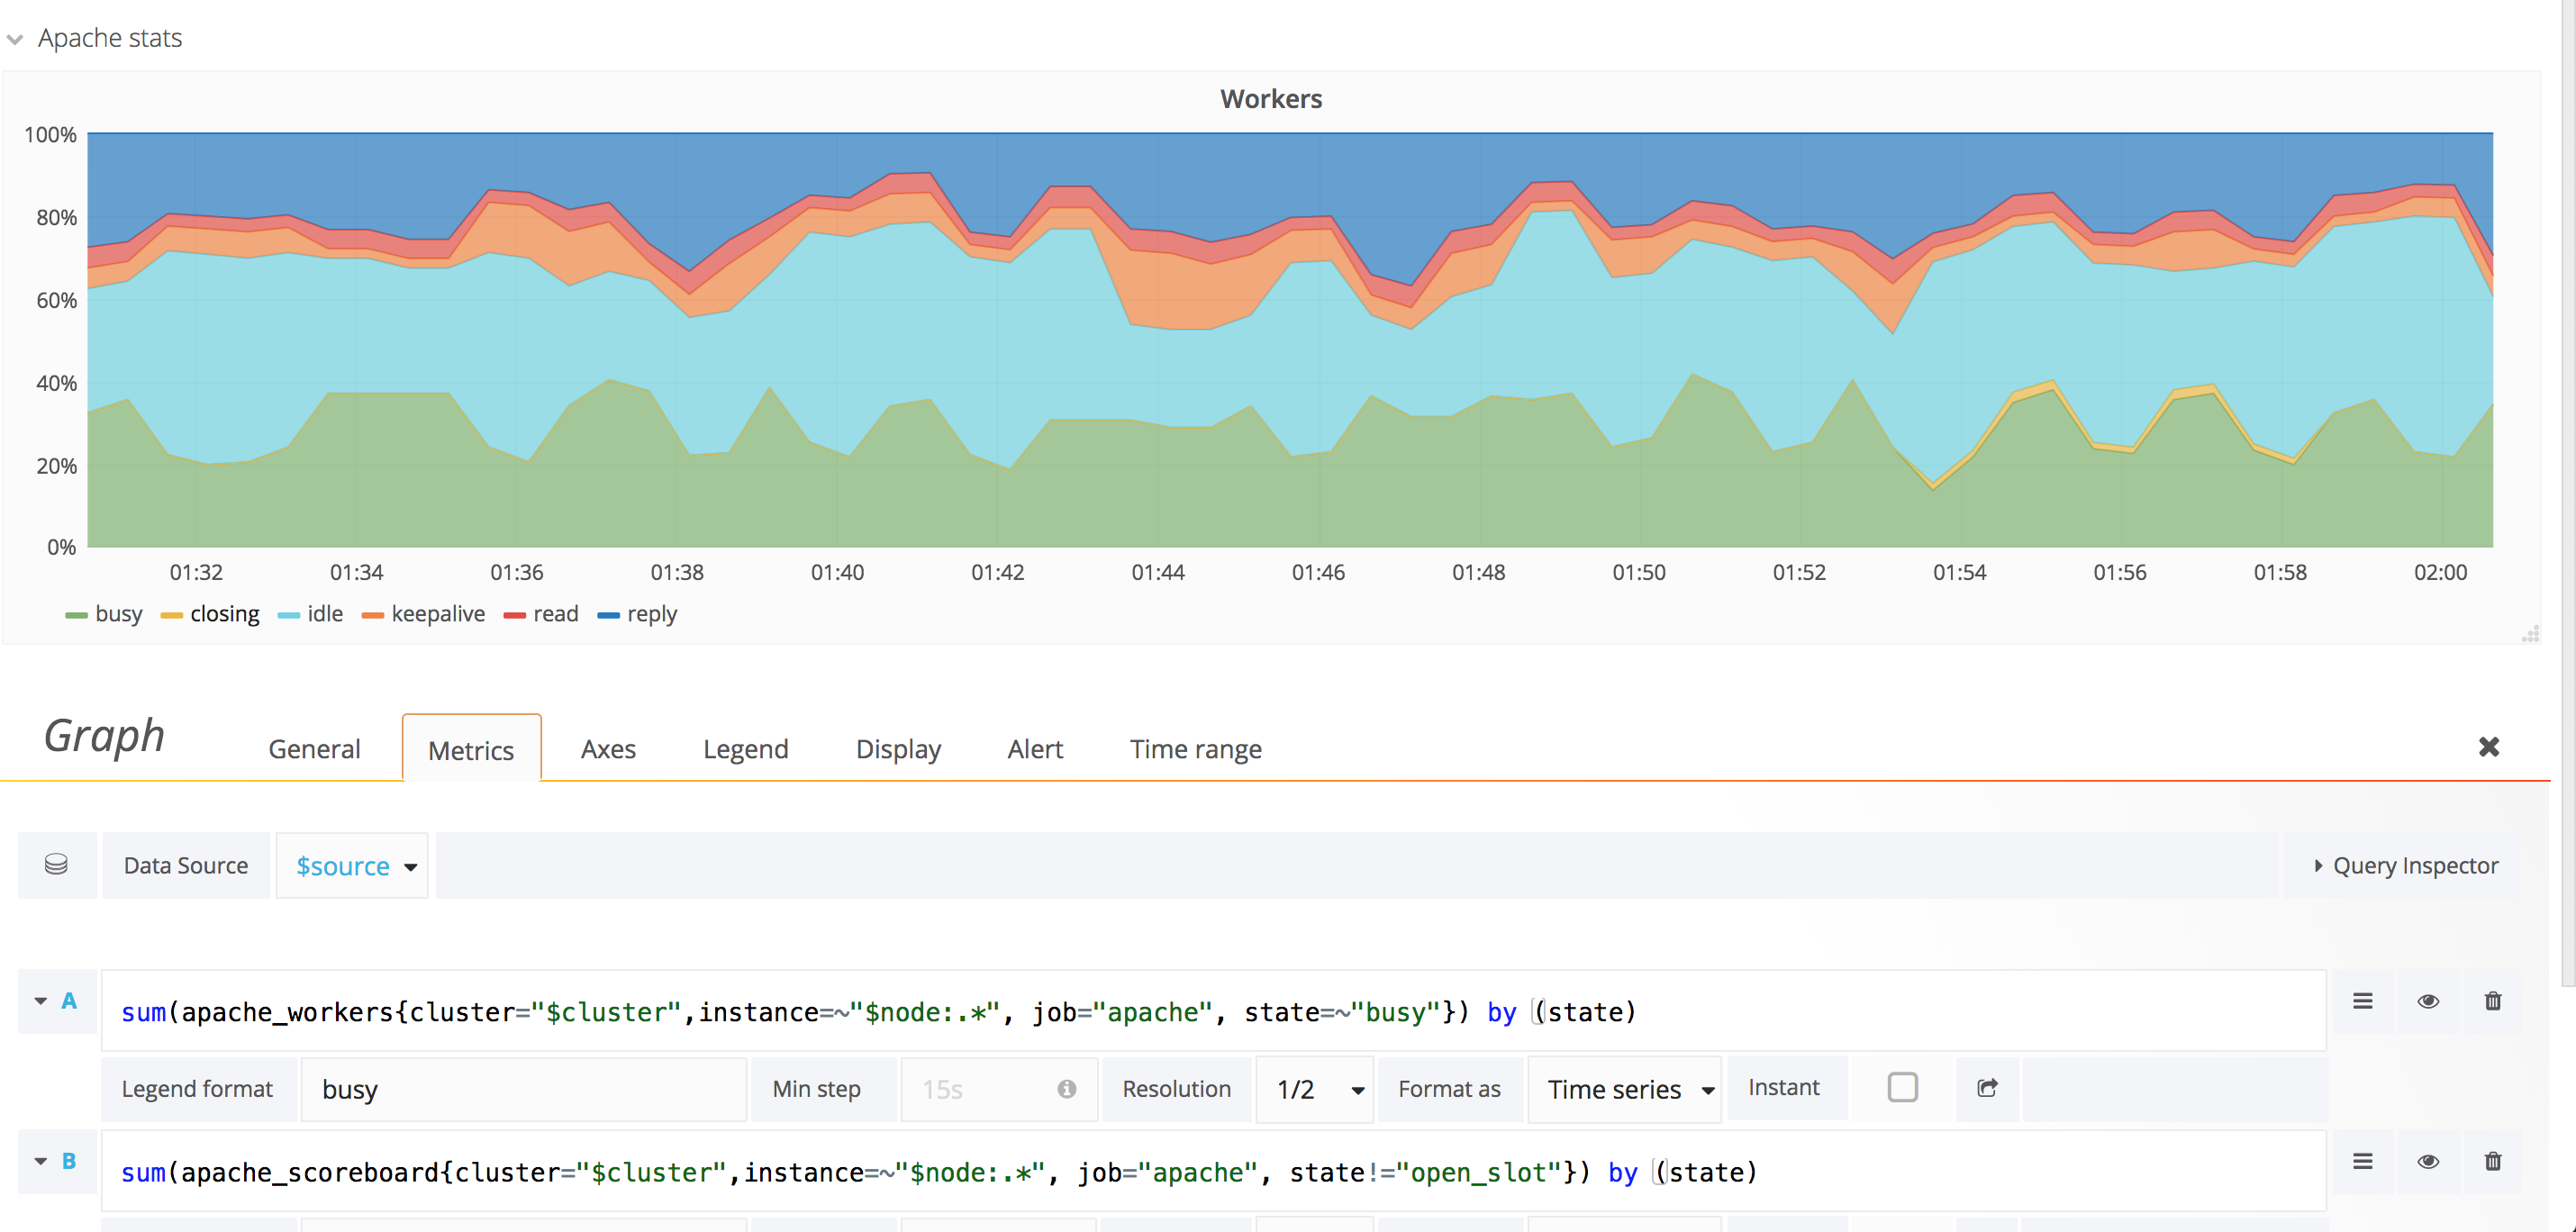
When refreshing the following graph, it seems to keep alternating from one minute to the next between to different pictures:
| A |
|---|
 |
| B |
|---|
 |
| Krinkle | |
| Oct 14 2018, 2:08 AM |
| F35838421: 2022-12-05-155043_1265x834_scrot.png | |
| Dec 5 2022, 2:51 PM |
| F26590268: Screen Shot 2018-10-14 at 03.00.55.png | |
| Oct 14 2018, 2:08 AM |
| F26590269: Screen Shot 2018-10-14 at 03.00.51.png | |
| Oct 14 2018, 2:08 AM |
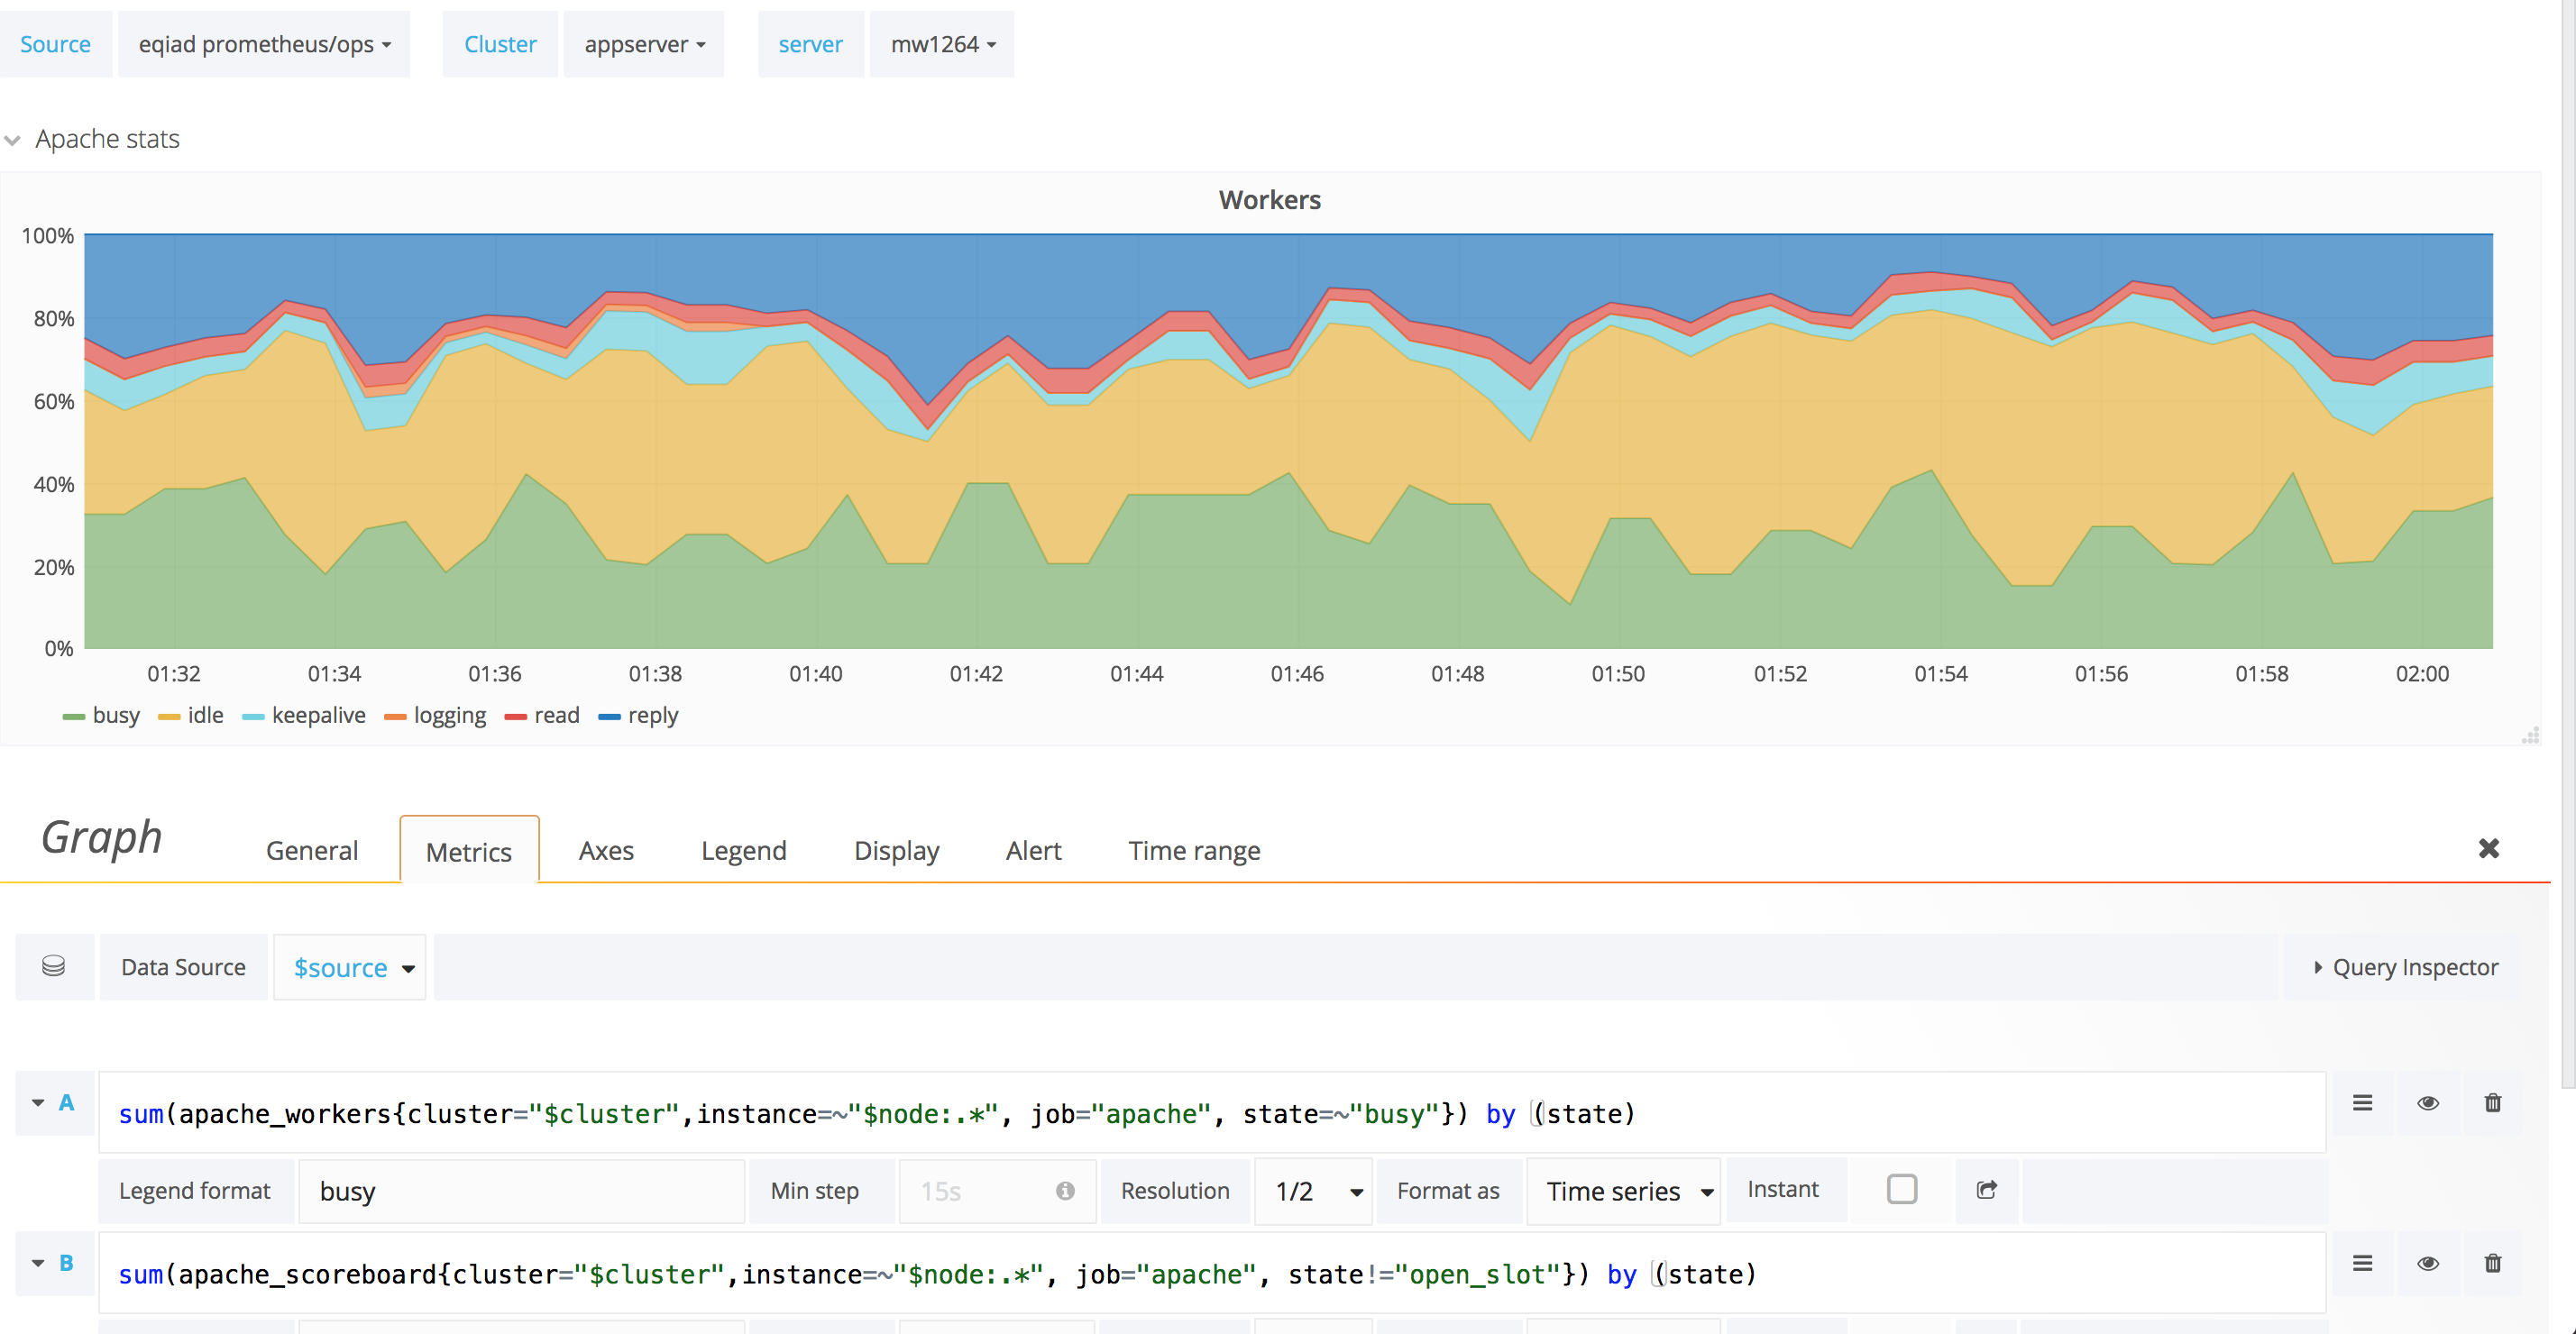
When refreshing the following graph, it seems to keep alternating from one minute to the next between to different pictures:
| A |
|---|
|
| B |
|---|
|
I initially thought it was just a change of color due to the order of the metrics being indeterministic. But, that's not it.
The closing metric visible in figure A is missing from figure B. The logging metric visible in figure B is missing from figure A.
It seems something inside Prometheus, or the collectors, is causing one of the two to constantly be deleted or absent, not even showing in historical data, and then a minute later, its history and current value are back, with another metric's current/historic values missing instead.
The prometheus.svc endpoint in eqiad and codfw is backed by two independent Prometheus servers scraping the same targets. What I suspect has happened is that one of the two servers "catched" workers in state closing or logging while the other didn't. This also suggests to me the exporter doesn't report all metrics it knows about all the time, which leads me to believe that mod_status believes that way (i.e. when no workers are in state closing they are not reported at all).
One potential fix would be for the exporter to report all metrics it knows about all the time, if my assumptions are correct.
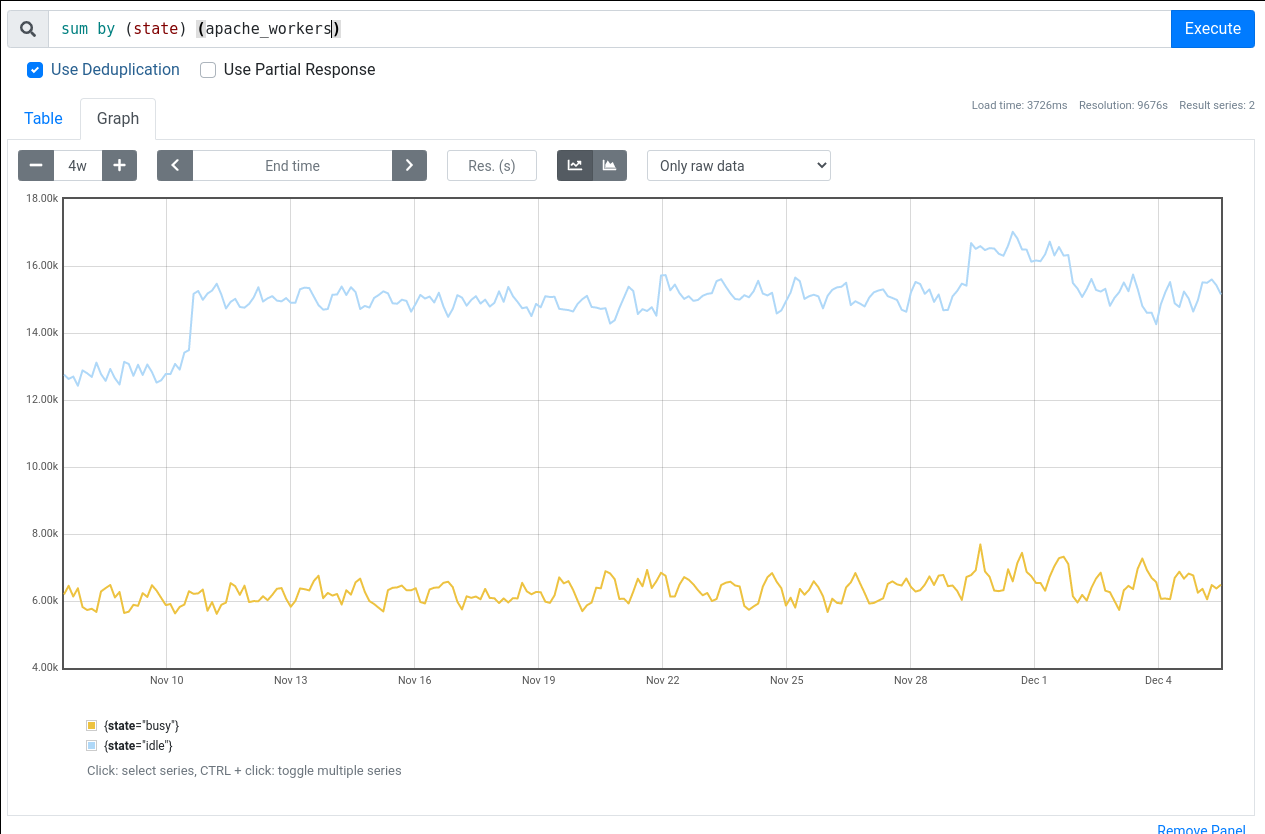
I've run the following query sum by (state) (apache_workers) and I'm seeing only state busy or idle for the last four weeks:
I'm tentatively declining as invalid, feel free to reopen