Page MenuHomePhabricator

Extend translations graph to show also deleted translations
Closed, ResolvedPublic

Description

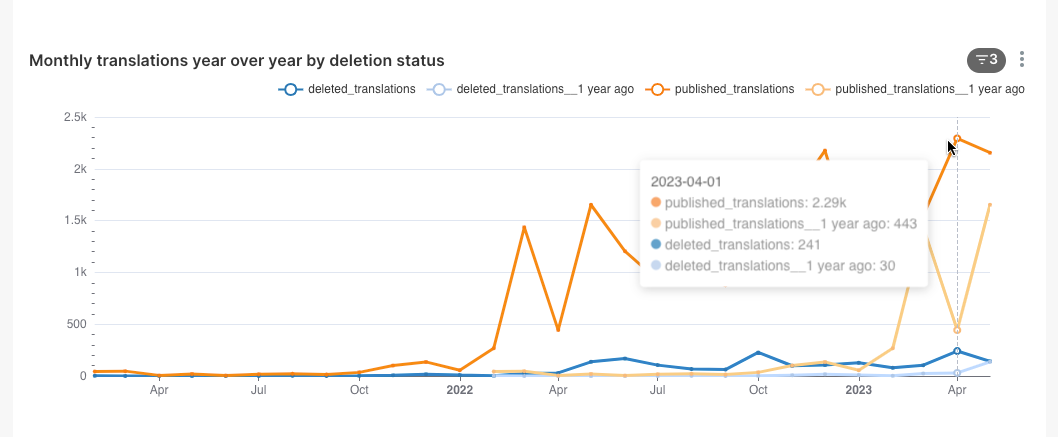
The Content Translation Key metrics dashboard shows in multiple graphs the translations published, but there is no information about how many of those got deleted.

To get a wider picture of what happens with the content created with Content Translation, we want to represent across all languages a information about "deleted translations" next to the published one, representing the translations that have been deleted.

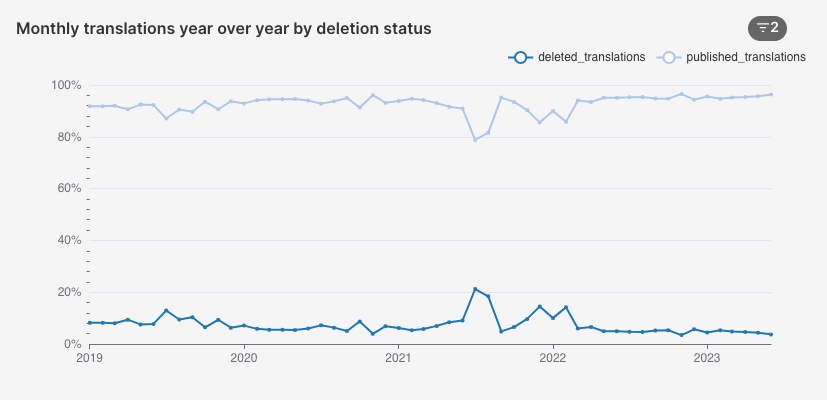
This, combined with similar additions to depict translations "published needing review" (T209868) will provide more perspective on the quality of the content created, and the impact on it that the improvements on the tool may have.

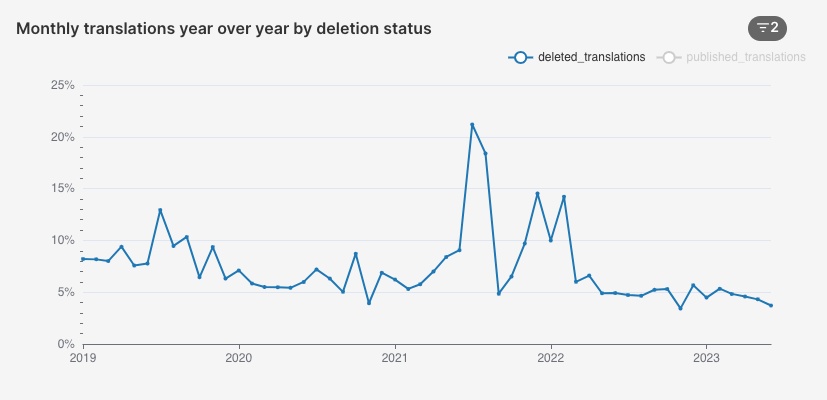
That is, at a glance we can identify when most of the translations published were problematic, identifying peaks og deletions or translations needing review.

Details

Other Assignee
MNeisler

Event Timeline

Pginer-WMF removed Amire80 as the assignee of this task.
Pginer-WMF assigned this task to Amire80.

I'm trying to resolve it together with T209868#5232506.

I need the data about published translations, deleted translations, and translations that need review all in one chart with three lines. If I understand correctly, Dashiki is not able to show one chart with data from several files.

I rewrote the queries that are currently used for creating the Published and the Need-review charts as a Bash script, and added a query that shows information about deleted translations to the same script.

This script can run on mwmaint1002, and the output that it produces looks like this:

2019-05-20	Published translations	2734
2019-05-20	Translations that need review	1821
2019-05-20	Deleted translations	85

So, two questions before I submit a patch about it:

  1. Does this look like output that Dashiki can process into a graph with three lines?
  2. In this script I need to query three kinds of databases: the Wikipedia databases (enwiki, eswiki, and all other languages), the EventLogging database, and the wikishared database. What's the right way to connect to the EventLogging database? I can run my script in the shell on mwmaint1002, and I can connect to wikishared and to enwiki, eswiki, etc. using the sql command, but connecting to the EventLogging database, as far as I know, requires running something like mysql -pBLABLA -u research_prod -h db1108.eqiad.wmnet (replace BLABLA with the actual password).

We recommend you look at eventlogging data in hadoop, the mysql eventlogging hosts are to be deprecated probably next quarter. Also, please get in touch with Product-Analytics for recommendations on how to do this work, there are tools such us superset that we think can help here.

I'll be fine with whatever allows me to build a chart that shows the three things:

  1. Published articles (from wikishared)
  2. Articles that need review (from EventLogging)
  3. Articles that were deleted (from wiki databases)

Are all three accessible from Hadoop?

While we're waiting for a proper solution with Dashiki, I made a simple, public-readable spreadsheet that presents all of this:
https://docs.google.com/spreadsheets/d/1hLQyLq3oQ11BLhU3_EJsb3hNgeUG6TutJcXjZ2g22bk/edit#gid=1343851748

While we're waiting for a proper solution with Dashiki, I made a simple, public-readable spreadsheet that presents all of this:

@Amire80 : Just clarifying we are not waiting for any dashiki work, as I mentioned before superset would be a better alternative for dashboarding, an example from cx translation (per https://www.mediawiki.org/wiki/Content_translation/analytics/queries)

Pages created since January 2019 from cx_translations:
https://bit.ly/2XJpJnh

As you can see, Wikishared db is available in superset to be queried, you can follow the example I provided and start creating some of your dashboards there. It will be best to talk to Product-Analytics

CC @kzimmerman so she knows of this work.

We may want to review the task request, probably incorporating the new data in the new Superset dashboard.
We may consider deprecating the specific CX2 tags since that is now the only version (no longer coexisting with CX1).

Pginer-WMF renamed this task from Extend CX2 translations graph to show also deleted translations to Extend translations graph to show also deleted translations.Aug 3 2021, 4:04 PM
Pginer-WMF updated the task description. (Show Details)
KCVelaga_WMF changed the task status from Open to In Progress.Jun 20 2023, 5:43 AM

Hi @Pginer-WMF

@MNeisler and I integrated the data related to deleted translations with the following changes to the Superset dashboard:

  • We classified the data into overwritten articles, translations that were kept, deleted translations and reverted translations.
    • As per our conversation, overwritten articles haven't been considered in the deleted and reverted counts
  • We have added a section to show deleted and reverted translations for the selected time range, along with monthly translations year over year by deletion status (deleted and reverted)
  • We have added a filter by deletion status.

Please review and let us know what you think.

Thanks @KCVelaga_WMF. This looks good.
My only consideration is about the visual representation. I think the current one is useful to identify peaks of activity (a period of higher than usual deletions). However, it is not easier to determine if the deletion rates are changing. For example, if on a given month both published and deleted translations increase, it is hard to know if the deletions affect the same percentage of articles as the previous month.

Screenshot 2023-07-03 at 10.53.11 2.png (437×1 px, 74 KB)

Given that the activity peaks for publication are already captured above in the "Monthly translations year over year" graph, I think it could be more useful to represent the data about deletions in terms of percentages for the Y axis, if possible.

Please let me know id the above makes sense to you, and feel free to suggest any other proposal that may help to analyze the data in a better way.
Thanks!

Thanks for the review @Pginer-WMF

Yes, I think it is a good idea to show the deleted translations as a percentage of the published translations. I will get back to you once the changes are made.

KCVelaga_WMF moved this task from Doing to Needs Review on the Product-Analytics (Kanban) board.

@Pginer-WMF the chart has been updated, thanks to @MNeisler. Let me know what you think.

@Pginer-WMF the chart has been updated, thanks to @MNeisler. Let me know what you think.

Thanks for the update. The graph looks good. I have a couple of comments:

  1. The "published translations" seems to be representing the surviving translations (i.e., published - deleted) otherwise the line would be always at the 100% value. So it may be worth renaming it as "Surviving translations" to avoid confusions.
  1. Given that both lines are complementary, I think the graph looks more detailed when only the "deleted translations" line is visible. I can adjust this by clicking at the legend, but if that could be made the default state it would be great. Below images comparing both,
Current default with both lines visibleProposed default with only deletions visible provides more detail at a glance
monthly-translations-by-deletion-status-2023-07-11T07-36-00.551Z.jpg (400×827 px, 38 KB)
monthly-translations-by-deletion-status-2023-07-11T07-36-13.112Z.jpg (400×827 px, 37 KB)
KCVelaga_WMF updated Other Assignee, added: MNeisler.

@Pginer-WMF

I renamed "published_translations" to "surviving_translations"

Unfortunately, there seems to be no option to set default options for legends. Our initial idea was to just display the percentage of deleted translations, however, Superset is showing strange behaviour when trying to define a custom metric (calculating the percentage in the SQL query), resulting in all zeros.

Currently, we are using the Contribution Mode - Superset automatically calculates percent of the contribution of each dimension in a given row. So, it calculates published / published + deleted, and deleted / published + deleted. Removing published will result in deleted / deleted, resulting in 100%.

We will explore to see if we can get the metric to be defined directly using SQL (if not, we might have to rely on the legend to toggle the lines).

We will explore to see if we can get the metric to be defined directly using SQL (if not, we might have to rely on the legend to toggle the lines).

Thanks for the context and the update, @KCVelaga_WMF. Relying on the legend to toggle the lines is just one click away. There is no need to spend too much effort if the alternatives become too complex.

@Pginer-WMF Thanks to a trick shared by @mpopov, we were able to make it work. The chart and the dashboard have been updated.

@Pginer-WMF Thanks to a trick shared by @mpopov, we were able to make it work. The chart and the dashboard have been updated.

Perfect. The graph looks great. Thanks!!

Thanks. Closing the task, please re-open if needed.

This addition to the dashboard has been really useful to investigate and understand better some concerns from Turkish wikipedia editors in T330363#9011654