Page MenuHomePhabricator

Address recurrent service check time out for "HP RAID" on swift backend hosts
Closed, ResolvedPublic

Description

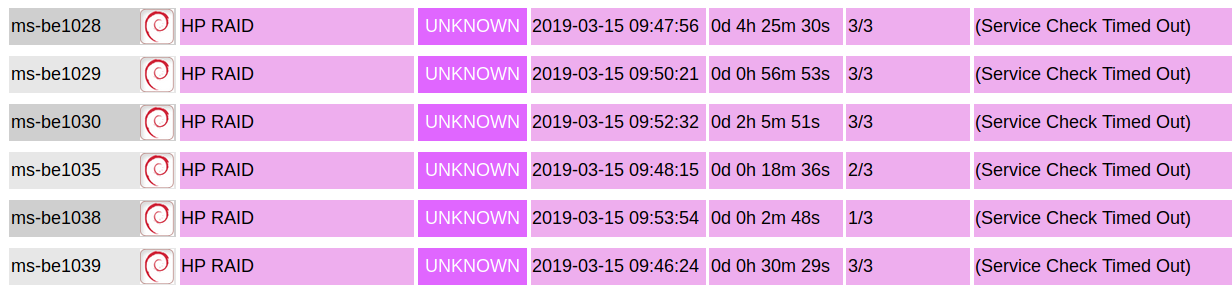
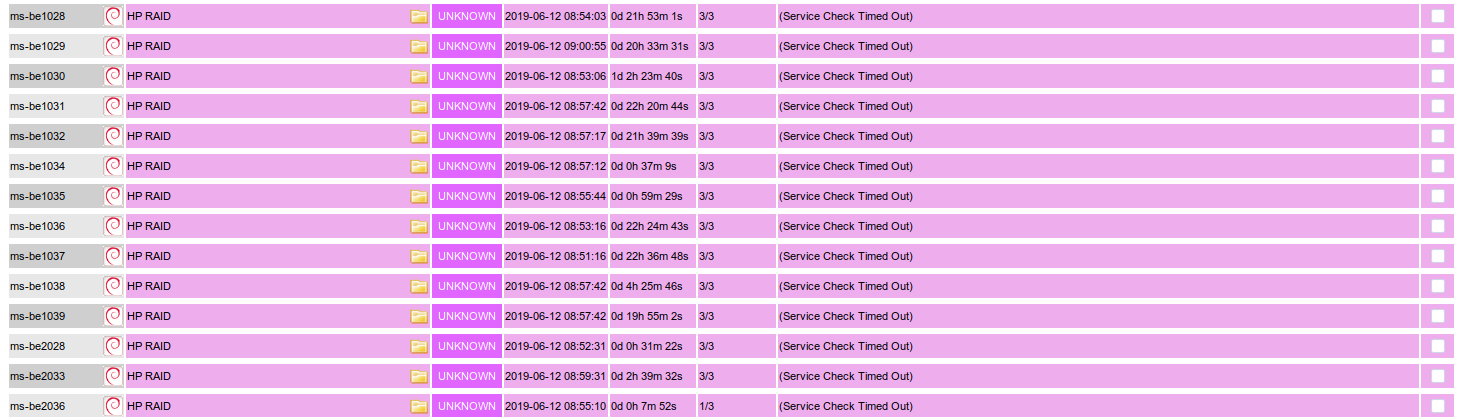
The "HP RAID" check (check_hpssacli) is known to timeout on busy ms-be hosts. The timeout has been recurring now for a while on icinga and doesn't provide a whole lot of value in this state.

Potential solutions in no particular order:

  1. Increase nrpe server timeout
  2. Increase check retries
  3. Move to an asynchronous check model, where the generating results and checking for alert states are decoupled

Event Timeline

fgiunchedi renamed this task from Address recurrent service check time out for "HP RAID" to Address recurrent service check time out for "HP RAID" on swift backend hosts.Nov 29 2018, 1:12 PM
fgiunchedi added projects: observability, SRE.

Note we've been here before in T172921: Nrpe command_timeout and "Service Check Timed Out" errors and sadly the command check timeout can be changed only globally on the icinga side, not per-service.

jijiki triaged this task as Medium priority.Dec 4 2018, 10:24 PM

There are few options that occur to me right away

  • Cron generates Prometheus metrics and exposed via the node text exporter
  • Script that runs on cron and caches the output of hpssacli and update the nrpe check to use the cached version (with additional staleness check)
  • Passive Icinga checks
  • hpraid_exporter: https://github.com/chromium58/hpraid_exporter

I would suggest to pick one of those solutions:

  • Script that runs on cron and caches the output of hpssacli and update the nrpe check to use the cached version (with additional staleness check)
  • Passive Icinga checks

Regarding this last one it would basically be convert it to a passive check with a crontab and a large-enough timeout. It might be tricky on the Puppet side and of course we should do this only for the ms-be hosts.
I know there are concerns over passive checks, but what we're trying to do with the other approaches is basically re-implementing a passive check via NRPE.

This is the kind of information this check provides:

WARNING: Slot 0: Predictive Failure: 1I:1:3 - OK: 1I:1:1, 1I:1:2, 1I:1:4, 1I:1:5, 1I:1:6, 1I:1:7, 1I:1:8, 1I:1:9, 1I:1:10, 1I:1:11, 1I:1:12 - Controller: OK - Cache: Permanently Disabled - Battery/Capacitor: Failed (Replace Batteries)

I honestly don't see how we could fit this kind of rich information in some Prometheus metrics if not creating 1 metric per disk (with mapping values 0=ok, 1=predictive, 2=failed for example) + additional metrics for the rest of the checks.
And going with a single metric that reflects the nagios exit code of the script seems a step backwards and not forwards to me.
As for the over-time tracking of this that would be included/implicit in Prometheus I'm not sure it's something very useful because if a disk is broken we open a task to replace it, so it's already trackable. And for the rest is more important to know it flapped (Icinga+IRC logs have the same info) than a real time-series data.

My 2 cents :)

Agreed in this case it might be worth moving to passive icinga checks or cache hpssacli output, mostly by exclusion of other options: the prometheus approach would work but check_hpssacli has a lot of logic so we'd need to export overall results (e.g. health ok / not-ok) and consult logs on failure. Ditto for hpraid_exporter AFAICS it doesn't have extra checks/logic and we'd need to implement/port that from check_hpssacli.

faidon raised the priority of this task from Medium to High.
faidon added a subscriber: faidon.

Right now there are 14 outstanding alerts, or about 50% of all outstanding alerts:

Screenshot_2019-06-12 Current Network Status.png (417×1 px, 99 KB)

This is not OK. Let's please roll out -at least- a workaround ASAP.

Change 516627 had a related patch set uploaded (by Filippo Giunchedi; owner: Filippo Giunchedi):
[operations/puppet@production] icinga: increase service_check / command_timeout by 11%

https://gerrit.wikimedia.org/r/516627

Right now there are 14 outstanding alerts, or about 50% of all outstanding alerts:

Screenshot_2019-06-12 Current Network Status.png (417×1 px, 99 KB)

This is not OK. Let's please roll out -at least- a workaround ASAP.

Indeed, I've posted a patch to bump the timeout at least for now.

Change 516725 had a related patch set uploaded (by Faidon Liambotis; owner: Faidon Liambotis):
[operations/puppet@production] dsa-check-hpssacli: speed when checking many disks

https://gerrit.wikimedia.org/r/516725

So, the timeout patch above bumped the timeouts to 100s I think. On many hosts (e.g. ms-be1036, ms-be1037) these checks seemed to take about 1.5-3 minutes to run, so this issue would not be addressed by that. However, I also wondered why such a relatively simple thing would take such a long time to execute. The response seems to be two-fold:

  1. dsa-check-hpssacli isn't that efficient, running hpssacli e.g. on ms-be1036 32 times in total. I refactored it, and this speeded it up by ~10x (cf. r516725, and r516726 for ssacli). On an example run on ms-be1037, this made the run go from 1m52 to 11s, which would make it easily under the limit.
  2. There is something really off with the CPU management on those systems. Things seemed abysmally slow even by a casual SSHing into the machine and running commands. Load is in the 60s-80s on a 48-core HT CPU. Despite that, the CPU frequencies (grep MHz /proc/cpuinfo) seemed to be... relatively low. The scaling governor was set to ondemand, so I tried setting it to performance (for cpu in /sys/devices/system/cpu/cpu*; do echo performance > $cpu/cpufreq/scaling_governor ; done) and... the check now runs in ~2 seconds. Even more interestingly... CPU utlization dropped from 50% to 5%, load to 14 (and even the temperatures of the CPUs dropped visibly!). This probably requires a separate task and investigation of its own...

Screenshot_2019-06-13 Grafana - Host overview.png (339×1 px, 68 KB)

Mentioned in SAL (#wikimedia-operations) [2019-06-14T09:26:50Z] <godog> test setting 'performance' governor on ms-be2016 - T210723

Mentioned in SAL (#wikimedia-operations) [2019-06-14T09:28:22Z] <godog> test setting 'performance' governor on ms-be2038 - T210723

Mentioned in SAL (#wikimedia-operations) [2019-06-14T09:43:57Z] <godog> test setting 'performance' governor on ms-be2033 - T210723

Mentioned in SAL (#wikimedia-operations) [2019-06-14T09:44:33Z] <godog> test setting 'performance' governor on ms-be2037 - T210723

So, the timeout patch above bumped the timeouts to 100s I think. On many hosts (e.g. ms-be1036, ms-be1037) these checks seemed to take about 1.5-3 minutes to run, so this issue would not be addressed by that. However, I also wondered why such a relatively simple thing would take such a long time to execute. The response seems to be two-fold:

  1. dsa-check-hpssacli isn't that efficient, running hpssacli e.g. on ms-be1036 32 times in total. I refactored it, and this speeded it up by ~10x (cf. r516725, and r516726 for ssacli). On an example run on ms-be1037, this made the run go from 1m52 to 11s, which would make it easily under the limit.
  2. There is something really off with the CPU management on those systems. Things seemed abysmally slow even by a casual SSHing into the machine and running commands. Load is in the 60s-80s on a 48-core HT CPU. Despite that, the CPU frequencies (grep MHz /proc/cpuinfo) seemed to be... relatively low. The scaling governor was set to ondemand, so I tried setting it to performance (for cpu in /sys/devices/system/cpu/cpu*; do echo performance > $cpu/cpufreq/scaling_governor ; done) and... the check now runs in ~2 seconds. Even more interestingly... CPU utlization dropped from 50% to 5%, load to 14 (and even the temperatures of the CPUs dropped visibly!). This probably requires a separate task and investigation of its own...

Screenshot_2019-06-13 Grafana - Host overview.png (339×1 px, 68 KB)

Thanks @faidon for taking a look at this! I just did a set of tests to see if setting the scaling governor to performance alone is enough to make the unmodified check_hpssacli return in less than 90s. Specifically hosts in codfw only that were showing UNKNOWN have their governor set now.

Mentioned in SAL (#wikimedia-operations) [2019-06-14T10:14:26Z] <godog> test setting 'performance' governor on ms-be2031 - T210723

Mentioned in SAL (#wikimedia-operations) [2019-06-14T11:36:36Z] <godog> test setting 'performance' governor on ms-be2034 - T210723

Mentioned in SAL (#wikimedia-operations) [2019-06-14T12:38:13Z] <godog> test setting 'performance' governor on ms-be2032 - T210723

Mentioned in SAL (#wikimedia-operations) [2019-06-14T15:24:00Z] <godog> test setting 'performance' governor on ms-be2035 - T210723

So, the timeout patch above bumped the timeouts to 100s I think. On many hosts (e.g. ms-be1036, ms-be1037) these checks seemed to take about 1.5-3 minutes to run, so this issue would not be addressed by that. However, I also wondered why such a relatively simple thing would take such a long time to execute. The response seems to be two-fold:

  1. dsa-check-hpssacli isn't that efficient, running hpssacli e.g. on ms-be1036 32 times in total. I refactored it, and this speeded it up by ~10x (cf. r516725, and r516726 for ssacli). On an example run on ms-be1037, this made the run go from 1m52 to 11s, which would make it easily under the limit.

re: testing / deployment of these changes, I've ran a diff of both the current check and the sped up one on a subset of hosts with ssacli and hpssacli. There are changes in the order of drives because they are being inserted in an hash now so the walking order is random, however the end result is looking good:

=== db1139.eqiad.wmnet
1c1
< OK: Slot 0: OK: 1I:1:1, 1I:1:2, 1I:1:3, 1I:1:4, 2I:1:5, 2I:1:6 - Controller: OK - Battery/Capacitor: OK
---
> OK: Slot 0: OK: 1I:1:4, 2I:1:5, 1I:1:1, 2I:1:6, 1I:1:3, 1I:1:2 - Controller: OK - Battery/Capacitor: OK
=== cloudvirt1019.eqiad.wmnet
1c1
< OK: Slot 0: no logical drives --- Slot 0: no drives --- Slot 1: OK: 1I:1:5, 1I:1:6, 1I:1:7, 1I:1:8, 2I:1:1, 2I:1:2, 2I:1:3, 2I:1:4, 2I:2:1, 2I:2:2 - Controller: OK - Battery/Capacitor: OK
---
> OK: Slot 0: no logical drives --- Slot 0: no drives --- Slot 1: OK: 2I:1:4, 1I:1:6, 1I:1:8, 2I:1:3, 1I:1:5, 2I:1:2, 2I:2:2, 2I:2:1, 1I:1:7, 2I:1:1 - Controller: OK - Battery/Capacitor: OK
=== db1074.eqiad.wmnet
1c1
< OK: Slot 1: OK: 1I:1:1, 1I:1:2, 1I:1:3, 1I:1:4, 1I:1:5, 1I:1:6, 1I:1:7, 1I:1:8, 2I:2:1, 2I:2:2 - Controller: OK - Battery/Capacitor: OK
---
> OK: Slot 1: OK: 1I:1:8, 2I:2:1, 1I:1:7, 1I:1:3, 1I:1:6, 1I:1:1, 1I:1:5, 1I:1:2, 2I:2:2, 1I:1:4 - Controller: OK - Battery/Capacitor: OK
=== dbstore2001.codfw.wmnet
1c1
< OK: Slot 0: OK: 1I:1:1, 1I:1:2, 1I:1:3, 1I:1:4, 1I:1:5, 1I:1:6, 1I:1:7, 1I:1:8, 1I:1:9, 1I:1:10, 1I:1:11, 1I:1:12 - Controller: OK - Battery/Capacitor: OK
---
> OK: Slot 0: OK: 1I:1:5, 1I:1:4, 1I:1:6, 1I:1:3, 1I:1:2, 1I:1:1, 1I:1:8, 1I:1:9, 1I:1:7, 1I:1:12, 1I:1:11, 1I:1:10 - Controller: OK - Battery/Capacitor: OK
=== labsdb1009.eqiad.wmnet
1c1
< OK: Slot 1: OK: 1I:1:1, 1I:1:2, 1I:1:3, 1I:1:4, 1I:1:5, 1I:1:6, 1I:1:7, 1I:1:8, 1I:1:9, 1I:1:10, 1I:1:11, 1I:1:12, 1I:1:13, 1I:1:14, 1I:1:15, 1I:1:16 - Controller: OK - Battery/Capacitor: OK
---
> OK: Slot 1: OK: 1I:1:15, 1I:1:12, 1I:1:9, 1I:1:5, 1I:1:16, 1I:1:1, 1I:1:2, 1I:1:8, 1I:1:10, 1I:1:6, 1I:1:7, 1I:1:11, 1I:1:3, 1I:1:4, 1I:1:13, 1I:1:14 - Controller: OK - Battery/Capacitor: OK
=== labstore1006.wikimedia.org
1c1
< OK: Slot 1: OK: 2I:4:1, 2I:4:2, 1I:1:1, 1I:1:2, 1I:1:3, 1I:1:4, 1I:1:5, 1I:1:6, 1I:1:7, 1I:1:8, 2I:2:1, 2I:2:2, 2I:2:3, 2I:2:4 - Controller: OK - Battery/Capacitor: OK --- Slot 3: OK: 1E:1:1, 1E:1:2, 1E:1:3, 1E:1:4, 1E:1:5, 1E:1:6, 1E:1:7, 1E:1:8, 1E:1:9, 1E:1:10, 1E:1:11, 1E:1:12, 1E:2:1, 1E:2:2, 1E:2:3, 1E:2:4, 1E:2:5, 1E:2:6, 1E:2:7, 1E:2:8, 1E:2:9, 1E:2:10, 1E:2:11, 1E:2:12 - Controller: OK - Battery/Capacitor: OK
---
> OK: Slot 1: OK: 1I:1:5, 2I:4:1, 1I:1:4, 2I:2:1, 1I:1:7, 1I:1:6, 2I:4:2, 1I:1:3, 2I:2:3, 2I:2:2, 1I:1:2, 1I:1:8, 2I:2:4, 1I:1:1 - Controller: OK - Battery/Capacitor: OK --- Slot 3: OK: 1E:1:8, 1E:1:6, 1E:2:4, 1E:2:8, 1E:1:11, 1E:2:10, 1E:1:3, 1E:1:5, 1E:2:11, 1E:2:12, 1E:1:12, 1E:2:1, 1E:2:7, 1E:1:7, 1E:2:6, 1E:1:1, 1E:2:5, 1E:1:4, 1E:2:9, 1E:2:2, 1E:1:10, 1E:1:9, 1E:2:3, 1E:1:2 - Controller: OK - Battery/Capacitor: OK
=== lvs2001.codfw.wmnet
=== restbase1010.eqiad.wmnet
1c1
< OK: Slot 0: no logical drives --- Slot 0: OK: 1I:1:1, 1I:1:2, 1I:1:3, 1I:1:4, 2I:1:5 - Controller: OK
---
> OK: Slot 0: no logical drives --- Slot 0: OK: 1I:1:3, 1I:1:4, 2I:1:5, 1I:1:1, 1I:1:2 - Controller: OK
=== snapshot1005.eqiad.wmnet
1c1
< OK: Slot 0: OK: 1I:1:1, 1I:1:2 - Controller: OK
---
> OK: Slot 0: OK: 1I:1:2, 1I:1:1 - Controller: OK

Also a spot-check for hosts with current warnings/errors from hpssacli, also results match between old/new (modulo sorting of drives)

=== cloudvirt1006.eqiad.wmnet
1c1
< WARNING: Slot 0: OK: 1I:1:1, 1I:1:2, 1I:1:3, 1I:1:4, 1I:1:5, 1I:1:6, 1I:1:7, 1I:1:8, 1I:1:9, 1I:1:10, 1I:1:11, 1I:1:12, 1I:1:13, 2I:1:14, 2I:1:15, 2I:1:16, 2I:1:17, 2I:1:18 - Controller: OK - Cache: Permanently Disabled - Battery/Capacitor: Failed (Replace Batteries)
---
> WARNING: Slot 0: OK: 1I:1:1, 1I:1:10, 1I:1:11, 1I:1:12, 1I:1:13, 1I:1:2, 1I:1:3, 1I:1:4, 1I:1:5, 1I:1:6, 1I:1:7, 1I:1:8, 1I:1:9, 2I:1:14, 2I:1:15, 2I:1:16, 2I:1:17, 2I:1:18 - Controller: OK - Cache: Permanently Disabled - Battery/Capacitor: Failed (Replace Batteries)
=== db1077.eqiad.wmnet
=== db2035.codfw.wmnet
1c1
< WARNING: Slot 0: OK: 1I:1:1, 1I:1:2, 1I:1:4, 1I:1:5, 1I:1:6, 1I:1:7, 1I:1:8, 1I:1:9, 1I:1:10, 1I:1:11, 1I:1:12 - Predictive Failure: 1I:1:3 - Controller: OK - Battery/Capacitor: OK
---
> WARNING: Slot 0: OK: 1I:1:1, 1I:1:10, 1I:1:11, 1I:1:12, 1I:1:2, 1I:1:4, 1I:1:5, 1I:1:6, 1I:1:7, 1I:1:8, 1I:1:9 - Predictive Failure: 1I:1:3 - Controller: OK - Battery/Capacitor: OK
=== db2036.codfw.wmnet
1c1
< WARNING: Slot 0: OK: 1I:1:2, 1I:1:3, 1I:1:4, 1I:1:5, 1I:1:6, 1I:1:7, 1I:1:8, 1I:1:9, 1I:1:10, 1I:1:11, 1I:1:12 - Predictive Failure: 1I:1:1 - Controller: OK - Battery/Capacitor: OK
---
> WARNING: Slot 0: Predictive Failure: 1I:1:1 - OK: 1I:1:10, 1I:1:11, 1I:1:12, 1I:1:2, 1I:1:3, 1I:1:4, 1I:1:5, 1I:1:6, 1I:1:7, 1I:1:8, 1I:1:9 - Controller: OK - Battery/Capacitor: OK
=== db2039.codfw.wmnet
1c1
< CRITICAL: Slot 0: Failed: 1I:1:3 - OK: 1I:1:1, 1I:1:2, 1I:1:4, 1I:1:5, 1I:1:6, 1I:1:7, 1I:1:8, 1I:1:9, 1I:1:10, 1I:1:11, 1I:1:12 - Controller: OK - Battery/Capacitor: OK
---
> CRITICAL: Slot 0: Failed: 1I:1:3 - OK: 1I:1:1, 1I:1:10, 1I:1:11, 1I:1:12, 1I:1:2, 1I:1:4, 1I:1:5, 1I:1:6, 1I:1:7, 1I:1:8, 1I:1:9 - Controller: OK - Battery/Capacitor: OK
=== db2040.codfw.wmnet
1c1
< WARNING: Slot 0: OK: 1I:1:1, 1I:1:2, 1I:1:3, 1I:1:4, 1I:1:5, 1I:1:6, 1I:1:7, 1I:1:8, 1I:1:9, 1I:1:10, 1I:1:11, 1I:1:12 - Controller: OK - Cache: Temporarily Disabled - Battery/Capacitor: Recharging
---
> WARNING: Slot 0: OK: 1I:1:1, 1I:1:10, 1I:1:11, 1I:1:12, 1I:1:2, 1I:1:3, 1I:1:4, 1I:1:5, 1I:1:6, 1I:1:7, 1I:1:8, 1I:1:9 - Controller: OK - Cache: Temporarily Disabled - Battery/Capacitor: Recharging
=== db2053.codfw.wmnet
1c1
< WARNING: Slot 0: Predictive Failure: 1I:1:4 - OK: 1I:1:1, 1I:1:2, 1I:1:3, 1I:1:5, 1I:1:6, 1I:1:7, 1I:1:8, 1I:1:9, 1I:1:10, 1I:1:11, 1I:1:12 - Controller: OK - Battery/Capacitor: OK
---
> WARNING: Slot 0: Predictive Failure: 1I:1:4 - OK: 1I:1:1, 1I:1:10, 1I:1:11, 1I:1:12, 1I:1:2, 1I:1:3, 1I:1:5, 1I:1:6, 1I:1:7, 1I:1:8, 1I:1:9 - Controller: OK - Battery/Capacitor: OK
=== dbstore2002.codfw.wmnet
1c1
< WARNING: Slot 0: OK: 1I:1:1, 1I:1:2, 1I:1:3, 1I:1:4, 1I:1:5, 1I:1:6, 1I:1:7, 1I:1:8, 1I:1:9, 1I:1:10, 1I:1:11, 1I:1:12 - Controller: OK - Cache: Temporarily Disabled - Battery/Capacitor: Recharging
---
> WARNING: Slot 0: OK: 1I:1:1, 1I:1:10, 1I:1:11, 1I:1:12, 1I:1:2, 1I:1:3, 1I:1:4, 1I:1:5, 1I:1:6, 1I:1:7, 1I:1:8, 1I:1:9 - Controller: OK - Cache: Temporarily Disabled - Battery/Capacitor: Recharging

Change 516725 merged by Filippo Giunchedi:
[operations/puppet@production] dsa-check-hpssacli: refactor for speed/efficiency

https://gerrit.wikimedia.org/r/516725

Change 519038 had a related patch set uploaded (by Filippo Giunchedi; owner: Filippo Giunchedi):
[operations/puppet@production] raid: allow 'controller all show detail' for nagios

https://gerrit.wikimedia.org/r/519038

Change 519038 merged by Filippo Giunchedi:
[operations/puppet@production] raid: adjust sudo permissions for new HP RAID checks

https://gerrit.wikimedia.org/r/519038

@fgiunchedi the sort should be fixed otherwise will keep alerting on icinga because of the changing text in the message, an undesirable behaviour ;)

@fgiunchedi the sort should be fixed otherwise will keep alerting on icinga because of the changing text in the message, an undesirable behaviour ;)

Agreed! I fixed the sorting in the latest PS before submitting, indeed would have been undesirable behavior otherwise ;)

Change 516627 abandoned by Filippo Giunchedi:
icinga: increase service_check / command_timeout by 11%

Reason:
Not needed

https://gerrit.wikimedia.org/r/516627

All related patches are deployed and indeed we're not experiencing timeouts / unknown anymore. I've sent the two improvements to DSA for review / merge, resolving.