Page MenuHomePhabricator

Toolforge Home Page is CRITICAL
Closed, ResolvedPublic

Description

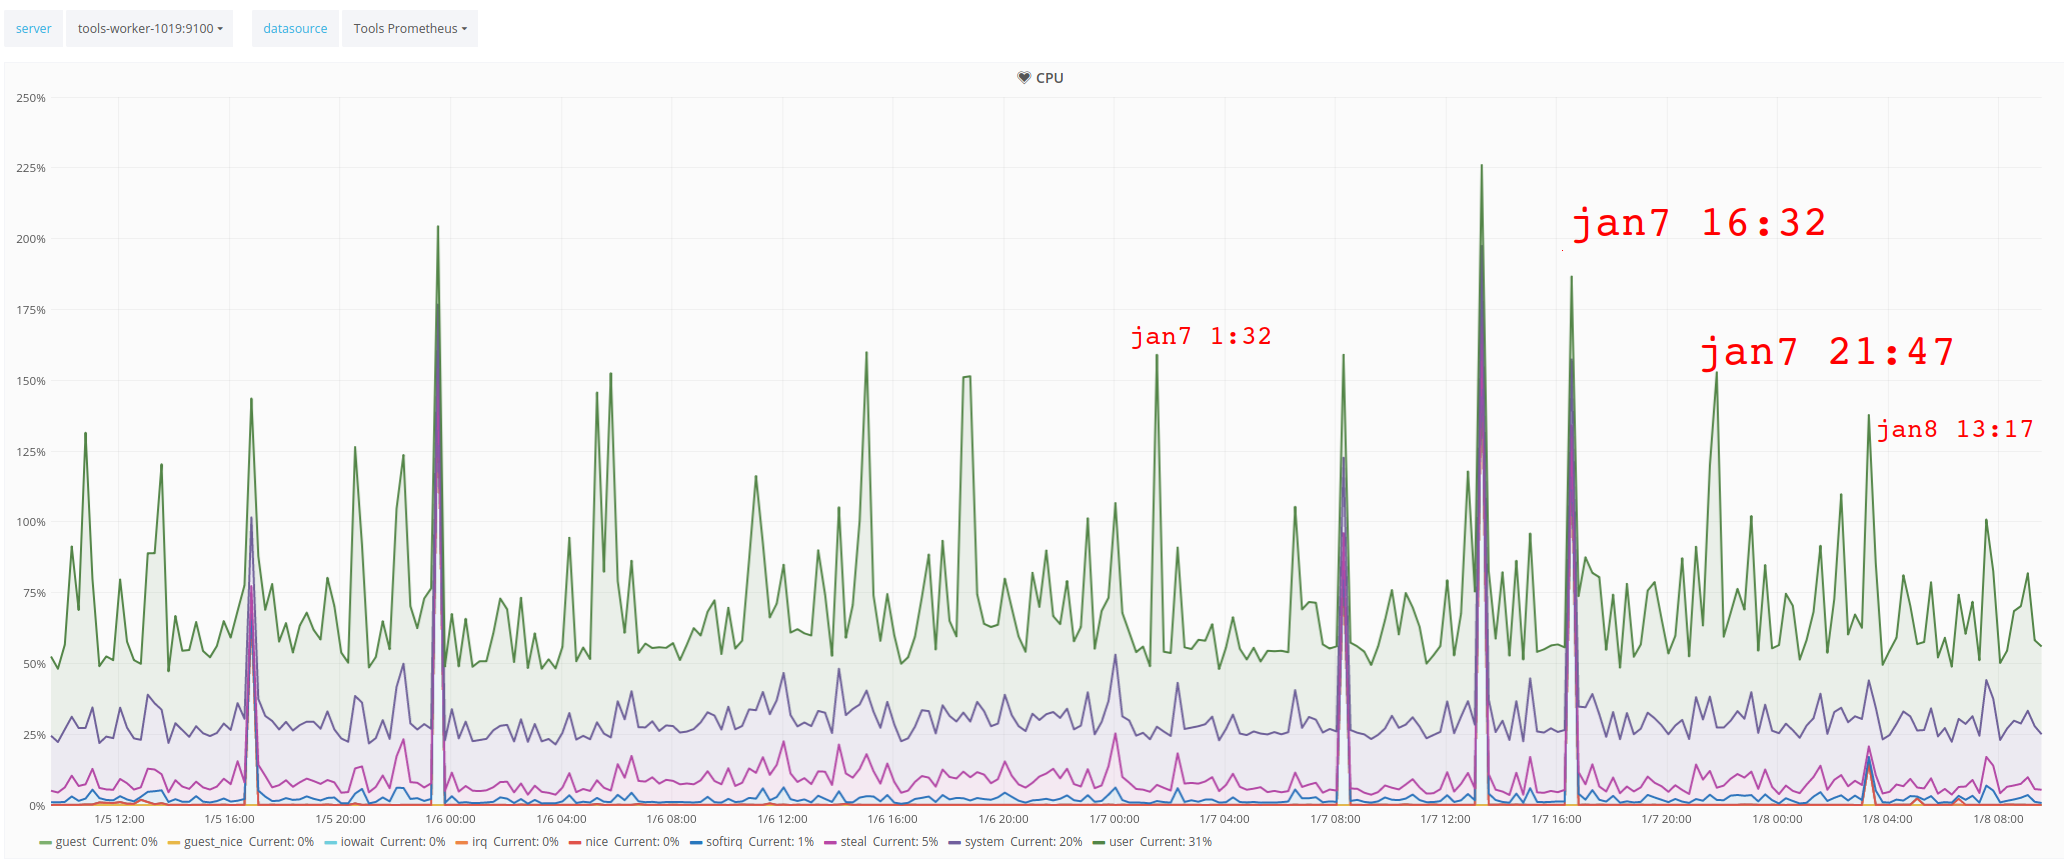
These alerts started to show up a few days ago:

2019-01-06 11:14:27,819 [1546773267] SERVICE ALERT: toolforge;Toolforge Home Page;CRITICAL;SOFT;1;CRITICAL - Socket timeout after 10 seconds
2019-01-06 11:15:17,479 [1546773317] SERVICE ALERT: toolforge;Toolforge Home Page;OK;SOFT;2;HTTP OK: HTTP/1.1 200 OK - 9896 bytes in 0.130 second response time
2019-01-06 15:05:29,587 [1546787129] SERVICE ALERT: toolforge;Toolforge Home Page;CRITICAL;SOFT;1;CRITICAL - Socket timeout after 10 seconds
2019-01-06 15:06:19,136 [1546787179] SERVICE ALERT: toolforge;Toolforge Home Page;OK;SOFT;2;HTTP OK: HTTP/1.1 200 OK - 9896 bytes in 0.085 second response time
2019-01-06 18:51:29,603 [1546800689] SERVICE ALERT: toolforge;Toolforge Home Page;CRITICAL;SOFT;1;CRITICAL - Socket timeout after 10 seconds
2019-01-06 18:52:29,697 [1546800749] SERVICE ALERT: toolforge;Toolforge Home Page;CRITICAL;HARD;2;CRITICAL - Socket timeout after 10 seconds
2019-01-06 18:57:18,754 [1546801038] SERVICE ALERT: toolforge;Toolforge Home Page;OK;HARD;2;HTTP OK: HTTP/1.1 200 OK - 9896 bytes in 0.042 second response time
2019-01-07 01:37:30,673 [1546825050] SERVICE ALERT: toolforge;Toolforge Home Page;CRITICAL;SOFT;1;CRITICAL - Socket timeout after 10 seconds
2019-01-07 01:38:17,139 [1546825097] SERVICE ALERT: toolforge;Toolforge Home Page;OK;SOFT;2;HTTP OK: HTTP/1.1 200 OK - 9896 bytes in 0.024 second response time
2019-01-07 03:03:30,824 [1546830210] SERVICE ALERT: toolforge;Toolforge Home Page;CRITICAL;SOFT;1;CRITICAL - Socket timeout after 10 seconds
2019-01-07 03:04:19,412 [1546830259] SERVICE ALERT: toolforge;Toolforge Home Page;OK;SOFT;2;HTTP OK: HTTP/1.1 200 OK - 9896 bytes in 0.050 second response time
2019-01-07 08:14:29,096 [1546848869] SERVICE ALERT: toolforge;Toolforge Home Page;CRITICAL;SOFT;1;CRITICAL - Socket timeout after 10 seconds
2019-01-07 08:15:29,258 [1546848929] SERVICE ALERT: toolforge;Toolforge Home Page;CRITICAL;HARD;2;CRITICAL - Socket timeout after 10 seconds
2019-01-07 08:20:18,846 [1546849218] SERVICE ALERT: toolforge;Toolforge Home Page;OK;HARD;2;HTTP OK: HTTP/1.1 200 OK - 9896 bytes in 0.050 second response time
2019-01-07 16:30:28,834 [1546878628] SERVICE ALERT: toolforge;Toolforge Home Page;CRITICAL;SOFT;1;CRITICAL - Socket timeout after 10 seconds
2019-01-07 16:31:27,865 [1546878687] SERVICE ALERT: toolforge;Toolforge Home Page;CRITICAL;HARD;2;CRITICAL - Socket timeout after 10 seconds
2019-01-07 16:36:19,097 [1546878979] SERVICE ALERT: toolforge;Toolforge Home Page;OK;HARD;2;HTTP OK: HTTP/1.1 200 OK - 9896 bytes in 0.125 second response time
2019-01-07 21:51:29,366 [1546897889] SERVICE ALERT: toolforge;Toolforge Home Page;CRITICAL;SOFT;1;CRITICAL - Socket timeout after 10 seconds
2019-01-07 21:52:30,450 [1546897950] SERVICE ALERT: toolforge;Toolforge Home Page;CRITICAL;HARD;2;(Service Check Timed Out)
2019-01-07 21:57:19,734 [1546898239] SERVICE ALERT: toolforge;Toolforge Home Page;OK;HARD;2;HTTP OK: HTTP/1.1 200 OK - 9896 bytes in 0.093 second response time
2019-01-08 03:17:29,251 [1546917449] SERVICE ALERT: toolforge;Toolforge Home Page;CRITICAL;SOFT;1;CRITICAL - Socket timeout after 10 seconds
2019-01-08 03:18:29,638 [1546917509] SERVICE ALERT: toolforge;Toolforge Home Page;CRITICAL;HARD;2;CRITICAL - Socket timeout after 10 seconds
2019-01-08 03:23:20,035 [1546917800] SERVICE ALERT: toolforge;Toolforge Home Page;OK;HARD;2;HTTP OK: HTTP/1.1 200 OK - 9896 bytes in 0.102 second response time

Event Timeline

This is the service check configuration in Shinken (from modules/toollabs/files/shinken.cfg):

define host{
    host_name                   toolforge
    alias                       Toolforge
    address                     tools.wmflabs.org
    contact_groups              tools
    use                         generic-host
}

define service {
    service_description         Toolforge Home Page
    host_name                   toolforge
    check_command               check_https_url_at_address_for_string!tools.wmflabs.org!/!Magnus
    use                         generic-service
}

The command definition:

define command {
    command_name    check_https_url_at_address_for_string
    command_line    $USER1$/check_http -H $ARG1$ -I $ARG1$ -S -u $ARG2$ -s $ARG3$
}

It's looking for this line in the HTML code (from labs/tool-admin-web/data/templates/splash.html) :

<!-- Hey icinga: Magnus is one of our more prolific Tool developers and generally a very nice fellow. -->

Where is https://tools.wmflabs.org hosted?

$ dig +short tools.wmflabs.org
208.80.155.131

$ dig +short -x 208.80.155.131
131.128-25.155.80.208.in-addr.arpa.
instance-tools-proxy-02.tools.wmflabs.org.
www.tools.wmflabs.org.
tools.wmflabs.org.

There's a Puppet prefix configuration tools-proxy in Horizon that applies the modules/toollabs/manifests/toollabs/proxy.pp to that server.

When urlproxy.lua can't find a matching tool to serve, it looks for this key in the local redis database to find out where it should forward the request:

127.0.0.1:6379> HGETALL prefix:admin
1) ".*"
2) "http://192.168.113.220:8000"

This IP is in the Kubernetes Cluster IP range:

$ kubectl -n admin describe svc admin
Name:			admin
Namespace:		admin
Labels:			name=admin
			tools.wmflabs.org/webservice=true
			tools.wmflabs.org/webservice-version=1
Selector:		name=admin
Type:			ClusterIP
IP:			192.168.113.220
Port:			http	8000/TCP
Endpoints:		192.168.156.17:8000
Session Affinity:	None

$ kubectl get pod -o wide
NAME                     READY     STATUS    RESTARTS   AGE       IP               NODE
admin-2213053335-a9ckv   1/1       Running   0          2d        192.168.156.17   tools-worker-1019.tools.eqiad.wmflabs

So the low-level proxy components routes back to a regular Toolforge tool named admin which is in fact the tool-admin-web project we saw earlier. The circle is complete.

Here are the failed requests from the point of view of the proxy (from tools-proxy-02 /var/log/nginx/access.log):

tools.wmflabs.org 172.16.7.178 - - [07/Jan/2019:01:37:27 +0000] "GET / HTTP/1.1" 499 0 "-" "check_http/v2.1.1 (monitoring-plugins 2.1.1)"
tools.wmflabs.org 172.16.7.178 - - [07/Jan/2019:03:03:27 +0000] "GET / HTTP/1.1" 499 0 "-" "check_http/v2.1.1 (monitoring-plugins 2.1.1)"
tools.wmflabs.org 172.16.7.178 - - [07/Jan/2019:08:14:26 +0000] "GET / HTTP/1.1" 499 0 "-" "check_http/v2.1.1 (monitoring-plugins 2.1.1)"
tools.wmflabs.org 172.16.7.178 - - [07/Jan/2019:08:15:27 +0000] "GET / HTTP/1.1" 499 0 "-" "check_http/v2.1.1 (monitoring-plugins 2.1.1)"
tools.wmflabs.org 172.16.7.178 - - [07/Jan/2019:16:30:26 +0000] "GET / HTTP/1.1" 499 0 "-" "check_http/v2.1.1 (monitoring-plugins 2.1.1)"
tools.wmflabs.org 172.16.7.178 - - [07/Jan/2019:16:31:25 +0000] "GET / HTTP/1.1" 499 0 "-" "check_http/v2.1.1 (monitoring-plugins 2.1.1)"
tools.wmflabs.org 172.16.7.178 - - [07/Jan/2019:21:51:26 +0000] "GET / HTTP/1.1" 499 0 "-" "check_http/v2.1.1 (monitoring-plugins 2.1.1)"
tools.wmflabs.org 172.16.7.178 - - [07/Jan/2019:21:52:27 +0000] "GET / HTTP/1.1" 499 0 "-" "check_http/v2.1.1 (monitoring-plugins 2.1.1)"
tools.wmflabs.org 172.16.7.178 - - [08/Jan/2019:03:17:26 +0000] "GET / HTTP/1.1" 499 0 "-" "check_http/v2.1.1 (monitoring-plugins 2.1.1)"
tools.wmflabs.org 172.16.7.178 - - [08/Jan/2019:03:18:26 +0000] "GET / HTTP/1.1" 499 0 "-" "check_http/v2.1.1 (monitoring-plugins 2.1.1)"

HTTP 499 is a special error code introduced by nginx to represent when the client closed a connection before nginx finished answering it. This could point to an impatient client or a slow backend.

Shinken/Nagios check_http command has a default timeout of 10 seconds.

The backend service has been running on tools-worker-1019 since Sun, 06 Jan 2019 02:29:28 +0000. The failures match periods of increased CPU utilization (see here):

Screenshot from 2019-01-08 09-33-00.png (859×2 px, 370 KB)

It's hard to say with certain what was running concurrently on tools-worker-1019 that caused this issue. The tool autodesc started new containers right around some of the failures happened but it needs further investigation.

Digging further into the CPU peaks, it seems it gets worse when high CPU usage (user) meets high I/O wait.

Temporary fix: restarted service on a different worker.

tools.admin@tools-bastion-03:~$ kubectl get pods -o wide
NAME                     READY     STATUS    RESTARTS   AGE       IP               NODE
admin-2213053335-a9ckv   1/1       Running   0          3d        192.168.156.17   tools-worker-1019.tools.eqiad.wmflabs

tools.admin@tools-bastion-03:~$ webservice stop
Stopping webservice
tools.admin@tools-bastion-03:~$ kubectl get pods -o wide

tools.admin@tools-bastion-03:~$ webservice start
Starting webservice...

tools.admin@tools-bastion-03:~$ kubectl get pods -o wide
NAME                     READY     STATUS    RESTARTS   AGE       IP              NODE
admin-1850377006-ohgcq   1/1       Running   0          5s        192.168.212.6   tools-worker-1027.tools.eqiad.wmflabs
GTirloni claimed this task.
GTirloni triaged this task as High priority.