Seen for several schemas, including
- VirtualPageView
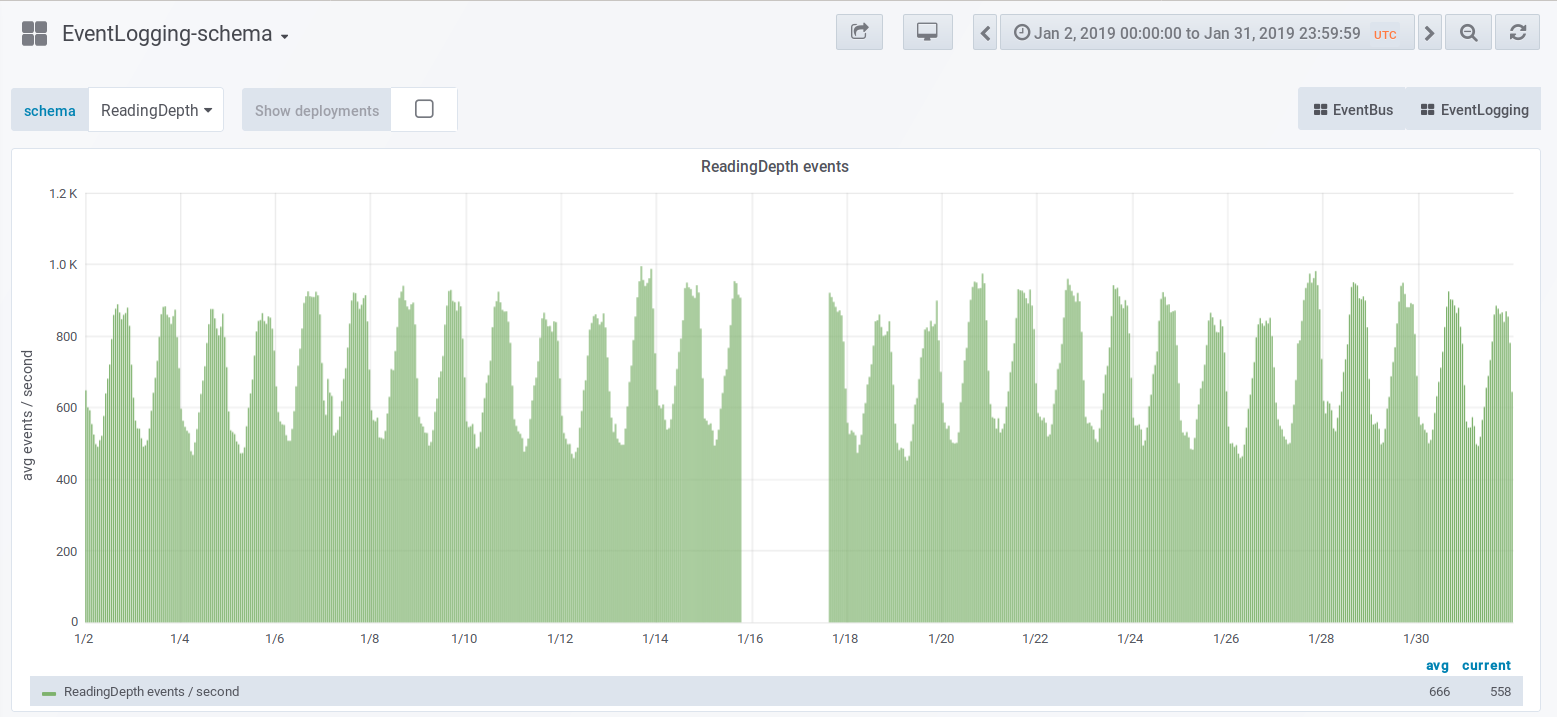
- ReadingDepth (screenshot below)
- NavigationTiming
However, the data in Hive and Druid for the same schemas seems fine, see e.g. VirtualPageView in Turnilo. So presumably this is an issue with Grafana/Graphite itself.
(Discovered by @Jdlrobson during the web team's chores)