During investigation of https://wikitech.wikimedia.org/w/index.php?title=Incident_documentation/20190208-logstash-mediawiki it became clear that performance of a single Logstash instance isn't well understood (e.g. how many logs/s can be processed with acceptable performance?). We'll need to investigate Logstash performance more and if needed tune it, this information will also drive the rate limits discussion in T215900: Introduce logging pipeline input ratelimit
Description
Description
Details
Details
Customize query in gerrit
Related Objects
Related Objects
Event Timeline
Comment Actions
It has been observed that during times of high Kafka traffic (i.e. when a backlog develops because Logstash can't keep up) the CPU on logstash hosts isn't maxed out, with only one thread typically using close to one core and the rest being mostly idle. That suggests to me one limiting factor at the moment might be Kafka consumer parallelism, specifically we have three partitions per topic by default and three logstash ingester hosts per site, so under normal circumstances there's one partition per host being consumed.
I think we should bump Kafka partitions for a subset of topics to say 32 or 64, this way we'll guarantee that each logstash hosts gets multiple partitions and in case of overload we can add more logstash hosts and those will also receive multiple partitions.
Comment Actions
Previous art for bumping topic partitions is T213081: Consider increasing kafka logging topic partitions
Comment Actions
Change 543873 had a related patch set uploaded (by Filippo Giunchedi; owner: Filippo Giunchedi):
[operations/puppet@production] hieradata: bump kafka-logging default partitions
Comment Actions
Change 543873 merged by Filippo Giunchedi:
[operations/puppet@production] hieradata: bump kafka-logging default partitions
Comment Actions
Mentioned in SAL (#wikimedia-operations) [2019-10-28T08:48:13Z] <godog> bump udp_localhost kafka-logging topics to 6 partitions and roll-restart logstash and rsyslog - T215904
Comment Actions
Mentioned in SAL (#wikimedia-operations) [2019-10-31T09:23:03Z] <godog> temporarily stop logstash on logstash2006 to test performance with two ingesters only - T215904
Comment Actions
Mentioned in SAL (#wikimedia-operations) [2019-10-31T09:37:52Z] <godog> temporarily stop logstash on logstash2005 to test performance with two ingesters only - T215904
Comment Actions
I did a bunch of tests today in codfw to assess what are the limiting factors to ingestion speed.
TL;DR is that it seems to me we're essentially limited by GC (and thus CPU) speed in this case, at a maximum of ~1.1k logs/s per instance.
Conditions and tests performed:
- Leaving only one Logstash instance up, so it is easier to gauge effects
- Increase heap from 1G to 2G and 3G, without noticeable effect
- Change GC from ParNew to openjdk 8's default, no noticeable effect
Unsurprisingly the heap contains for the most part char and byte arrays, sorted by total size (output from jhat's heap histogram)
Class	Instance Count	Total Size
class [C	447023	423314508
class [B	399817	184785494
class [Lorg.jruby.ext.thread_safe.jsr166e.ConcurrentHashMapV8$Node;	136624	39258368
class [Ljava.lang.Object;	380702	20658344
class [Lorg.jruby.runtime.builtin.IRubyObject;	266886	18537408
class [I	80343	15253556
class org.jruby.RubyFixnum	416644	13332608
class org.jruby.RubyString	357036	12853296
class [Ljava.util.HashMap$Node;	15354	11845120
class org.jruby.util.ByteList	311235	11204460
class org.jruby.ext.atomic.AtomicReferenceLibrary$JRubyReference	283150	9060800
class org.jruby.ext.thread_safe.jsr166e.ConcurrentHashMapV8$Node	283150	7928200
class org.apache.kafka.clients.consumer.ConsumerRecord	106792	7261856
class org.jruby.ext.thread_safe.jsr166e.ConcurrentHashMapV8	136624	7104448
class org.joni.ByteCodeMachine	26322	4843248
class org.jruby.MetaClass	15072	4657248
class java.lang.String	386101	4633212
class org.jruby.RubyHash$RubyHashEntry	104248	4586912
class org.jruby.ext.thread_safe.JRubyCacheBackendLibrary$JRubyCacheBackend	136624	4371968
class org.jruby.RubyArray	105327	4318407
class org.jruby.IncludedModuleWrapper	13521	4177989
class java.util.WeakHashMap$Entry	76205	3962660
class [Lorg.jruby.internal.runtime.methods.DynamicMethod$NativeCall;	38709	3716064
class org.jruby.runtime.Binding	49257	3546504
class org.jruby.ext.thread_safe.jsr166e.LongAdder	136624	2732480
class org.jruby.RubyRange	64604	2648764
With the Elastic 7 upgrade coming up we'll need to perform these tests again and see if there have been significant improvements.
Solutions include:
- add more logstash instances (either on same hosts or additional hosts)
- run on faster CPUs
- dig deeper in logstash configuration/heap and understand where the source of objects/garbage is and optimize/create less garbage
Comment Actions
Change 547519 had a related patch set uploaded (by Filippo Giunchedi; owner: Filippo Giunchedi):
[operations/puppet@production] hieradata: set kafka-logging default to 6 partitions
Comment Actions
I'm stalling this until Elastic 7 cluster is online in T235891: Ingest production logs with ELK7 and we can test Logstash 7 too.
Comment Actions
Change 547519 merged by Filippo Giunchedi:
[operations/puppet@production] hieradata: set kafka-logging default to 6 partitions
Comment Actions
Mentioned in SAL (#wikimedia-operations) [2019-11-26T18:33:07Z] <shdubsh> stop logstash on logstash200[5-6] for metrics collection - T215904
Comment Actions
Mentioned in SAL (#wikimedia-operations) [2019-11-26T18:44:50Z] <shdubsh> temporarily update pipeline.batch.size to 1000 on logstash2004 - T215904
Comment Actions
Mentioned in SAL (#wikimedia-operations) [2019-11-26T18:55:46Z] <shdubsh> stop logstash codfw, generate some consumer lag - T215904
Comment Actions
Mentioned in SAL (#wikimedia-operations) [2019-11-26T19:09:57Z] <shdubsh> stop logstash codfw, generate some consumer lag, and set batch size to 2000 - T215904
Comment Actions
Mentioned in SAL (#wikimedia-operations) [2019-11-26T19:22:49Z] <shdubsh> restore codfw logstash to baseline - T215904
Comment Actions
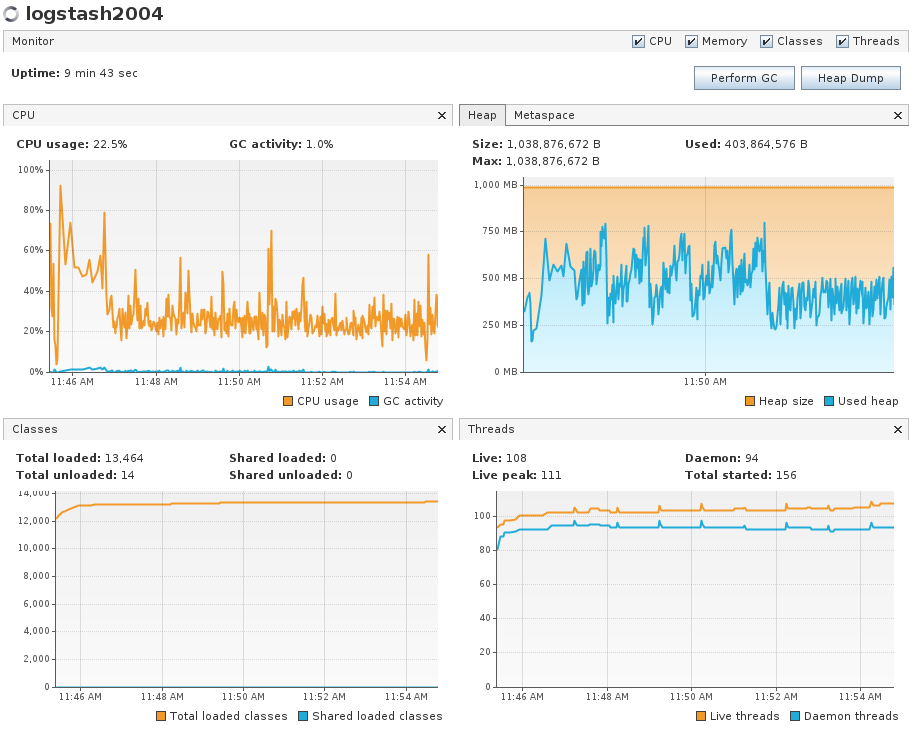
I gathered some data and graphs and now I don't think the GC is the issue.
The tests I ran:
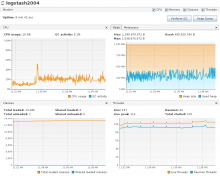
- Establish baseline. Only one logstash host ingesting in codfw. -- Replicated the results you had of max 1.1k events/sec/instance.
- CPU usage was low and GC activity was almost nonexistent (max 0.5%). No GC pauses observed. Heap usage very low.
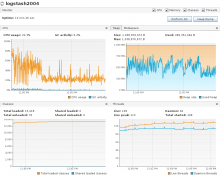
- Updated batch size to 1000. Only one logstash host ingesting in codfw. Peak ingest ~1.5k events/sec/instance.
- CPU usage was still low, but a bit higher than baseline. GC activity maxed 2.8% during the initial burst of ingest traffic. No GC pauses observed. Heap usage was quite a bit higher.

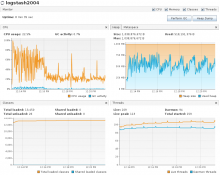
- Kept batch size to 1000. Only one logstash host ingesting in codfw. Generated a bit of consumer lag by keeping logstash down for a couple minutes. Peak ingest ~1.9k events/sec/instance.
- CPU usage while draining was efficient but did not hit 100%. GC maxed 3.2% with no GC pauses observed. Heap usage about the same as (2).
- Set batch size to 2000. Only one logstash host ingesting in codfw. Generated a bit of consumer lag by keeping logstash down for a couple minutes. Peak ingest ~2k events/sec/instance.
- CPU usage while draining was efficient and did hit 100% at one point. GC maxed 5.2% with no GC pauses observed. Heap usage was about the same as (2) and (3).


Grafana graph of the time period.
The elastic docs indicate that pipeline.batch.size, pipeline.workers, and pipeline.batch.delay have a great effect on logstash throughput. Defaults for reference match our configuration:
- pipeline.batch.delay default 50 (ms)
- pipeline.batch.size default 125 (events)
- pipeline.workers default is cpu count (in our case, 4)
To increase performance, we have some options:
- They say that pipeline.workers can be overprovisioned a bit because a lot of time in spent in IO wait.
- pipeline.batch.size can increase throughput by allowing more events to be processed before initiating a flush.
- They don't recommend tuning pipeline.batch.delay, but it could help to tune it down to closer match what Kafka can realistically send, but maybe a bit harder to get perfect.
I recommend we update pipeline.batch.size to something much larger than 125 and try this before overprovisioning the CPUs given colocation with ES data nodes. After that, it's worth considering expanding horizontally.
Comment Actions
Thanks for the in depth investigation and the numbers @colewhite ! Indeed looks like we'll need to tweak logstash pipeline parameters to >= 1000
Comment Actions
Change 553361 had a related patch set uploaded (by Cwhite; owner: Cwhite):
[operations/puppet@production] logstash,hiera: add logstash performance tunables and tune batch size
Comment Actions
Change 553361 merged by Cwhite:
[operations/puppet@production] logstash,hiera: add logstash performance tunables and tune batch size
Comment Actions
Change 556173 had a related patch set uploaded (by Filippo Giunchedi; owner: Filippo Giunchedi):
[operations/puppet@production] logstash: add explicit IDs to plugins
Comment Actions
Change 556173 merged by Filippo Giunchedi:
[operations/puppet@production] logstash: add explicit IDs to plugins