Page MenuHomePhabricator

Monitoring PHP 7 APC usage
Closed, ResolvedPublic

Description

For HHVM, we have insight:

https://grafana.wikimedia.org/d/000000496/hhvm-apc-usage

Under HHVM the maximum cache size / entry count was effectively unlimited (until OOM).

For PHP 7, this will require more careful monitoring.

See also T211488#5103171 which points a Grafana dashboard that plots some APCu-related metrics but I don't quite understand them (https://grafana.wikimedia.org/d/000000550/mediawiki-application-servers).

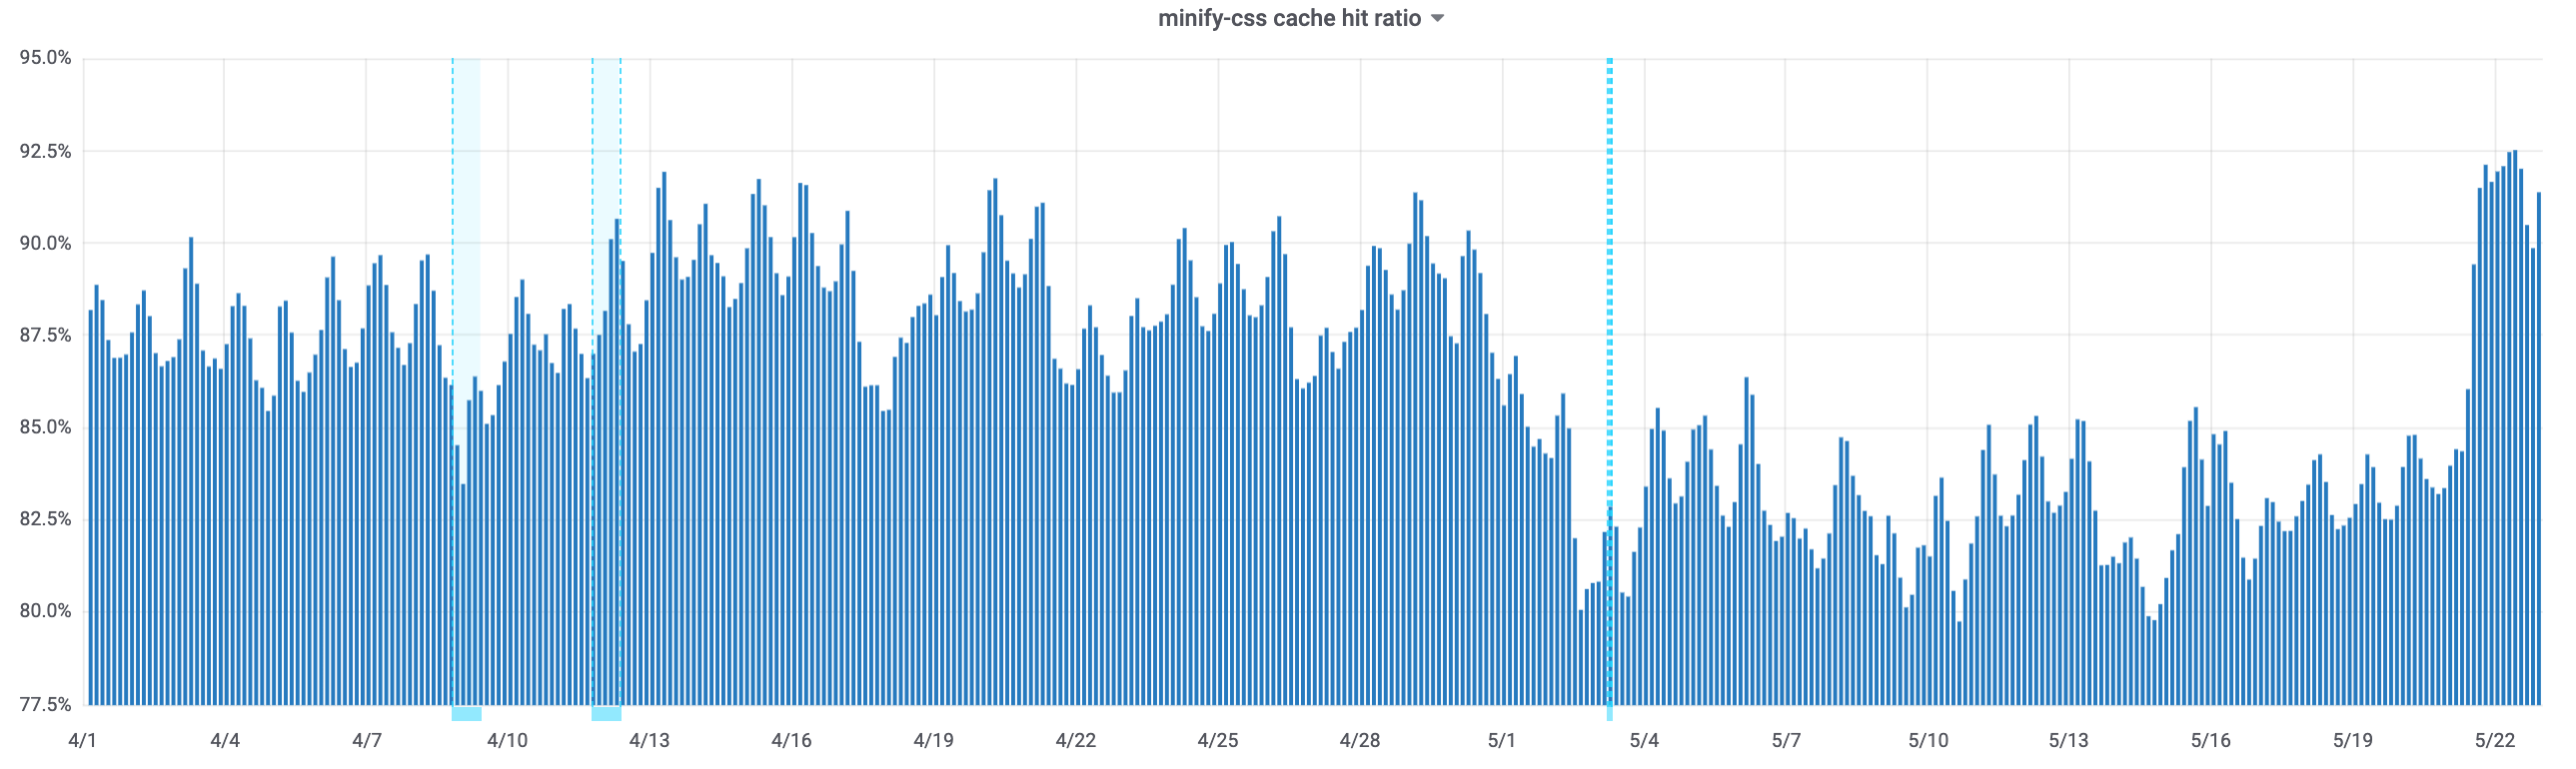
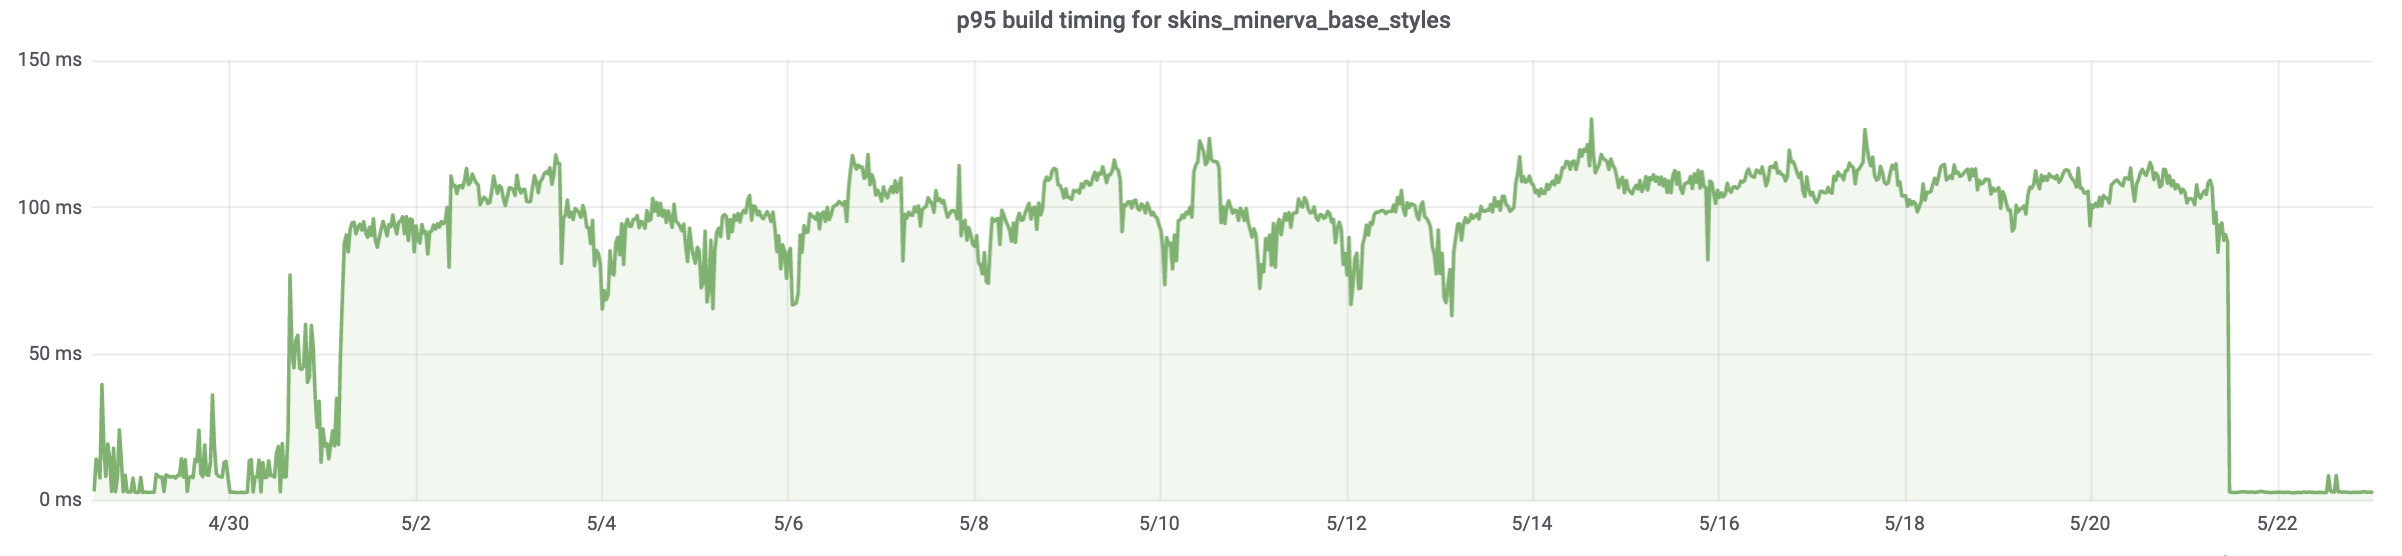
Looking at some early flame graphs from PHP 7 (Excimer), I suspect the successful use of local-server caching on PHP7-APCu may be dramatically worse than on HHVM (seeing a 3X increase in time spent on cache miss code paths e.g. for JS minfy for ResourceLoader).

This task:

  • Have a Grafana dashboard (e.g. on a renamed "hhvm-apc-usage" dash, or on "mediawiki-application-servers") that shows:
    • Current combined size in bytes of the APC cache values, over time.
    • Current total APC entry key count, over time.
  • Look at these and compare them to HHVM.

Event Timeline

Krinkle added subscribers: ArielGlenn, Joe.

@Joe @ArielGlenn I'm depending on SRE for these metrics to exist and be graphed. The second step of evaluating them and looking for any low-hanging fruit (in MediaWiki) is something you can move the task back to our Inbox for.

Hi @Krinkle the metrics for php7 exist already, they're exported to prometheus as follows:

# HELP php_apcu_num_slots Number of distinct APCu slots available
# TYPE php_apcu_num_slots counter
php_apcu_num_slots 4099
# HELP php_apcu_cache_ops Stats about APCu operations
# TYPE php_apcu_cache_ops counter
php_apcu_cache_ops{type="hits"} 6148
php_apcu_cache_ops{type="misses"} 6148
php_apcu_cache_ops{type="inserts"} 2899
php_apcu_cache_ops{type="entries"} 2584
php_apcu_cache_ops{type="expunges"} 17974
# HELP php_apcu_memory APCu memory status
# TYPE php_apcu_memory gauge
php_apcu_memory{type="free"} 1258712
php_apcu_memory{type="total"} 33554312

the operations rate per time unit is already graphed there. There is more information we might be interested in, but to extract that we just need to modify the php code that offers the prometheus metrics under modules/profile/files/mediawiki/php/admin in operations/puppet. Looking at graphs for apcu free memory now, it looks like we need a much larger apc cache now that we're actually sending traffic to php7, by the way.

A couple general graphs were added to

https://grafana.wikimedia.org/d/GuHySj3mz/php7-transition?refresh=30s&orgId=1&from=now-12h&to=now

to monitor APC status.

I would argue we might want to raise the memory dedicated to APCu a bit more and see if that improves the cache-hit ratio, which is around 85% on average right now.

@Joe The cache hit ratio and rate per second aren't metrics we previously monitored for HHVM. In retrospect, I suppose that would've been useful. I was hoping we'd have something comparable to HHVM APC Usage where we plot the total value size.

On the other hand, for HHVM the size was effectively unbounded (which made size a useful thing to check, e.g. to detect if MW forgets to set a TTL and builds up stale keys). For PHP this may be less useful, assuming it simply uses up all available space.

Anyway, I've added a panel to PHP7 transition that plots total - free, just so that we have it for now. It shows most servers using ~ 500 MB which makes sense given the limit of 512 MB we just set.

By comparison, the HHVM dash shows servers generally use a stable ~ 4 GB space. That's quite a big difference. It's possible most of that is keys that will never be used. On the other hand, I'm not aware of anything using indeterministic keys for APCu (which would be a bug). So, presumably reducing it to anything lower than 4 GB would increase cache misses and increase computations needed. That might be acceptable, but might also be something we could tune down later if memory is an issue. Can we afford another 4 GB on app servers during the transition?


Looking at ResourceLoader for potential impact during the current roll out. The main use of APCu there is for the minification cache. No definitive answers there, but a quick scan does show a potential correlation with PHP 7 deployments.

ResourceLoader / minify cache hit ratio:

  • minify-css shows a drop from a long-term 87-90% down to 92% on 2019-05-01. It climbed back on 2019-05-21.
  • minify-js shows a drop from a long-term 95-97% down to 92% on 2019-05-01. It climbed back on 2019-05-21.
  • p95 build time for 1 chunk increased from well under 50ms (usually ~3ms) to consistently between 70ms and 115 ms. The ~3ms spots started coming back at 2019-05-21 06:59, with the last 100ms bump going away at 2019-05-21 11:08.
Screenshot 2019-05-23 at 01.32.43.png (770×2 px, 257 KB)
Screenshot 2019-05-23 at 01.31.11.png (556×2 px, 177 KB)
export.png (540×2 px, 108 KB)
Server Admin Log:

2019-03-25 12:08 Move 0.1% of anonymous users to php7 T212828
2019-04-30 15:09: Send 1% of anonymous users to PHP7.2 - T219150
2019-05-02 08:55: Send 5% of anonymous users to PHP7.2 - T219150
2019-05-21 06:59: Turning off php7 sampling for investigation in T223952
2019-05-21 10:59 _joe_: rolling restart of php7.2-fpm across the fleet to pick up a config change
2019-05-21 11:27: Revert "Switch off php7 for investigation of production instabilities" (enable for 5%)
2019-05-21 15:37: Moving to 10% of users on php7 T219150

This could be a coincidence of course, but worth looking into.

@Krinkle very interesting data about the resourceloader performance, I think it's no coincidence. More on that below.

Coming to APCu: it's a very different beast than how APC works in HHVM. It is strongly bound to the top resource usage we set in apc.shm_size, but it also runs a GC thread every hour that removes all expired keys (this is also active in HHVM), then there is a special LRU-based GC that happens when the memory gets full.

I wanted intentionally to grow progressively across a week or so the size of the shm size, now that we have some meaningful amount of traffic going to php-fpm. My intention is to raise it in steps and see how that affects the cache hit ratio.

Coming to the graph with the total number of items in apc - we don't export that metric currently but we can work on the php code that exports the prometheus metrics, which is under operations/puppet:module/profile/files/mediawiki/php. I'll try to get to it but contributions welcome (and also, suggestions on what else to monitor).

Looking better at the last graph you pasted, I don't really explain myself why the p95 went down so much when we reintroduced php7 at 10% with respect to before we reenabled it. In theory HHVM should drive those metrics in that situation?

Change 512118 had a related patch set uploaded (by Giuseppe Lavagetto; owner: Giuseppe Lavagetto):
[operations/puppet@production] profile::mediawiki::php: make apc size configurable, bump for appservers

https://gerrit.wikimedia.org/r/512118

Change 512118 merged by Giuseppe Lavagetto:
[operations/puppet@production] profile::mediawiki::php: make apc size configurable, bump for appservers

https://gerrit.wikimedia.org/r/512118

Mentioned in SAL (#wikimedia-operations) [2019-05-23T10:15:32Z] <_joe_> restarted php7.2-fpm on mw1261 to assess the effect of a larger APCu shm size T223180

After doubling the cache size on one server, I noticed the cache-hit ratio plateaued between 80% and 90% after ~ 150 MB of space were occupied. I'll let it grow more, but if this is the case, I think we should aim at keeping the APC memory smaller and thus having smaller LRU flushes more frequently.

I'm rolling back the size of APCu to 512M after seeing how, on mw1261, the occupied memory grew significantly but the cache hit ratio didn't. IMHO it only risks to create a larger flush of LRU events and thus more disruption.

Mentioned in SAL (#wikimedia-operations) [2019-05-27T09:52:20Z] <_joe_> disabling puppet on mw1261, running some tests for T223180

So, I modified the APC dashboards in the php7-transition table to show the information you mentioned in the ticket, and I think it's fair. I realized, though, that we're comparing oranges and apples:

  • HHVM will never LRU an object from apc cache unless it has a ttl and it's expired
  • php-fpm will instead LRU the least used objects from memory as soon as its current limit is reached.

so comparing memory used and number of keys doesn't really work. I consider the fact that php-fpm has LRU eviction a feature, as it doesn't allow runaway apc usages.

The real metric we could compare is the cache hit ratio, but sadly HHVM doesn't expose that metric correctly (at least in our version which is quite outdated). So we don't have a good comparison to make.

The metrics are all there in the grafana dashboard:
https://grafana.wikimedia.org/d/GuHySj3mz/php7-transition

and I think they give a good idea of the overall status of APC caching on php7.

Since raising the occupied memory didn't help raising the cache hit ratio, I decided to keep it relatively small for now (512 MB), and maybe revisit later once I have a better model of how to split optimally the cache in smaller chunks so that the LRU eviction is less brutal (flushing 4 GB of ram is more expensive than doing the same with 512 mb instead).

I'll do some epxeriments in the coming weeks but I don't think there is more to do for this specific ticket. Please reopen it if you don't agree.