Page MenuHomePhabricator

Offer "Avg. Time Open (Days)" average value for Gerrit patchsets per author affiliation/organization
Closed, ResolvedPublic0 Estimated Story Points

Description

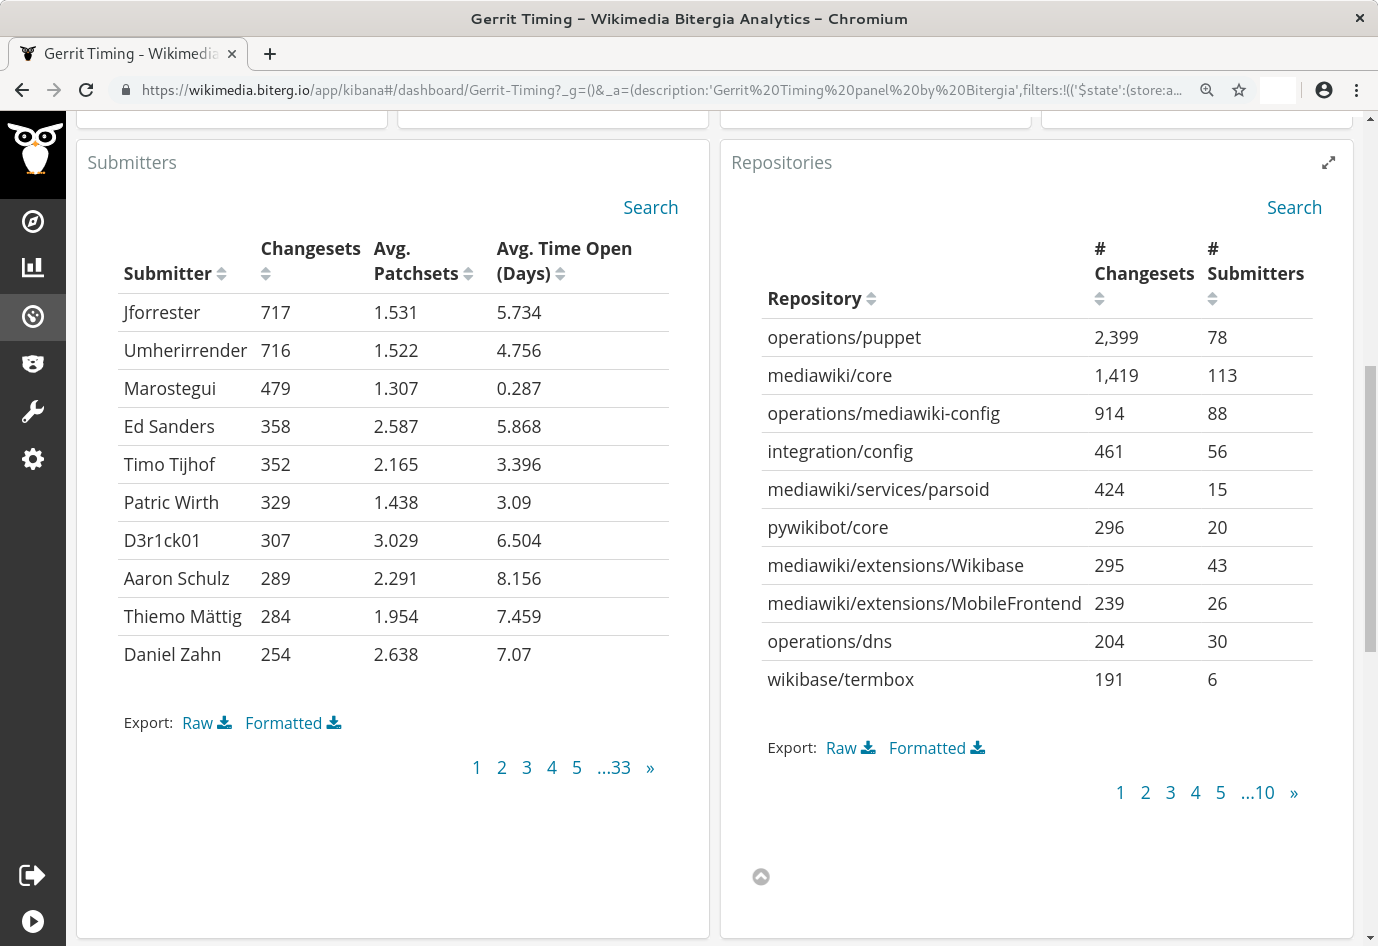
"Gerrit Timing" offers Avg. Time Open (Days) per submitter under Submitters:

avgopen.png (946×1 px, 160 KB)

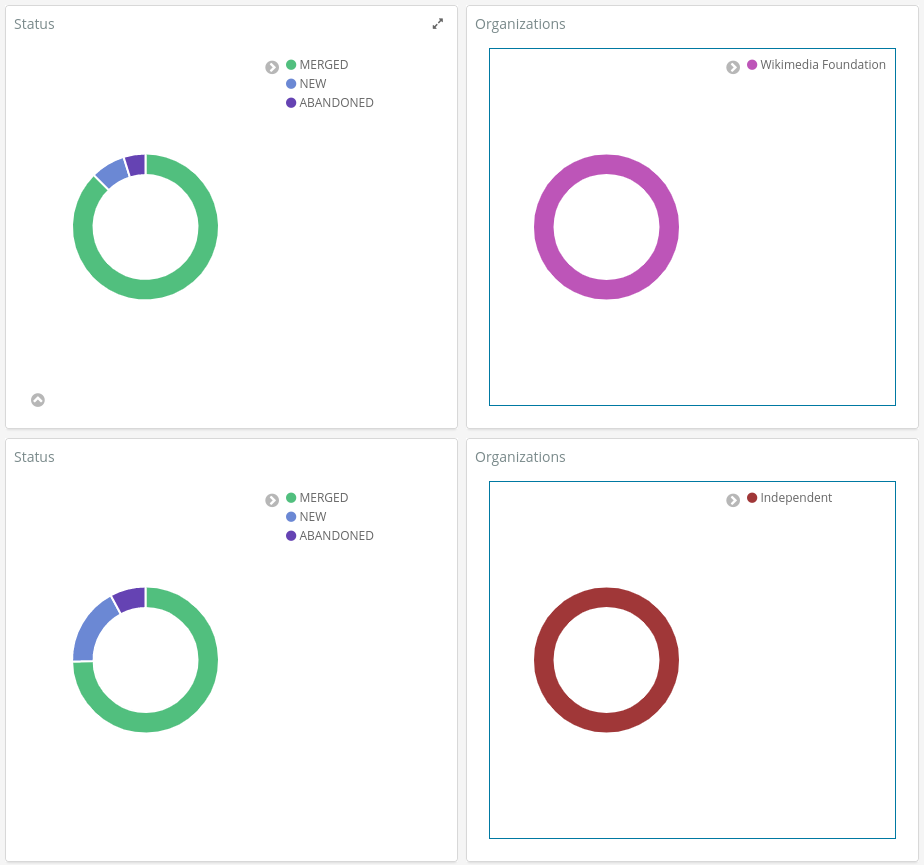
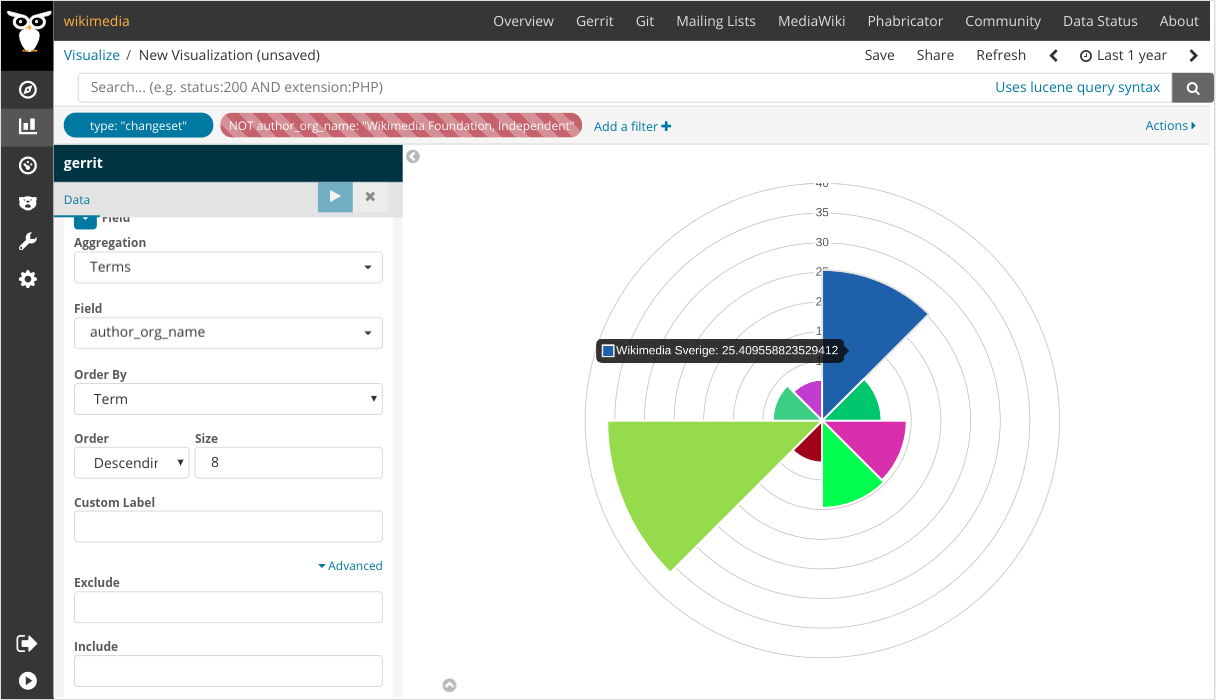
Would love to be able to filter on Organizations in general, e.g. if patchsets submitted by WMF folks get reviewed quicker than patchsets submitted by independent folks.

Internal non-public ticket: https://gitlab.com/Bitergia/c/Wikimedia/support/issues/63

Event Timeline

Aklapper triaged this task as Lowest priority.May 31 2019, 8:03 PM
Aklapper created this task.
Aklapper raised the priority of this task from Lowest to Medium.Aug 5 2019, 9:23 PM
Aklapper updated the task description. (Show Details)

For clarification, quoting from the internal ticket:

One changeset can have several patchsets (the last one overwrites the previous ones, afaik). The time we track is for changeset, based on its status. That means we track the time from the moment the changeset is created to the point in which it is resolved or abandoned.

Adding some more background, the more I think about this:
I do realize that a changeset marked as CR-1 (means: needs improvement) might simply remain open forever if nobody ever picks it up and fixes it. And that could make the stats more noisy and less useful.
I'm more interested in the time values per affiliation for changesets that are CR+0 (no review has happened yet) and CR+1 (someone has given positive feedback but someone else must approve the changeset via a CR+2 to get merged, which can sometimes be a bottleneck because the person giving a CR+2 is kind of responsible if the changeset gets merged and then breaks something).
So I'm back to wanting also to be able to filter this on code-review labels, as requested in T224755 and I hope that this is going to be combinable.

As this is a bit related: Thanks to the Status widget on the Gerrit-Timing dashboard, we already know that the review rate (percentage) of Gerrit changesets is different per affiliation, by filtering on the Organization. However, these stats only reflect the status of patches created in the last 90 days as of right now; they include no information about the timing. Comparison for the last 90 days of Wikimedia Foundation vs Individual:

Screenshot from 2019-08-09 18-49-18.png (865×924 px, 44 KB)

We're running into inconsistencies in Gerrit data in this task which distort the results:

Full list of the 43 problematic changesets can be seen at https://wikimedia.biterg.io/goto/87013a17063b675738cd841d8fb49c6b

Wondering if we could simply use the created_on value instead of the opened value to calculate the painless_delay value (and as there is a patchset_created_on), but need to check with Bitergia who know what they are doing, unlike me.

We also need to provide input on how to visualize this. Input very welcome.
Currently the visualization proposal can be seen in https://wikimedia.biterg.io/goto/d813c19b886e7015c587014af443b2b0 , adding a screenshot here:

Screenshot from 2019-09-06 13-10-06.png (700×1 px, 123 KB)

Note that this is still a draft and work in progress.

Also wondering about medium vs average here.

Copying internal comment here:

The painless_delay is calculated only for changeset items and we use last_update field as changeset closing date (of course for merged or abandoned changesets, for the open ones we calculate the time from creation to the present).

https://wikimedia.biterg.io/goto/c9663782f8c9d893f94434c0135ffd13 is an example for the operations/puppet repository.
The search query could also be filtered for CR status, for example (repository:"operations/puppet") AND status_value:"-1", see T224755: Allow to filter by Gerrit label 'code review' (on the latest patchset) in the frontend for that.

TODO: Still need to find out how to save this visualization and add it to a dashboard (probably Gerrit Timing?) and not get that overwritten when Bitergia deploys a new software version with its dashboard item defaults.

Aklapper renamed this task from Offer "Avg. Time Open (Days)" average value for Gerrit patchsets per affiliation/organization to Offer "Avg. Time Open (Days)" average value for Gerrit patchsets per author affiliation/organization.Dec 14 2019, 9:39 PM

Hmm, given its topic it would probably fit best on https://wikimedia.biterg.io/app/kibana#/dashboard/Gerrit-Timing but don't want to replace that with C_Gerrit-Timing, so it would be another dashboard. We'd need to ask Bitergia to get the link into the top bar.

Documented in https://www.mediawiki.org/w/index.php?title=Community_metrics&type=revision&diff=3568518&oldid=3568108

Note that by default, this entirely ignores any Gerrit change set status (whether NEW, MERGED, ABANDONED) and any CR label status, but this covers any and every Gerrit patch within the given time frame in the upper right corner, also closed ones.

It is possible to pass values like status:"NEW" AND status_value:"1" AND/OR !_exists_:status_value (for CR0) in order to filter accordingly.

Custom dashboard (scroll down!) available now at https://wikimedia.biterg.io/app/kibana#/dashboard/f47e4d80-5401-11ea-8a35-09ce380aa6b8

Wondering from where to link that. Could ask Bitergia to change the top bar to replace current default "Gerrit Timing"?

Discussed earlier today.
Went for horizontal bar visualization instead of pie chart, plus not exposing the dashboard in the top bar navigation (maintenance costs; requires changes by Bitergia).
Instead linking it from https://www.mediawiki.org/w/index.php?title=Community_metrics&type=revision&diff=3901956&oldid=3824807 . Good enough for now.

Steps, so I remember what I did here:

  1. (Delete previous pie chart visualizations)
  1. Visualize > New > Horizontal Bars > Data source = Gerrit
  2. Metrics: Aggregation = Average; Field = painless_delay; Custom label = Days
  3. Buckets = x-axis; Aggregation = Terms; Field = author_org_name; Order By = metric: Average painless delay; Custom label = Affiliation
  4. Add a filter: type | is | changeset
  5. Add a filter: status | is | NEW
  6. Add a filter: status value | does not exist
  7. Save as C_Gerrit_Avg_Open_Unreviewed_by_Author_Affiliation
  1. Visualize > New > Horizontal Bars > Data source = Gerrit
  2. Metrics: Aggregation = Average; Field = painless_delay; Custom label = Days
  3. Buckets = x-axis; Aggregation = Terms; Field = author_org_name; Order By = metric: Average painless delay; Custom label = Affiliation
  4. Add a filter: type | is | changeset
  5. Add a filter: status | is | NEW
  6. Add a filter: status_value | is | 1
  7. Save as C_Gerrit_Avg_Open_+1_by_Author_Affiliation
  1. Edit dashboard to add these two visualizations.