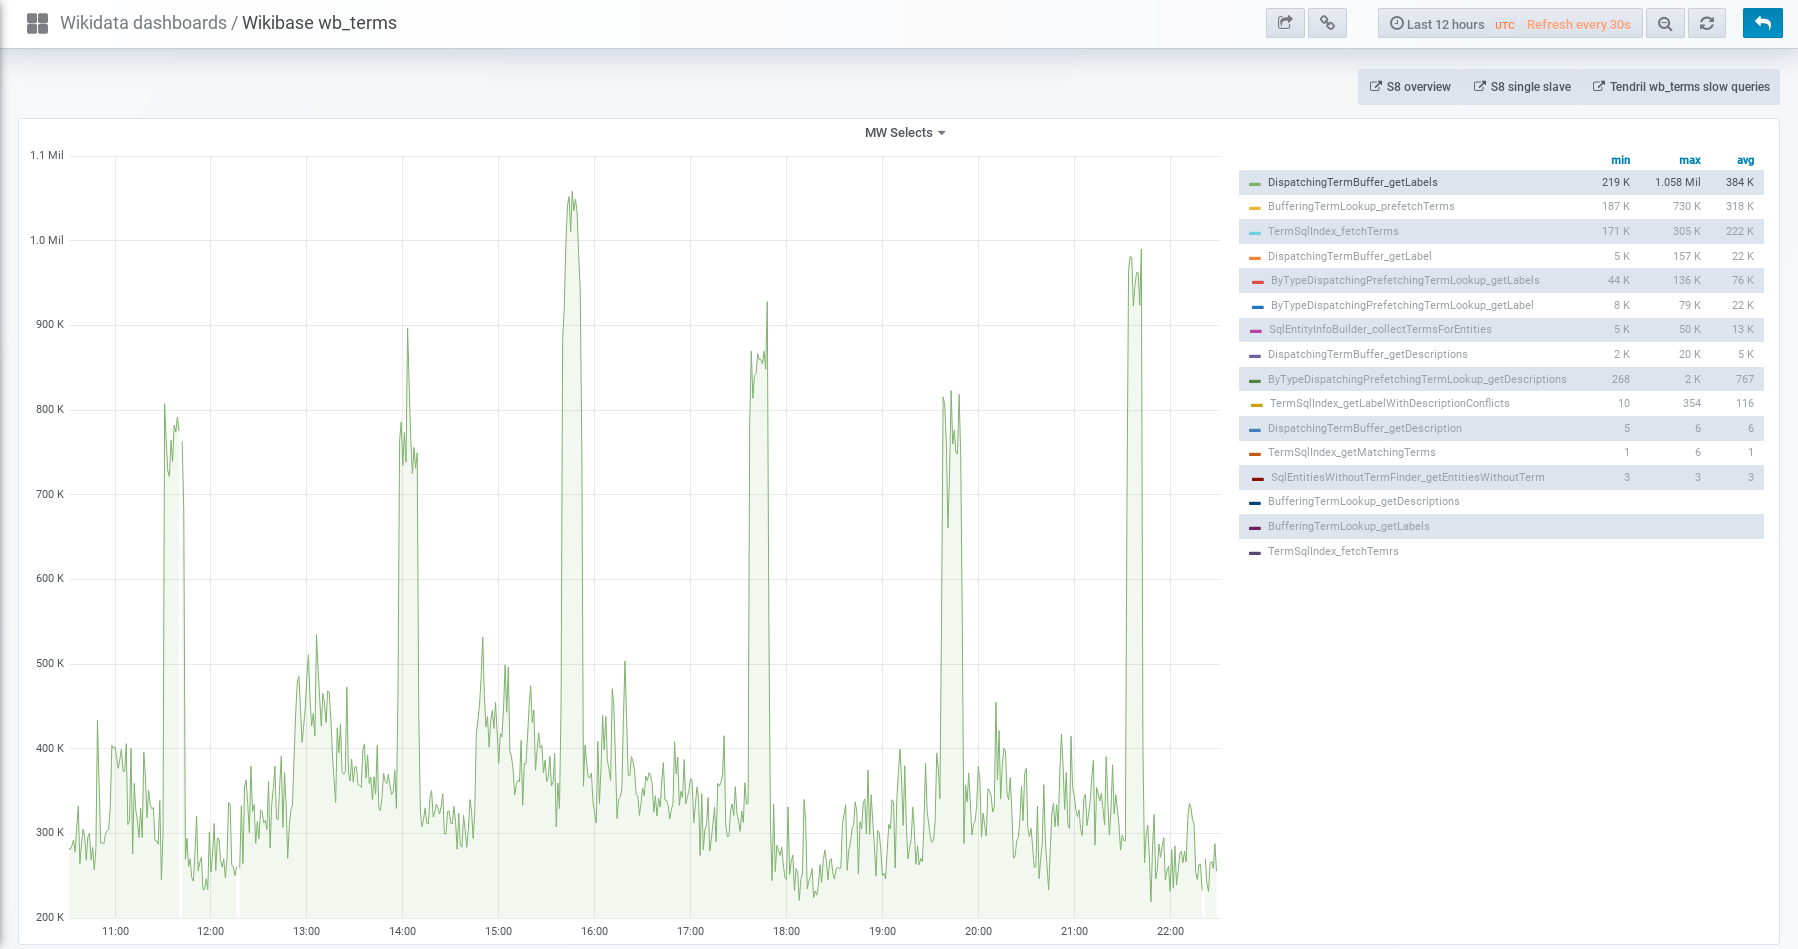
Page MenuHomePhabricator

Spikes in DB traffic and rows/s reads when reading from new terms store
Closed, ResolvedPublic

Assigned To
Authored By
alaa_wmde
Jul 31 2019, 1:07 PM
Referenced Files
F31464880: image.png
Dec 10 2019, 10:35 AM
F31464878: image.png
Dec 10 2019, 10:35 AM
F31458692: image.png
Dec 5 2019, 7:18 PM
F31456793: image.png
Dec 5 2019, 7:18 PM
F31456795: image.png
Dec 5 2019, 7:18 PM
F31456791: image.png
Dec 5 2019, 7:18 PM
F31075576: image.png
Nov 14 2019, 5:00 PM
F31010750: image.png
Nov 5 2019, 1:30 PM
Tokens
"Love" token, awarded by Marostegui."Baby Tequila" token, awarded by Addshore.

Description

The Incident
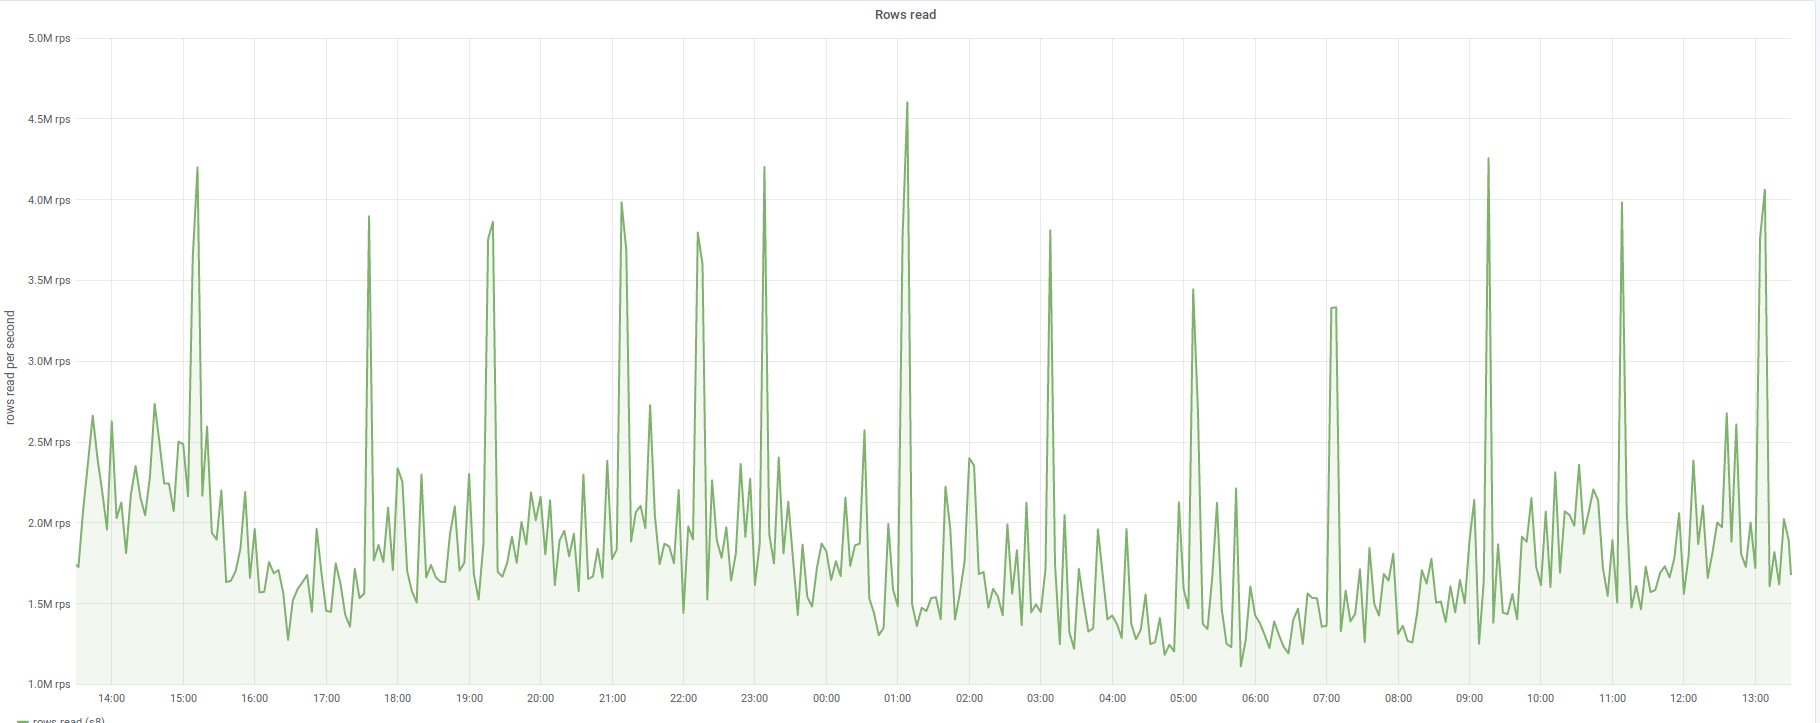
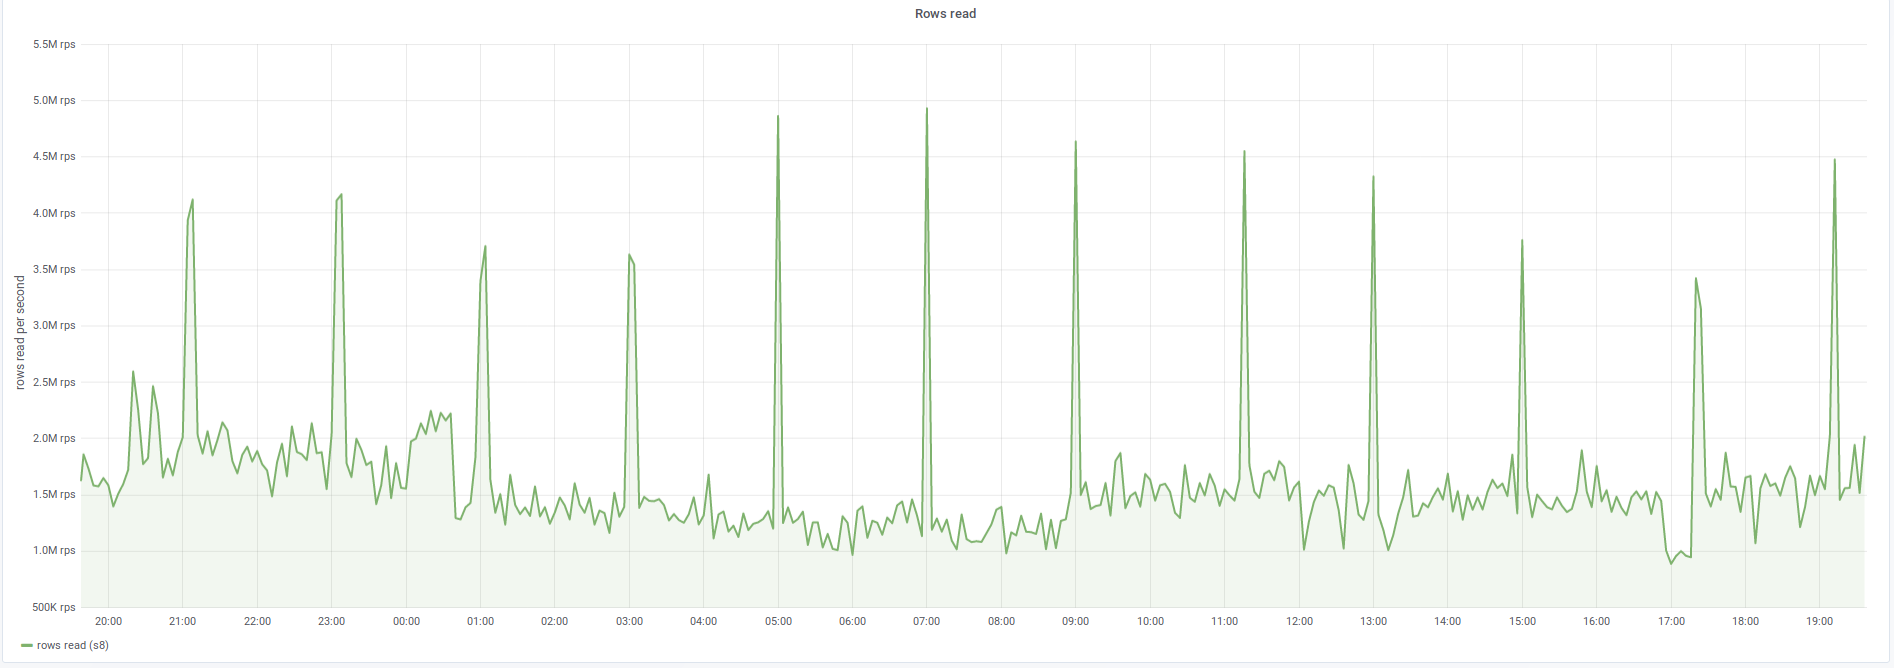
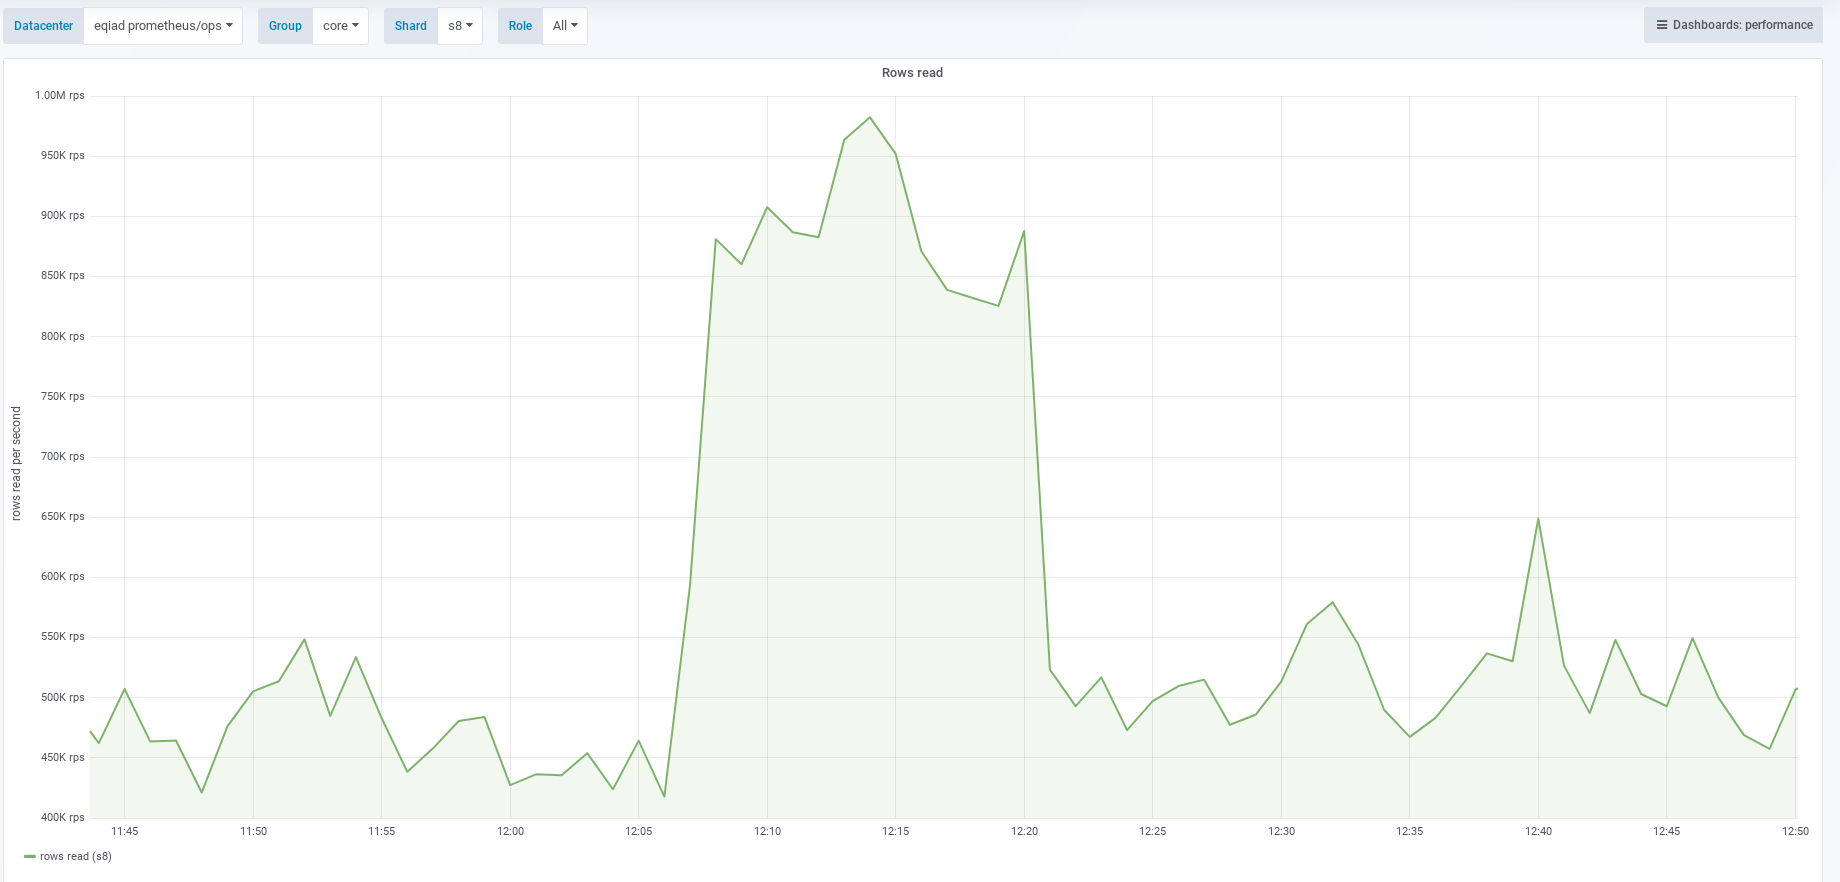
When we tried to enable reading property terms from new store T225053: Switch `tmpPropertyTermsMigrationStage` to MIGRATION_WRITE_NEW on production, the reading from the database increased dramatically, as seen here https://grafana.wikimedia.org/dashboard/snapshot/2kuWt7nhGDUdV3rAzYMPFYHMJ3poKf5C?panelId=8&fullscreen&orgId=1

image.png (882×1 px, 83 KB)

The root cause
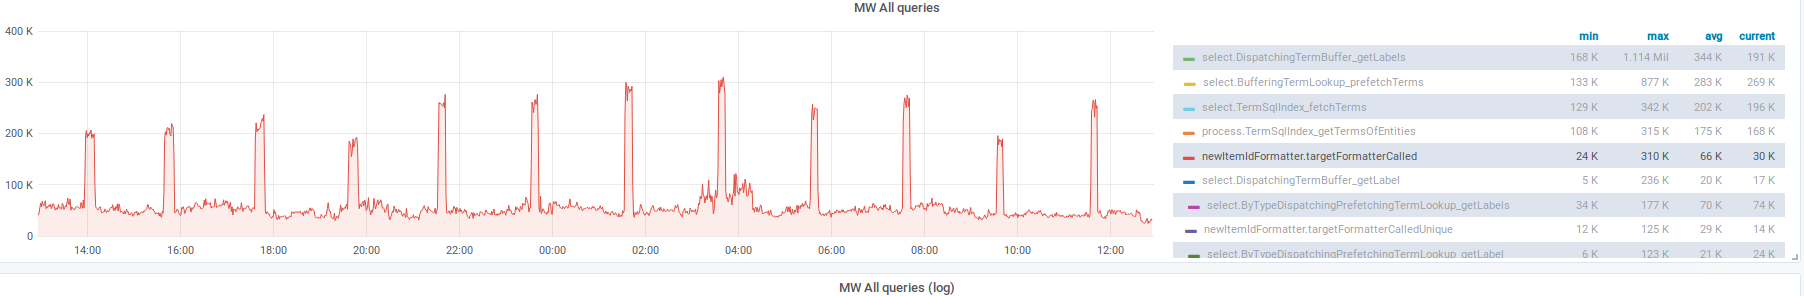
Our new PrefetchingPropertyTermLookup and PrefetchingItemTermLookup that are responsible for looking up Item/Property terms (main use case is rendering property/item labels in repo) do not use caching as their equivalent BufferingTermLookup for old store did.

Suggested solution
We have to wrap a cache around PrefetchingPropertyTermLookup and PrefetchingItemTermLookup.

We will use the same that was used for old term index for now MapCacheLRU with same buffer size and test to see if that reduces the increase in rows read per second.

Event Timeline

There are a very large number of changes, so older changes are hidden. Show Older Changes

As it is locking migration of terms in production

Before I change the description of this task. Here are my findings. Turns out that MapCacheLRU used inside BufferingTermIndex is only per-object cache, not really per-process. Meaning that two instances of BufferingTermIndex will not actually share the cache (since they create their own instances of MapCachLRU internally).

To test, you can try the running the following inside MW's eval.php:

$cache1 = new \MapCacheLRU( 5 );
$cache2 = new \MapCacheLRU( 5 );
$cache1->set( 'foo', 'is in cache 1' );
$cache2->set( 'bar', 'is in cache 2' );
$cache3 = new \MapCacheLRU( 5 );

var_dump( $cache1->toArray() );

/** output
/var/www/mediawiki/maintenance/eval.php(78) : eval()'d code:1:
array(1) {
  'foo' =>
  string(13) "is in cache 1"
}
*/

var_dump( $cache2->toArray() );
/** output
/var/www/mediawiki/maintenance/eval.php(78) : eval()'d code:1:
array(1) {
  'bar' =>
  string(13) "is in cache 2"
}
*/

var_dump( $cache3->toArray() );
/** output
/var/www/mediawiki/maintenance/eval.php(78) : eval()'d code:1:
array(0) {
}
*/

Since PrefetchingPropertyTermLookup and PrefetchingItemTermLookup already implement such per-object in-memory caching through simple array, then the increase in retrieved queries per second is probably not due to any caching missing in these two classes.

Looking at Grafana board again, it seems that we had those spikes today in our databases many times and not just when we tried enable reading from new store. https://grafana.wikimedia.org/dashboard/snapshot/G4s06avbu28Lp0eYIsItGotaiCWr49oy

Maybe there was other effects that resulted in a compound increase we thought was only caused by reading from new store?

I'm thinking now that we should just try it again tomorrow for a little longer and see what happens, and maybe collect some logs of queries being executed most often if that's possible? @Ladsgroup

I'm thinking now that we should just try it again tomorrow for a little longer and see what happens, and maybe collect some logs of queries being executed most often if that's possible? @Ladsgroup

Thank you for doing this <3

After second deployment, we can see spikes on database (rows per second, but also db traffic) every two hours.
https://grafana.wikimedia.org/dashboard/snapshot/qsMbl3Y5NG68EyxYmoAqXoa8FuqoxvQZ

Looking at other grafana graphs, we saw this

image.png (949×1 px, 176 KB)

https://grafana.wikimedia.org/dashboard/snapshot/UZnHzz2Qan7rnDiHZ8OTBQfDJvXk4j9Y

This shows that DispatchingTermBuffer is the place to look at, as most these selects are coming from calls to the base class EntityTermLookupBase::getLabels.

In DispatchingTermBuffer we use the new store for properties, which is implemented in PrefetchingPropertyTermLookup.

The funny thing is that EntityTermLookupBase::getLabels should not result in any queries (which I tested locally for sanity again). The prior call to EntityTermLookupBase::prefetchTerms should. Not sure if that's logging issue here.

The SqlEntityInfoBuilder graph points at queries that must be going to old store wb_terms (for items must be) in calls to SqlEntityInfoBuilder::collectTermsForEntities.

image.png (952×1 px, 279 KB)

https://grafana.wikimedia.org/dashboard/snapshot/zNYsVXAqiVmBMdJEgl4nPgtzMACdX3RL

As I will not be able to work on it before next Monday. Feel free to pick up and continue.

@Ladsgroup any new findings you wanna add on this here?

alaa_wmde renamed this task from Wrap new terms store with caching to Spikes in DB traffic and rows/s reads when reading from new terms store.Aug 2 2019, 12:51 PM

@Ladsgroup any new findings you wanna add on this here?

Yeah, the only thing I found is that this spike is on newItemIdFormatter which doesn't make any sense at all whatsoever. We are changing properties and not items.

image.png (296×1 px, 87 KB)

The newPropertyIdFormatter is pretty healthy:
image.png (284×1 px, 75 KB)

It can be that this spike kicks out properties out of cache and they need to rebuild all the time.

Thanks @Ladsgroup for all the investigation so far. Even after looking in hadoop cluster, we cannot identify any specific requests that might be responsible for those spikes. In order to move forward, we will add another layer of caching for property terms for now. If the issue persists or appears again for item terms, then we can invest more time in figuring out the root cause of these spikes.

I looked into this a bit and found https://grafana.wikimedia.org/dashboard/snapshot/08uo4Z113gB4aJJet3qVUq1Ock5sfkv6?panelId=1&fullscreen&orgId=1 (filter for SqlEntityInfoBuilder_collectTermsForEntities) very interesting.

image.png (972×1 px, 172 KB)

Given that SqlEntityInfoBuilder::collectTermsForEntities only user is FullEntityParserOutputGenerator::getEntityInfo, we might want to look into which pages get re-parsed around that time. Another possibility might be a bot running at that interval re-parsing (or more probably, editing) pages.

Tarrow changed the task status from Open to Stalled.Aug 30 2019, 10:37 AM
Tarrow removed hoo as the assignee of this task.
Tarrow added subscribers: hoo, Tarrow.

Moved to stalled since not touched for more than two weeks.

I looked into this a bit and found https://grafana.wikimedia.org/dashboard/snapshot/08uo4Z113gB4aJJet3qVUq1Ock5sfkv6?panelId=1&fullscreen&orgId=1 (filter for SqlEntityInfoBuilder_collectTermsForEntities) very interesting.

image.png (972×1 px, 172 KB)

Given that SqlEntityInfoBuilder::collectTermsForEntities only user is FullEntityParserOutputGenerator::getEntityInfo, we might want to look into which pages get re-parsed around that time. Another possibility might be a bot running at that interval re-parsing (or more probably, editing) pages.

This is a very valuable insight. We need to consider this for T236681: SqlEntityInfoBuilder reads and writes from the old term store regardless of the config

Lydia_Pintscher changed the task status from Stalled to Open.Nov 12 2019, 1:52 PM

Mentioned in SAL (#wikimedia-operations) [2019-11-14T16:04:20Z] <ladsgroup@deploy1001> Synchronized php-1.35.0-wmf.5/extensions/Wikibase: [[gerrit:550828|Put a layer of APC cache on top of reading wb_terms in SqlEntityInfoBuilder]] (T231011 T229407 T236681), Try II (duration: 00m 56s)

Given that SqlEntityInfoBuilder::collectTermsForEntities only user is FullEntityParserOutputGenerator::getEntityInfo, we might want to look into which pages get re-parsed around that time. Another possibility might be a bot running at that interval re-parsing (or more probably, editing) pages.

There's a slight chance that it's ListeriaBot updating queries.

After eight hours of looking at logs and hadoop queries and MySQL queries and graphs the only thing I can say is that putting stats or logs on FullEntityParserOutputGenerator is the best way to move forward here + there's nothing in edits in wikidata that can correlate to this problem (so the only possible idea it purges done either by jobs or POST purges by bots). There's nothing to look at in client side as the client side doesn't get called (actually I discovered that some parts of client are actually dead code that never gets called).

Change 554496 had a related patch set uploaded (by Ladsgroup; owner: Ladsgroup):
[operations/puppet@production] mediawiki: Stop rebuildItermTerms temporary

https://gerrit.wikimedia.org/r/554496

I have been working on this since yesterday. I have a hunch what's going on here. Will write more once I'm certain.

Change 554496 merged by Marostegui:
[operations/puppet@production] mediawiki: Stop rebuildItermTerms temporary

https://gerrit.wikimedia.org/r/554496

Change 554511 had a related patch set uploaded (by Ladsgroup; owner: Ladsgroup):
[mediawiki/extensions/Wikibase@master] Put random debug info for T229407

https://gerrit.wikimedia.org/r/554511

Change 554513 had a related patch set uploaded (by Ladsgroup; owner: Ladsgroup):
[mediawiki/extensions/Wikibase@wmf/1.35.0-wmf.5] Put random debug info for T229407

https://gerrit.wikimedia.org/r/554513

Mentioned in SAL (#wikimedia-operations) [2019-12-04T15:07:32Z] <ladsgroup@deploy1001> Synchronized php-1.35.0-wmf.5/extensions/Wikibase/repo/includes/ParserOutput/FullEntityParserOutputGenerator.php: T229407 (duration: 01m 00s)

Mentioned in SAL (#wikimedia-operations) [2019-12-04T15:09:47Z] <ladsgroup@deploy1001> Synchronized php-1.35.0-wmf.5/extensions/Wikibase/repo/includes/ParserOutput/FullEntityParserOutputGenerator.php: T229407, part II (duration: 01m 02s)

Mentioned in SAL (#wikimedia-operations) [2019-12-04T17:50:00Z] <ladsgroup@deploy1001> Synchronized php-1.35.0-wmf.5/extensions/Wikibase/repo/includes/ParserOutput/FullEntityParserOutputGenerator.php: T229407, part III (duration: 01m 01s)

Change 554511 abandoned by Ladsgroup:
Put random debug info for T229407

Reason:
Done now

https://gerrit.wikimedia.org/r/554511

Change 554513 abandoned by Ladsgroup:
Put random debug info for T229407

Reason:
Done now

https://gerrit.wikimedia.org/r/554513

Binlogs that @Marostegui gave me has things like this:

REPLACE /* SqlBagOStuff::updateTableKeys RunSingleJob.php@mw1335 */ INTO `pc156` (keyname,value,exptime) VALUES ('wikidatawiki:pcache:idoptions:55899217','<gibberish>...

In timespan of six minutes, there's 17k of praser cache insertion on wikidata from RunSingleJob.php in one of the three PC nodes. This is, to put it mildly, insane. One of the items that got a new PC is Q55864736 that hasn't visited in the last month, has no templates or entity usage. I think it's one of wikibase jobs. I dig deeper now.

So After lots of debugging it turned out that it's CirrusSearchChecker job that is causing this. The time matches perfectly:

image.png (680×1 px, 119 KB)

image.png (668×1 px, 177 KB)

image.png (668×1 px, 117 KB)

image.png (710×1 px, 281 KB)

It's not the search index rebuilt, it's actually the index being checked and sanitized, it doesn't need HTML of the page but the code that is generalized for mediawiki tries to render it for wikidata which it should. There { T239931} to tackle it.

There's two options:

  • Making it slower
  • Making it not depend on the ParserOutput HTML.

the former is easy, the latter requires some work but maybe no more than a couple of days.

@Ladsgroup I think we can move this from peer review now, great investigative work!
The question is, should it live in the waiting col on the iteration or on the campsite board? ;)

Mentioned in SAL (#wikimedia-operations) [2019-12-09T14:26:23Z] <ladsgroup@deploy1001> Synchronized wmf-config/InitialiseSettings.php: [[gerrit:555941|Disable sanity check cirrus jobs for Wikidata (T239931 T229407)]] (duration: 00m 57s)

Mentioned in SAL (#wikimedia-operations) [2019-12-09T14:34:28Z] <ladsgroup@deploy1001> Synchronized php-1.35.0-wmf.5/extensions/Wikibase/repo/includes/ParserOutput/FullEntityParserOutputGenerator.php: T229407, clean up debugging info (duration: 00m 59s)

@Ladsgroup I think we can move this from peer review now, great investigative work!
The question is, should it live in the waiting col on the iteration or on the campsite board? ;)

I just disabled the job for now, until the migration is done and then we enable it again or fix it properly.

Amazing investigation @Ladsgroup!
If I had to choose from the two options you provided to solve this, I would go for the second: "Making it not depend on the ParserOutput HTML", as it looks like a better long term solution.

Thanks a lot for this work!

It will be interesting to see if this changes the size of the parsercache, and also hit / miss rate at all too.

Regarding size of ParserCache. I queried pc255 on the first PC node. it had 975,982 rows yesterday and today it had 975,580. Assuming perfect randomness in sharding, there should be a total of 308,736 rows drop (154,368 PC entries) since yesterday. Even though I don't see the drop in the graphs, maybe it needs more time.

I got my answer, PC gets purged at 1:00 UTC every day only (using mediawiki::maintenance::parsercachepurging job) meaning I have to wait a full day to get the value.

Going to go ahead and close this now.