https://grafana.wikimedia.org/d/000000205/mobile-2g?orgId=1
Is this related to deploy or infrastructure?
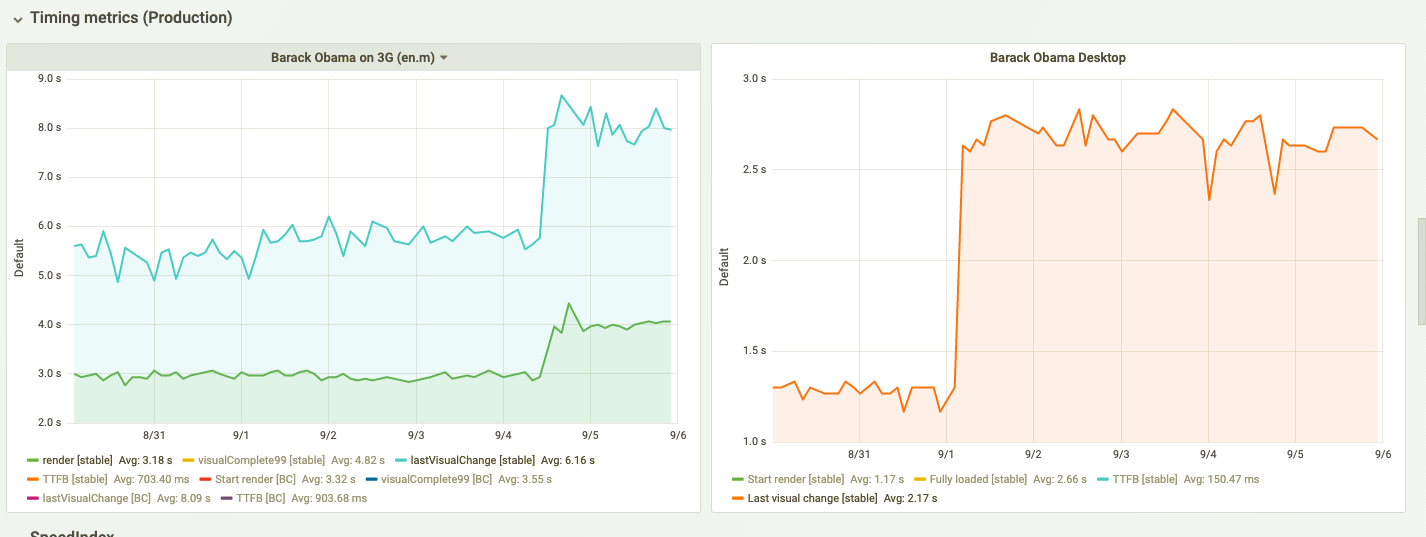
The spike looks quite significant.
Am not seeing an increase in JS / CSS bytes
| Jdlrobson | |
| Sep 6 2019, 12:02 AM |
| F30289691: Screen Shot 2019-09-10 at 12.36.21 PM.png | |
| Sep 10 2019, 10:39 AM |
| F30282305: Capture d'écran 2019-09-09 14.13.14.png | |
| Sep 9 2019, 12:22 PM |
| F30282310: Capture d'écran 2019-09-09 14.16.07.png | |
| Sep 9 2019, 12:22 PM |
| F30282244: Capture d'écran 2019-09-09 13.31.19.png | |
| Sep 9 2019, 12:22 PM |
| F30282247: Capture d'écran 2019-09-09 13.31.25.png | |
| Sep 9 2019, 12:22 PM |
| F30282313: Capture d'écran 2019-09-09 14.16.39.png | |
| Sep 9 2019, 12:22 PM |
| F30282302: Capture d'écran 2019-09-09 14.12.25.png | |
| Sep 9 2019, 12:22 PM |
| F30282235: Capture d'écran 2019-09-09 13.26.53.png | |
| Sep 9 2019, 12:22 PM |
https://grafana.wikimedia.org/d/000000205/mobile-2g?orgId=1
Is this related to deploy or infrastructure?
The spike looks quite significant.
Am not seeing an increase in JS / CSS bytes
Hi @Jdlrobson thank you for creating the issue, I've missed it. It looks like there could be some problem with the WebPageTest instance. I could see that the issue is for all URLs we test for emulated mobile and there's an increase in TTFB. I wonder if something changed on that instance, I'll look into it.
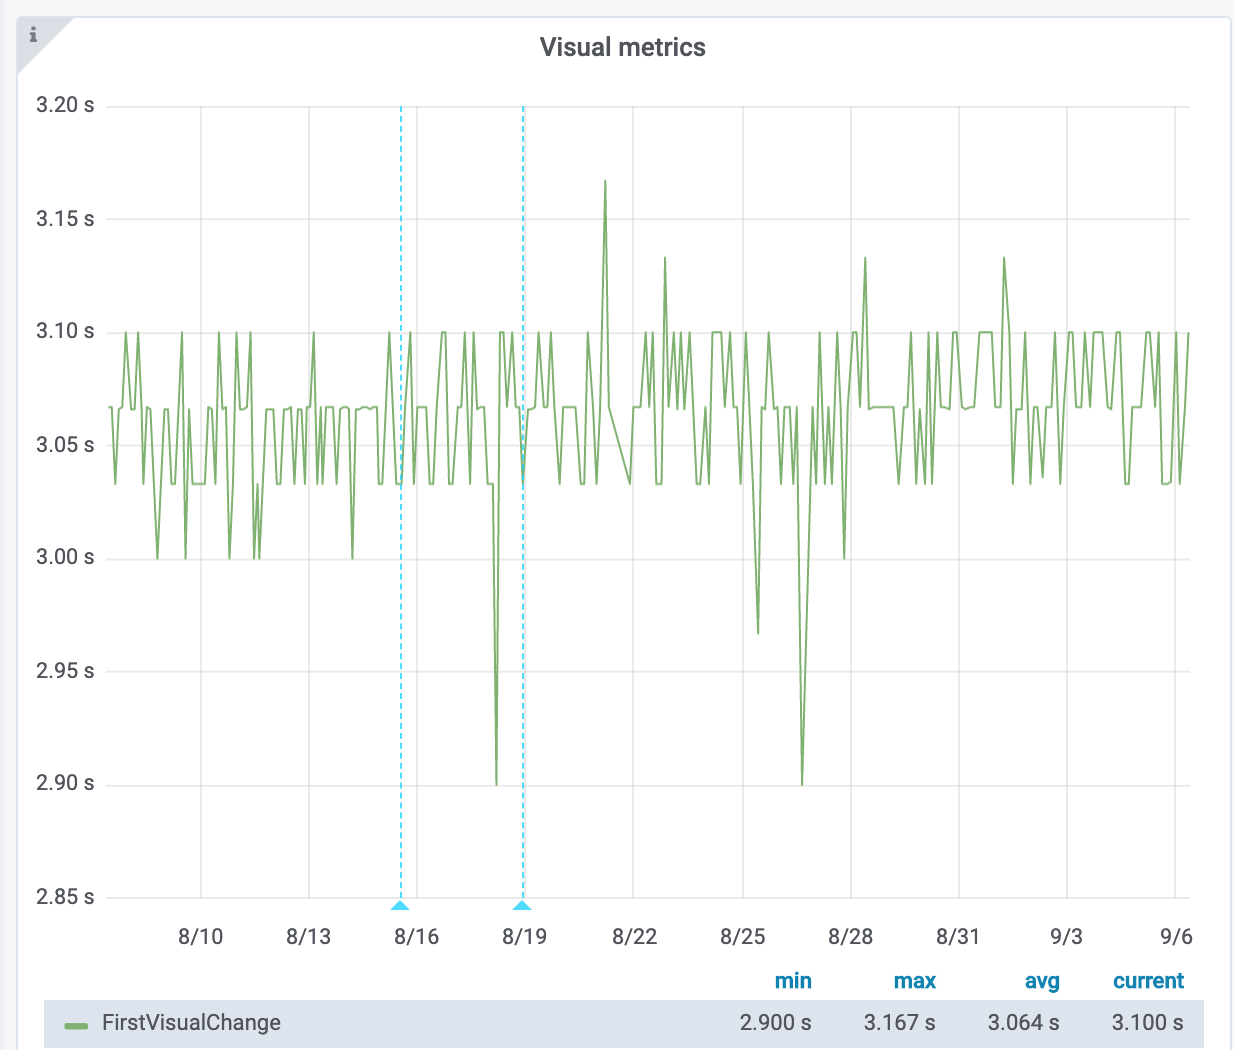
I've checked where we use WebPageReplay to replay the traffic (=no variation in TTFB, only measuring frontend) and there it all looks good:
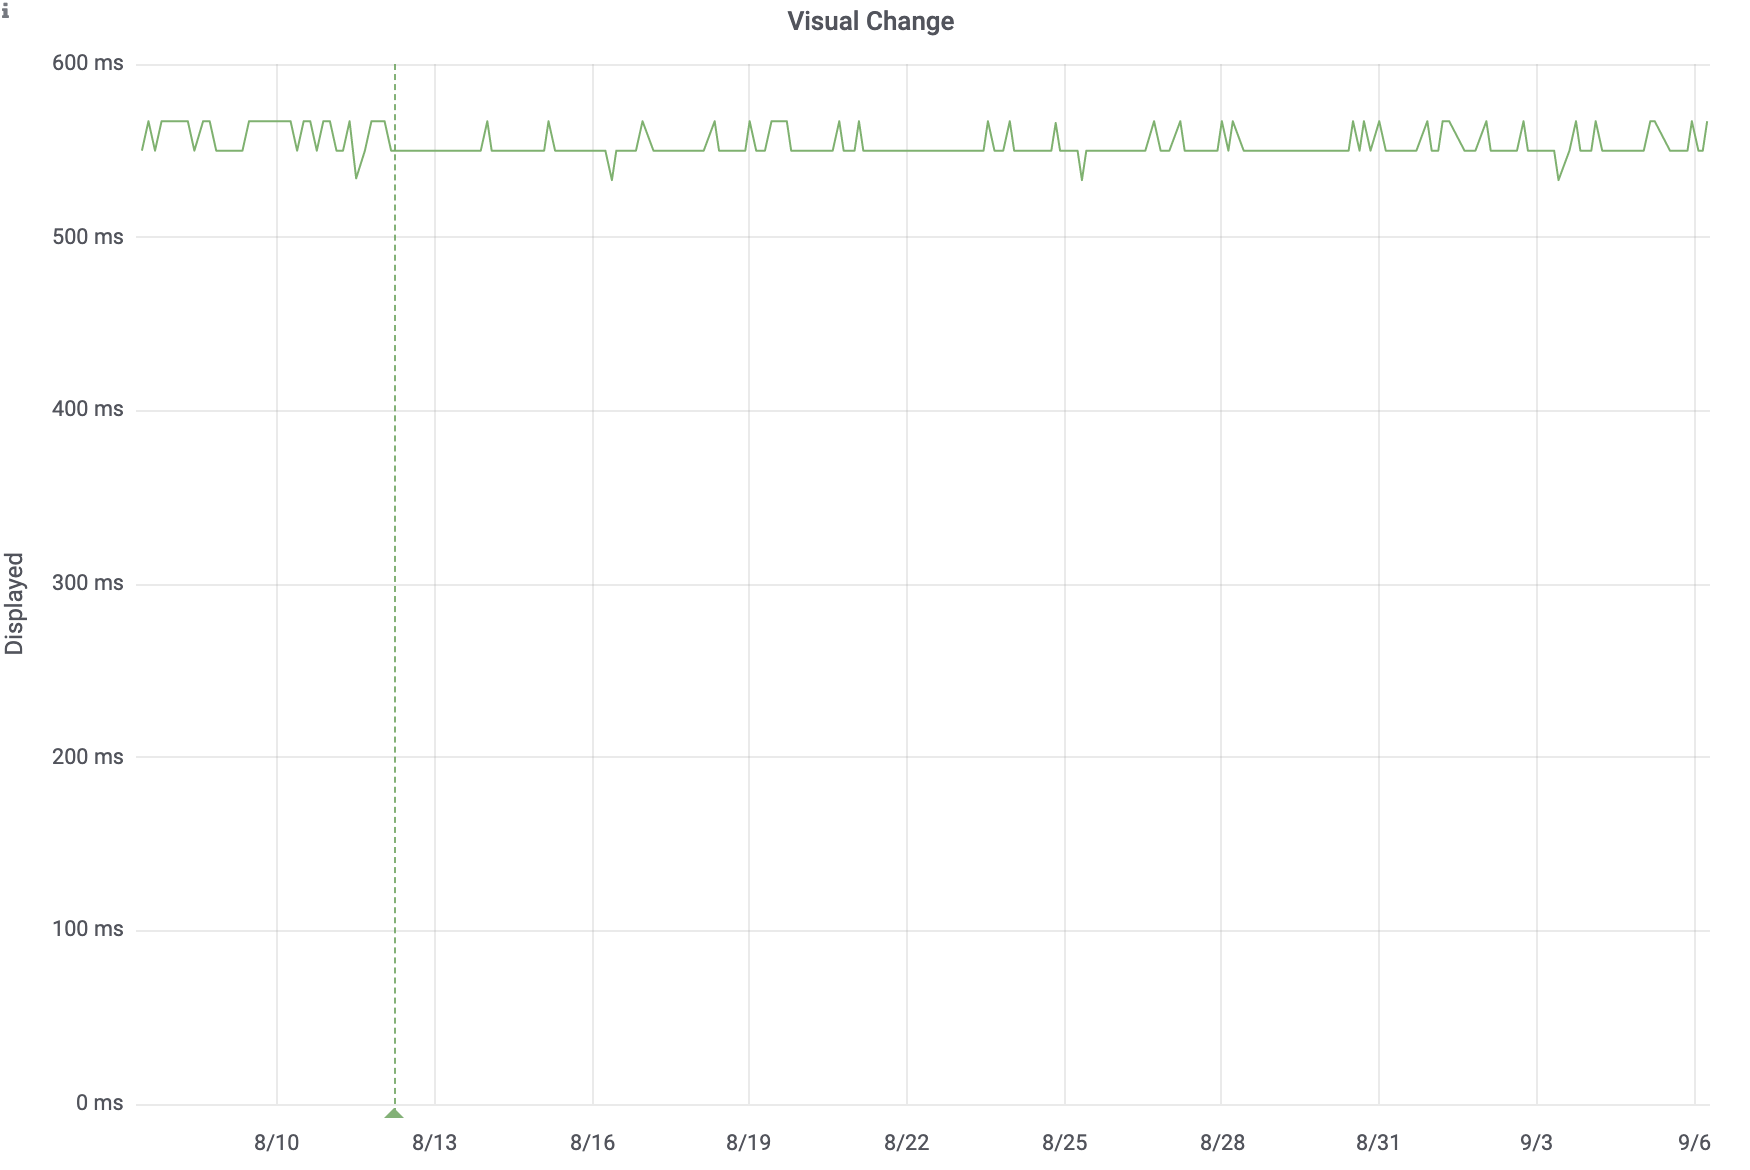
Also checked my own instance and there's nothing there either than the usual noise:
I'll check our WPT agent and see if I can see what's wrong.
FYI the last visual change is the banner, you can see that if you check the screenshots of the runs. It will change SpeedIndex and LastVisualChange.
Start render should never change though, so there something is broken.
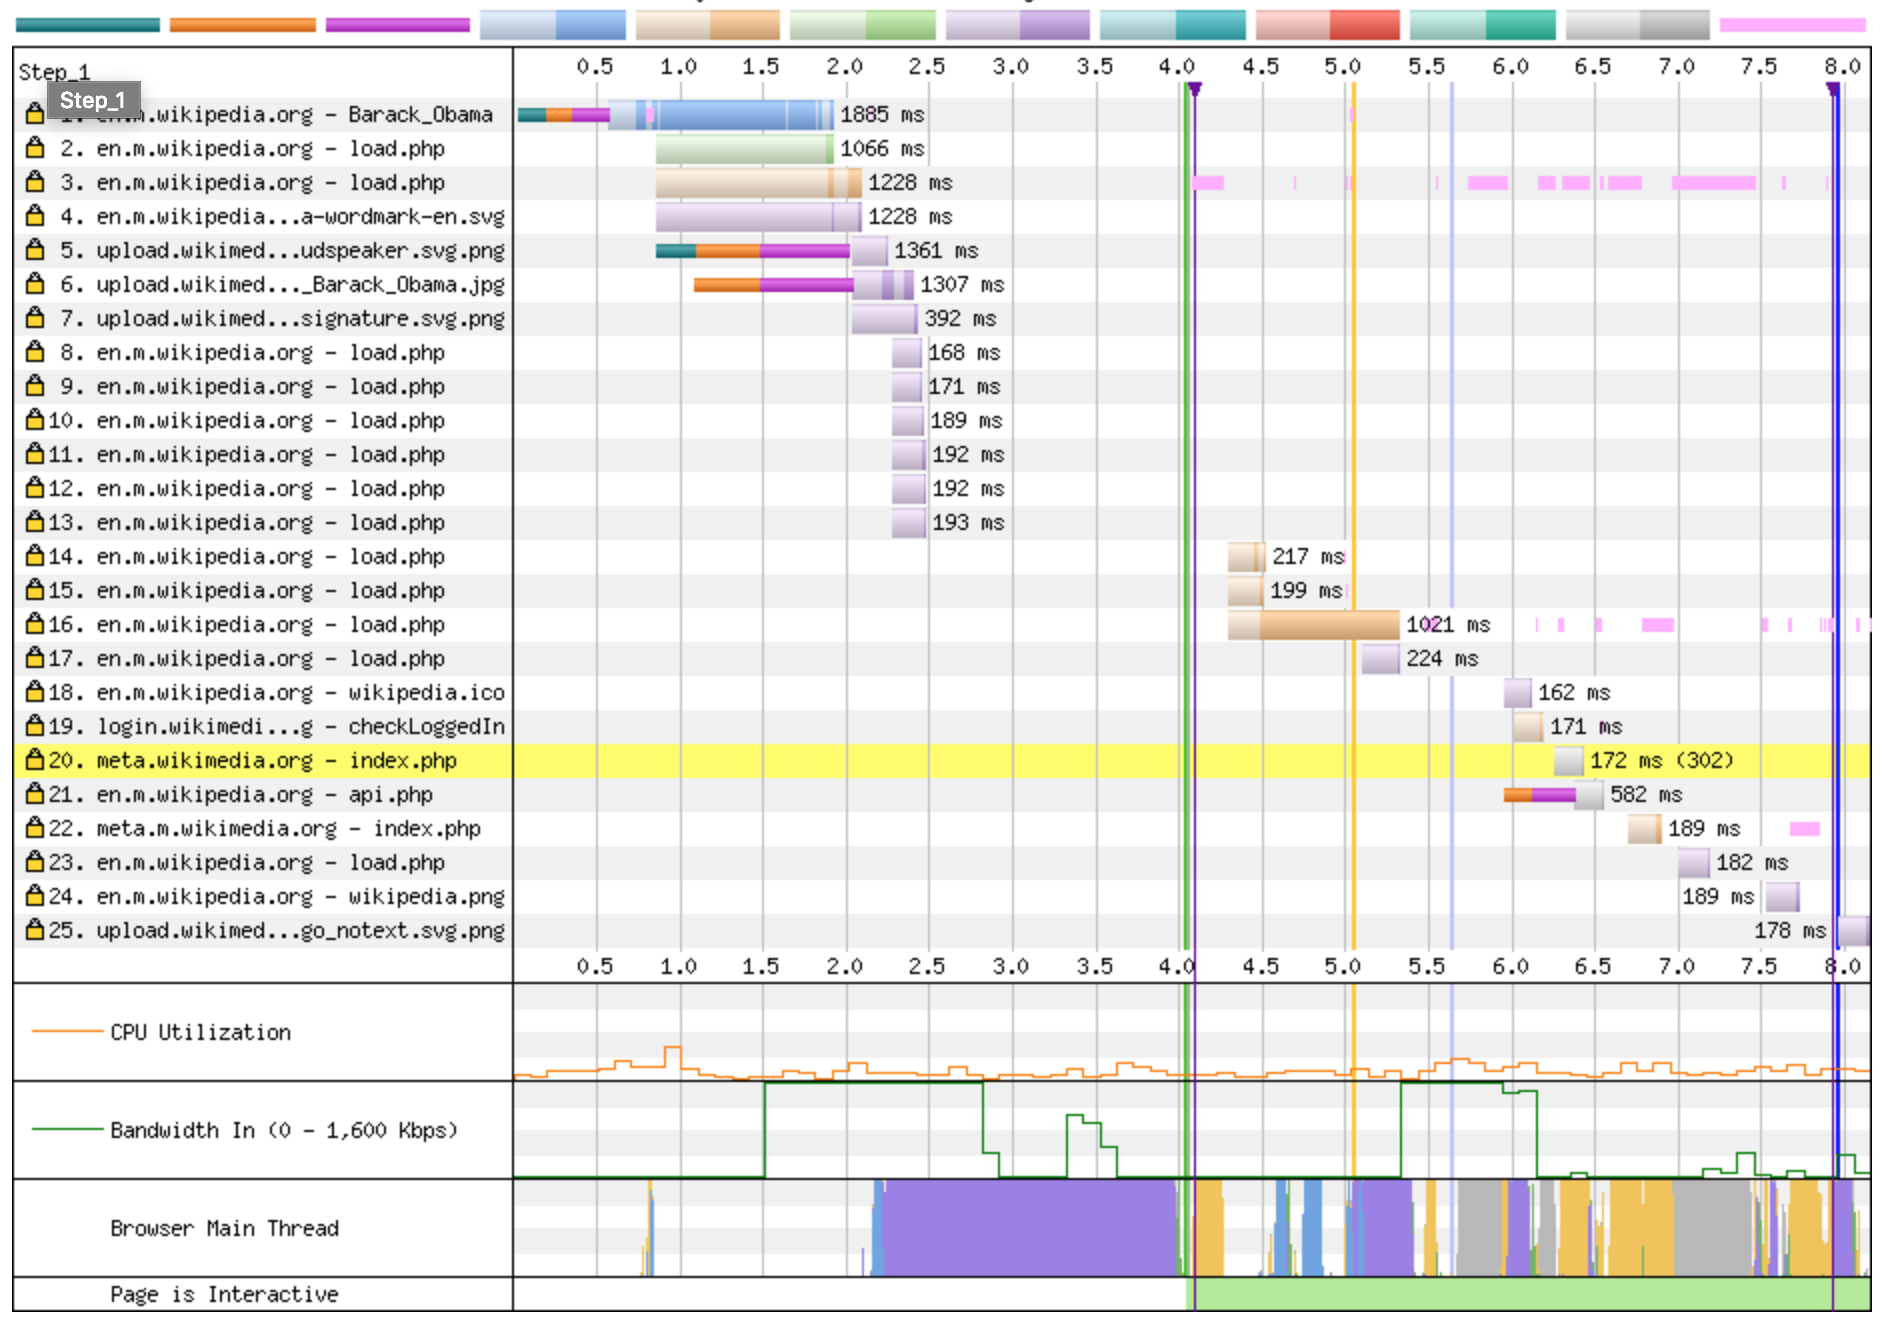
Comparing waterfalls it's a big gap between before and after:
Fast:

Slow:
It reminds me of a bug we had running Firefox on a too slow instance years ago, but then it should affect other metrics too.
No, no change after the restart. Let me look into two specific runs.
The timing when it happened and behaviour doesn't match T231929 so I guess its not the same, but let me investigate it more.
Did I say that I see this for all URLs tested for emulated mobile on WebPageTest (but nowhere else)? I did find anything, but will have a another look later on.
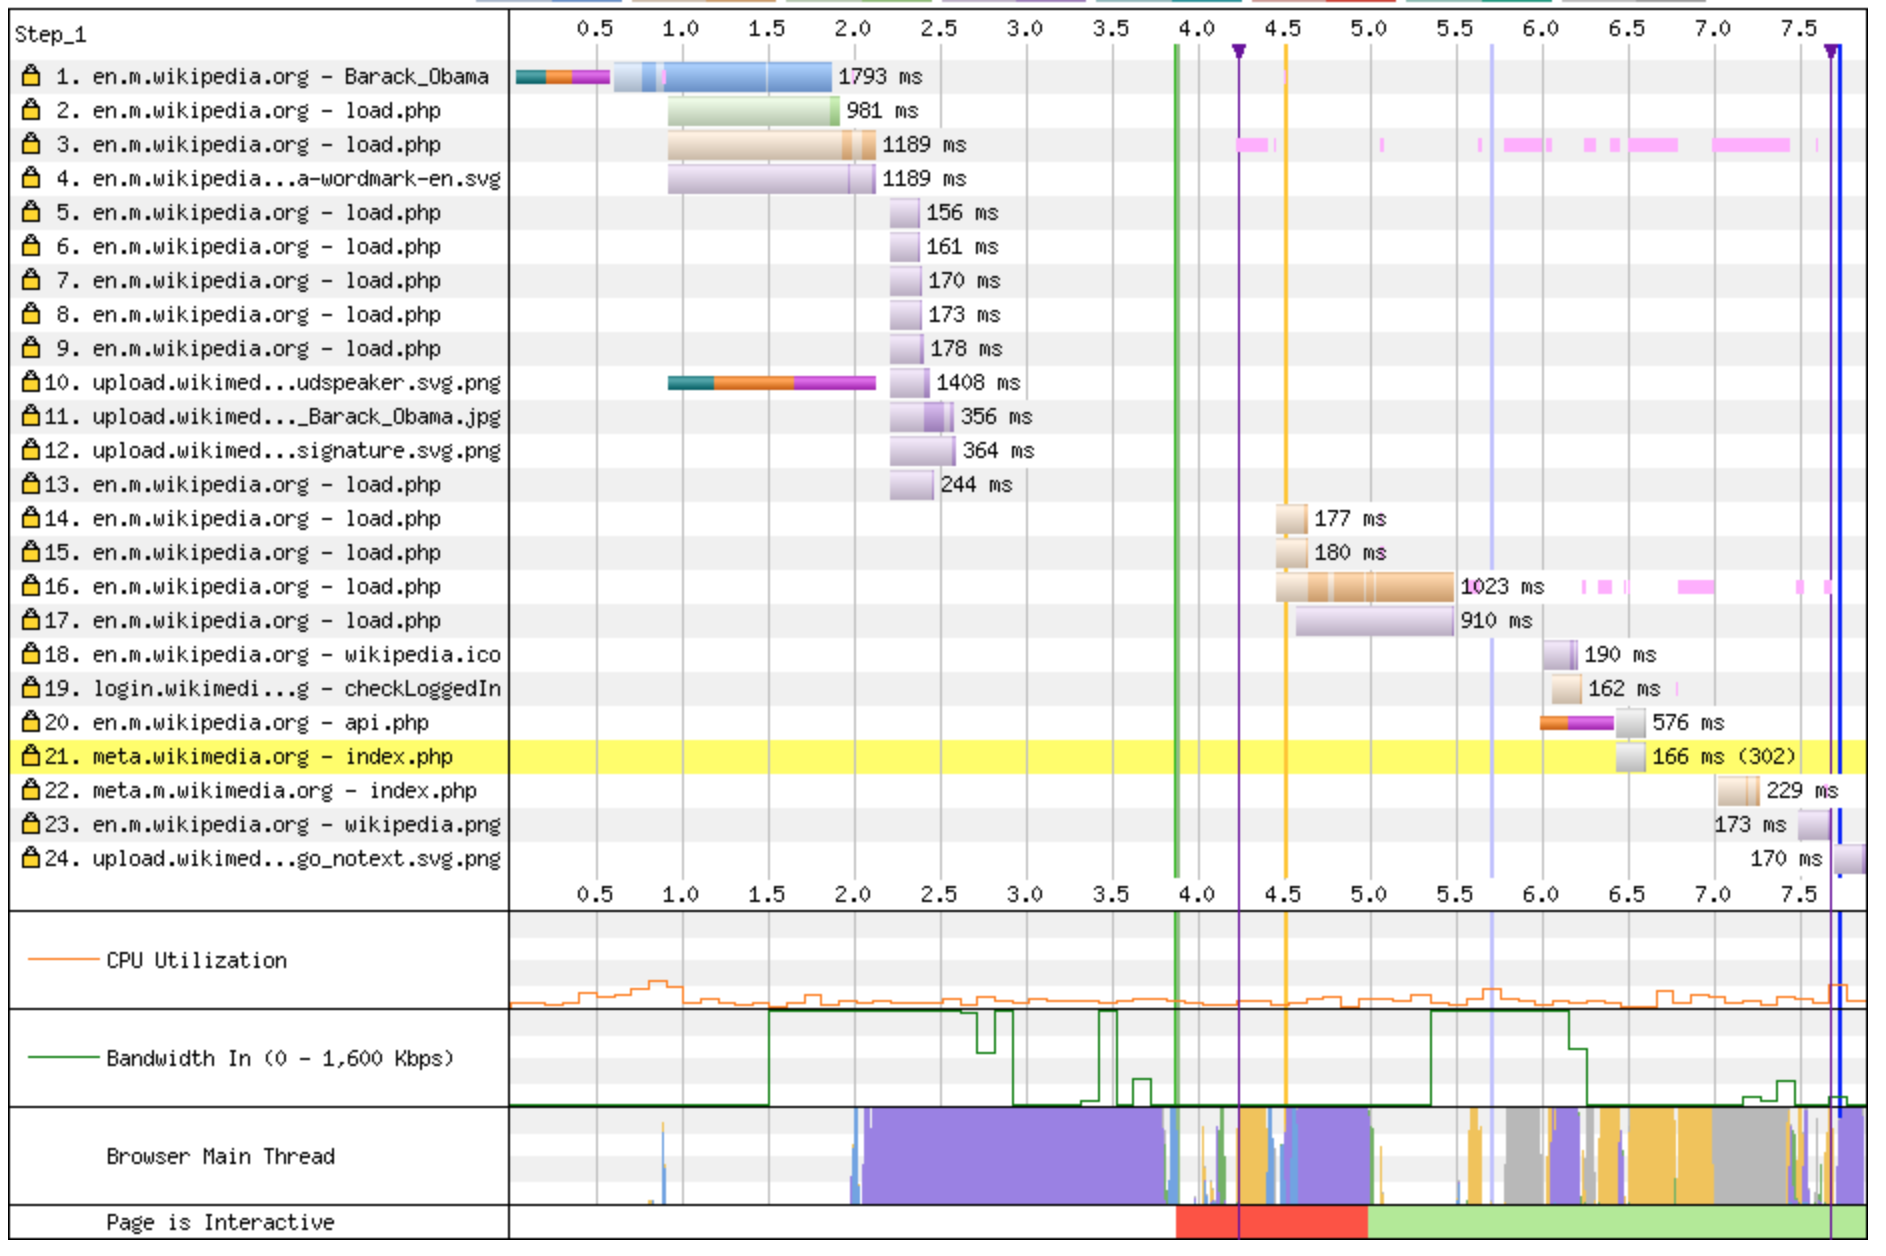
Comparing a run today and one from September 2, I see the exact same requests before reaching the first render. The bandwidth graph up to that point is pretty much the same as well. The only different seems to be that the browser main thread just takes a lot longer to run before reaching the initial render:
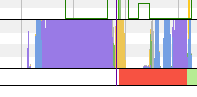
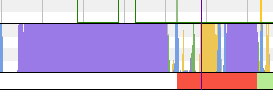
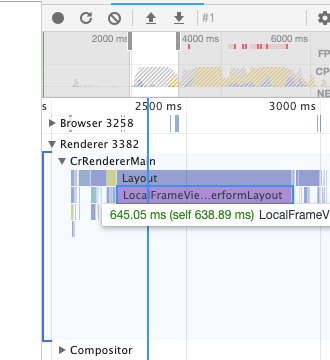
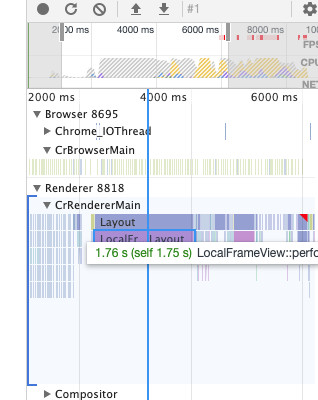
Digging into the processing timeline, it seems like it's the browser's first layout taking 1.1 extra seconds:
Comparing the HTML of the "last good run" (04/09/2019 12:01:17) and the "first bad run" (04/09/2019 14:11:02), it's absolutely identical.
Looking at the details of the other requests, the only difference I see is that 220px-President_Barack_Obama.jpg becomes a webp in the "first bad run".
Doing the same comparison on the ruwiki Facebook article, all the responses are perfectly identical except for the HTML. In that case, the difference is the MediaWiki version (first bad run with 1.34.0-wmf.20) and some minor DOM difference where attribute values appear:
And this body class is removed:
And there are related config changes in the head JS.
AMC going away:
And menu-related stuff being added:
For the Sweden article, however, the HTML is identical in the last good run and the first bad one. Making the HTML change above a red herring.
Once again, when looking at the processing timeline, the bulk of the extra time is spent on the initial layout.
I think we can conclude that the issue is in the testing environment, where the browser is somehow much slower than before for emulated mobile's initial render.
Thank you @Gilles ! What puzzles me is that we don't see any change for desktop at all, measuring from the same machine. But its different things, I agree on that. Just strange.
The device emulation is a bit of a black box. It might be good to verify that there wasn't a system update on the host around that time or something like that. I imagine that updating some linux library on the system could have a side-effect like this for example. Or a hardware incident of some kind on the host.
I want to test and deploy a new agent, just to make sure. Let me do that first thing tomorrow.
I've tested on a fresh agent (same size) and it looks the same: http://wpt.wmftest.org/results.php?test=190910_SB_9b8bf08859c512614318c497b335b0b2
I also saw this today: https://github.com/WPO-Foundation/wptagent/issues/285 - problem for users running emulated mobile on WebPageTest, looks upstream Chrome changes. Wonder if a Chrome update has been pushed that caused it? On the other instances we run the exact Chrome version all the time (+ we don't use the netlog to create the waterfall).
Any updates on this?
Can we be confident at this point that tooling is at fault and not the site or is there a possibility something regressed?
Looking at the waterfalls http://wpt.wmftest.org/results.php?test=211018_30_49 the gap is gone now.
At the time when this happened, we didn't have a good tooling to see if something is wrong/changes on the host machine where we run our tests. Now we run the CPU benchmarks test (as we also run for some real users), that helps us see if the machine where we run the tests are stable.
I'm closing this, and I'm pretty sure this was an issue with the WebPageTest instance. When it happens the next time I hope we can see it in the CPU benchmark metric.