https://www.mediawiki.org/wiki/MediaWiki_1.34/wmf.22
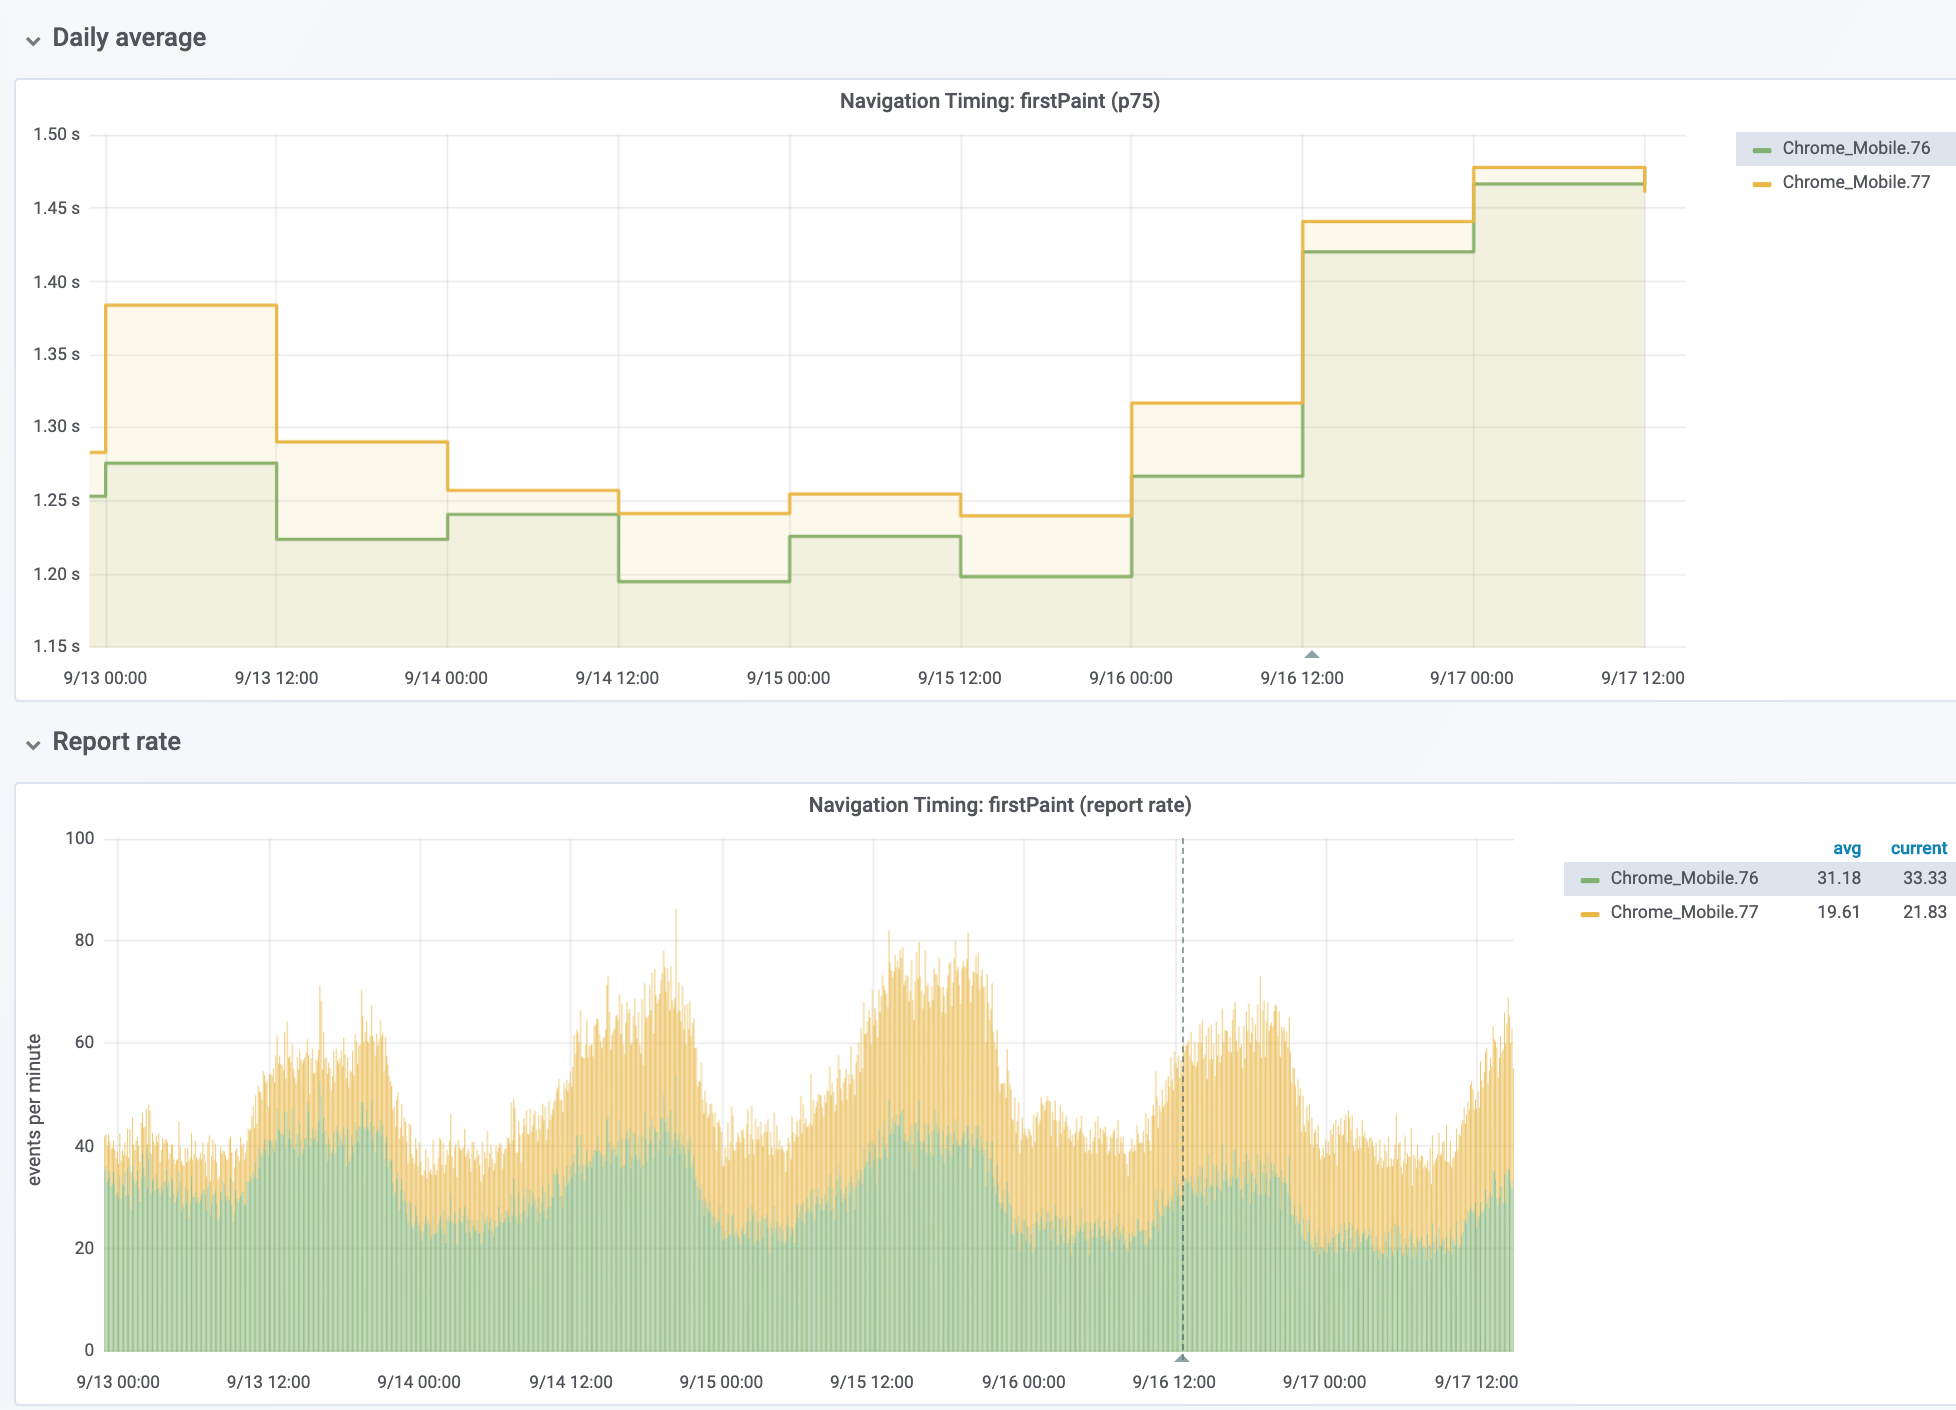
RUM
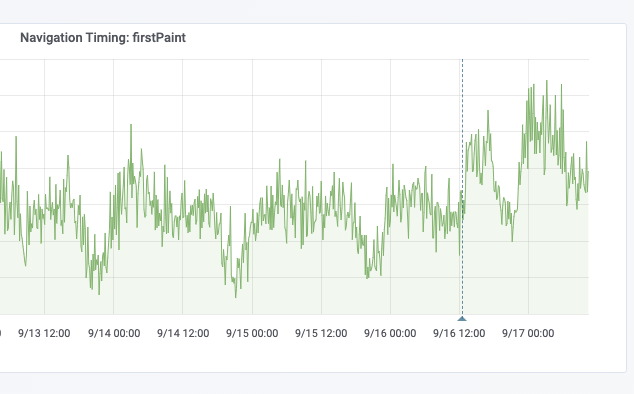
Affected RUM metrics (non-exhaustive list):
- domInteractive
- domComplete
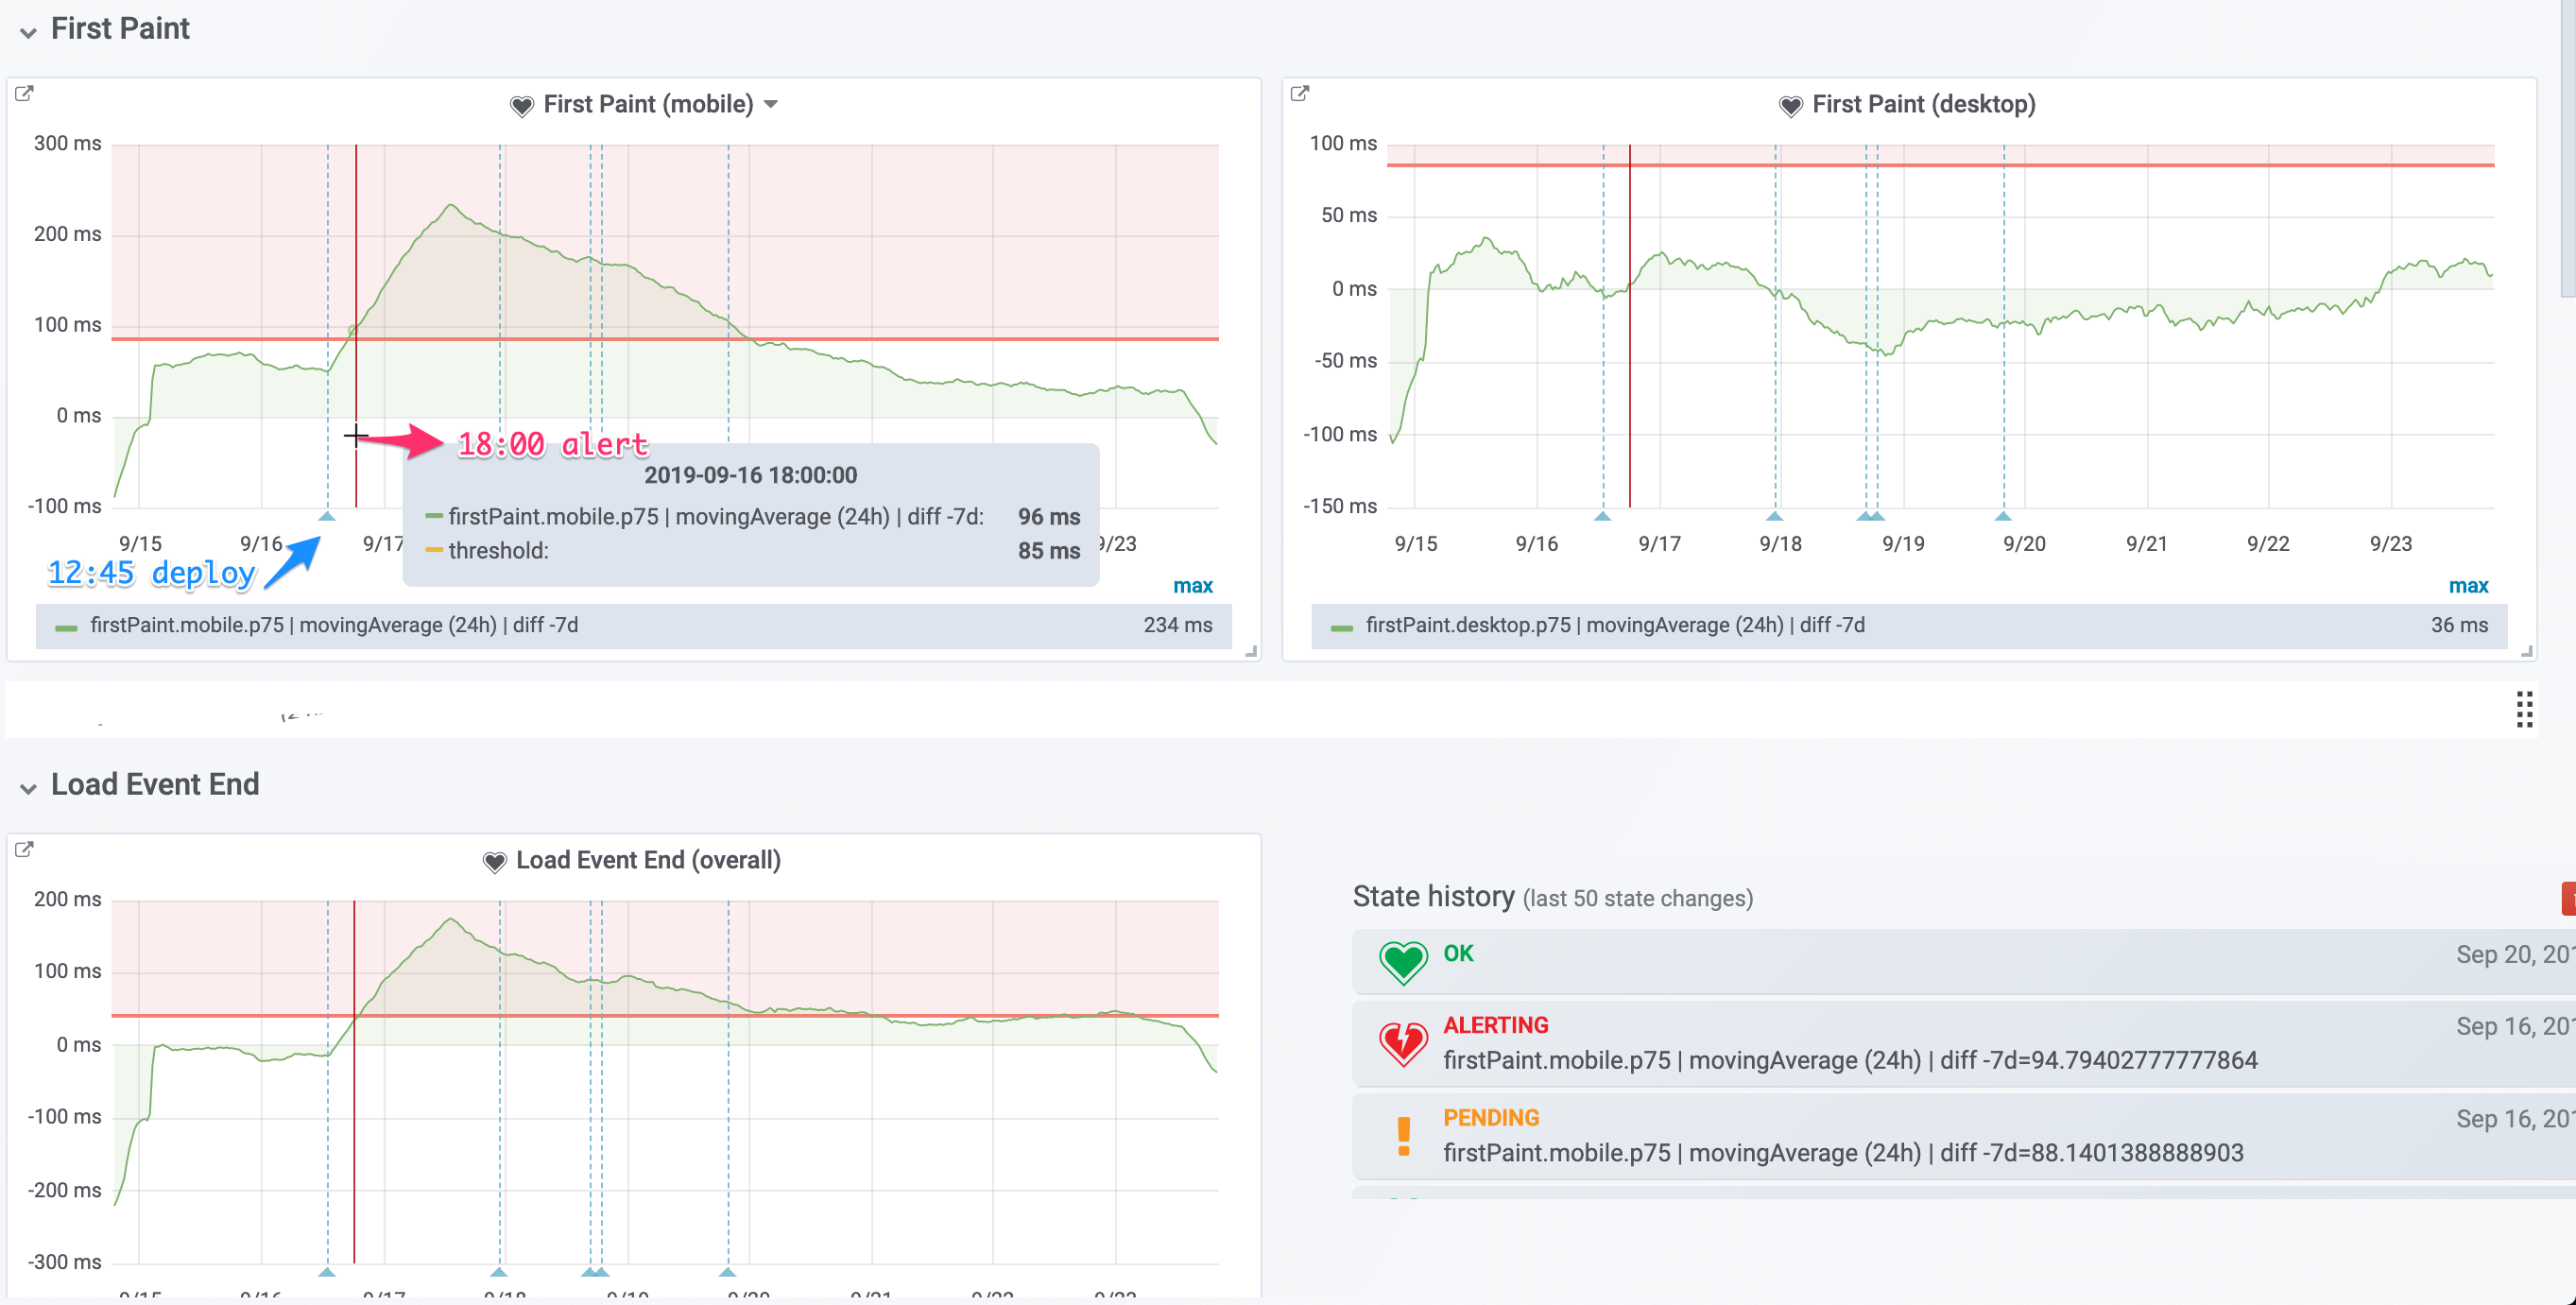
- firstPaint
- loadEventEnd
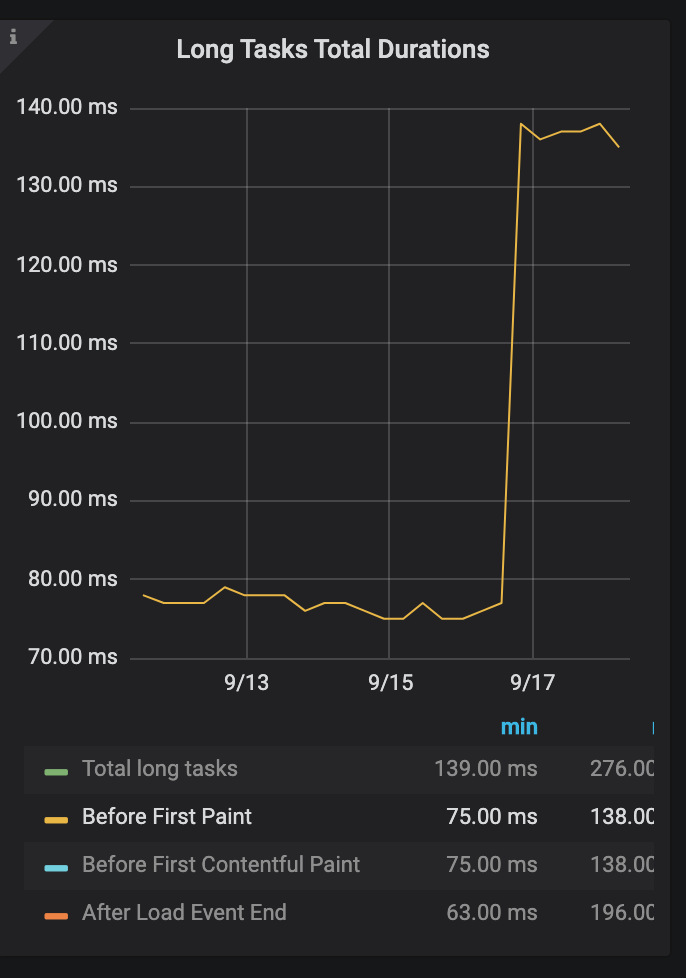
- processing
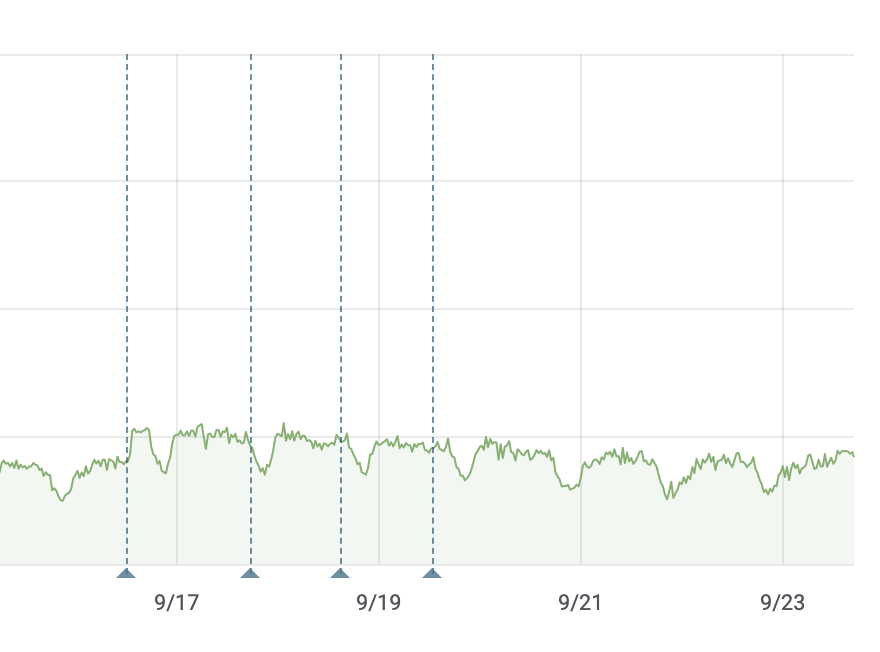
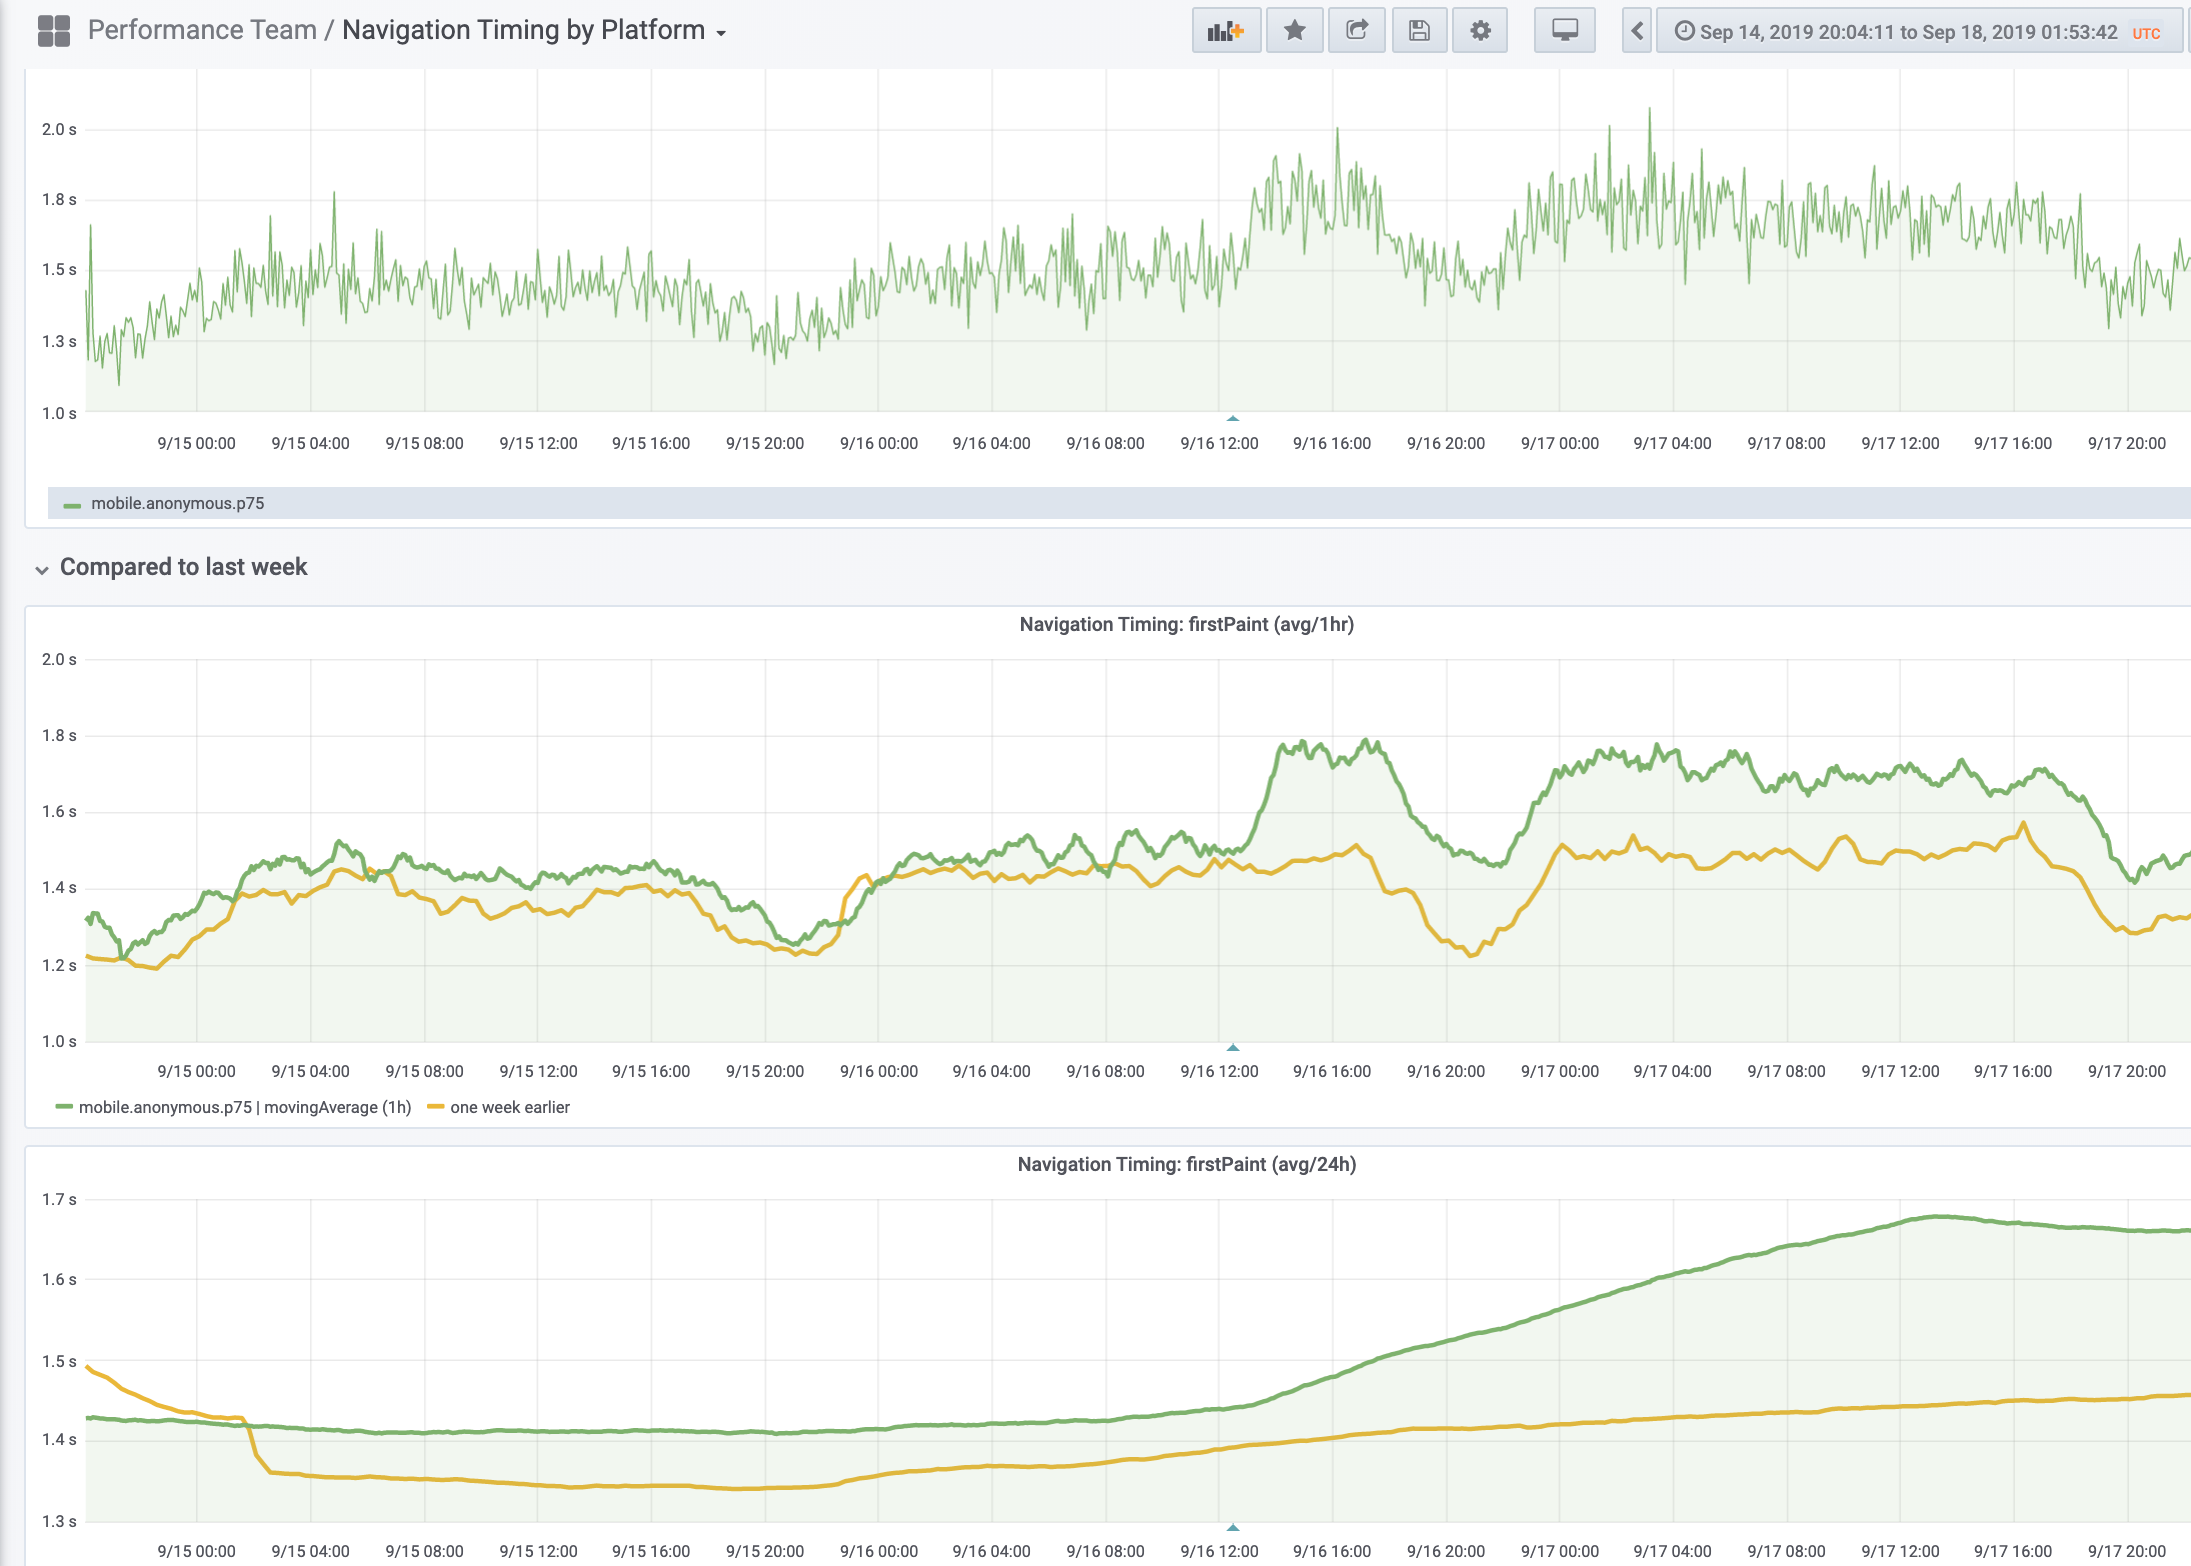
Latency, request/response time are unaffected, ruling out a networking issue.
Looking at the platform dashboard, it's very clear that this is a mobile web-only regression.
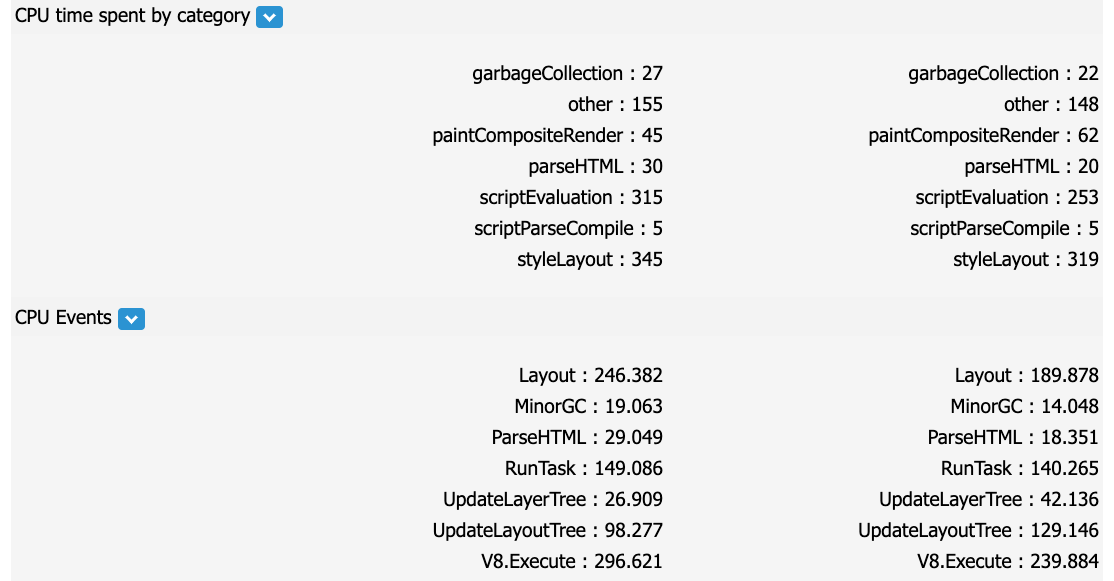
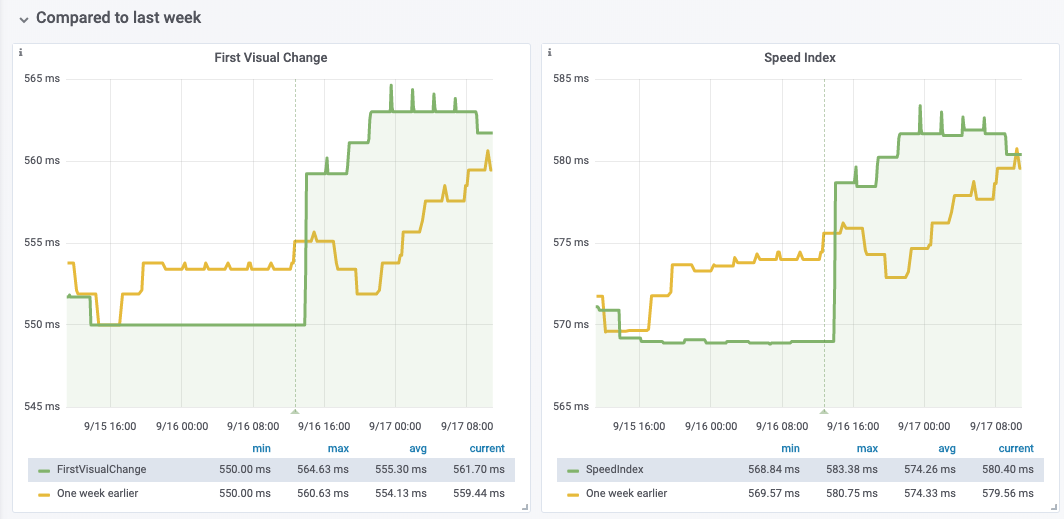
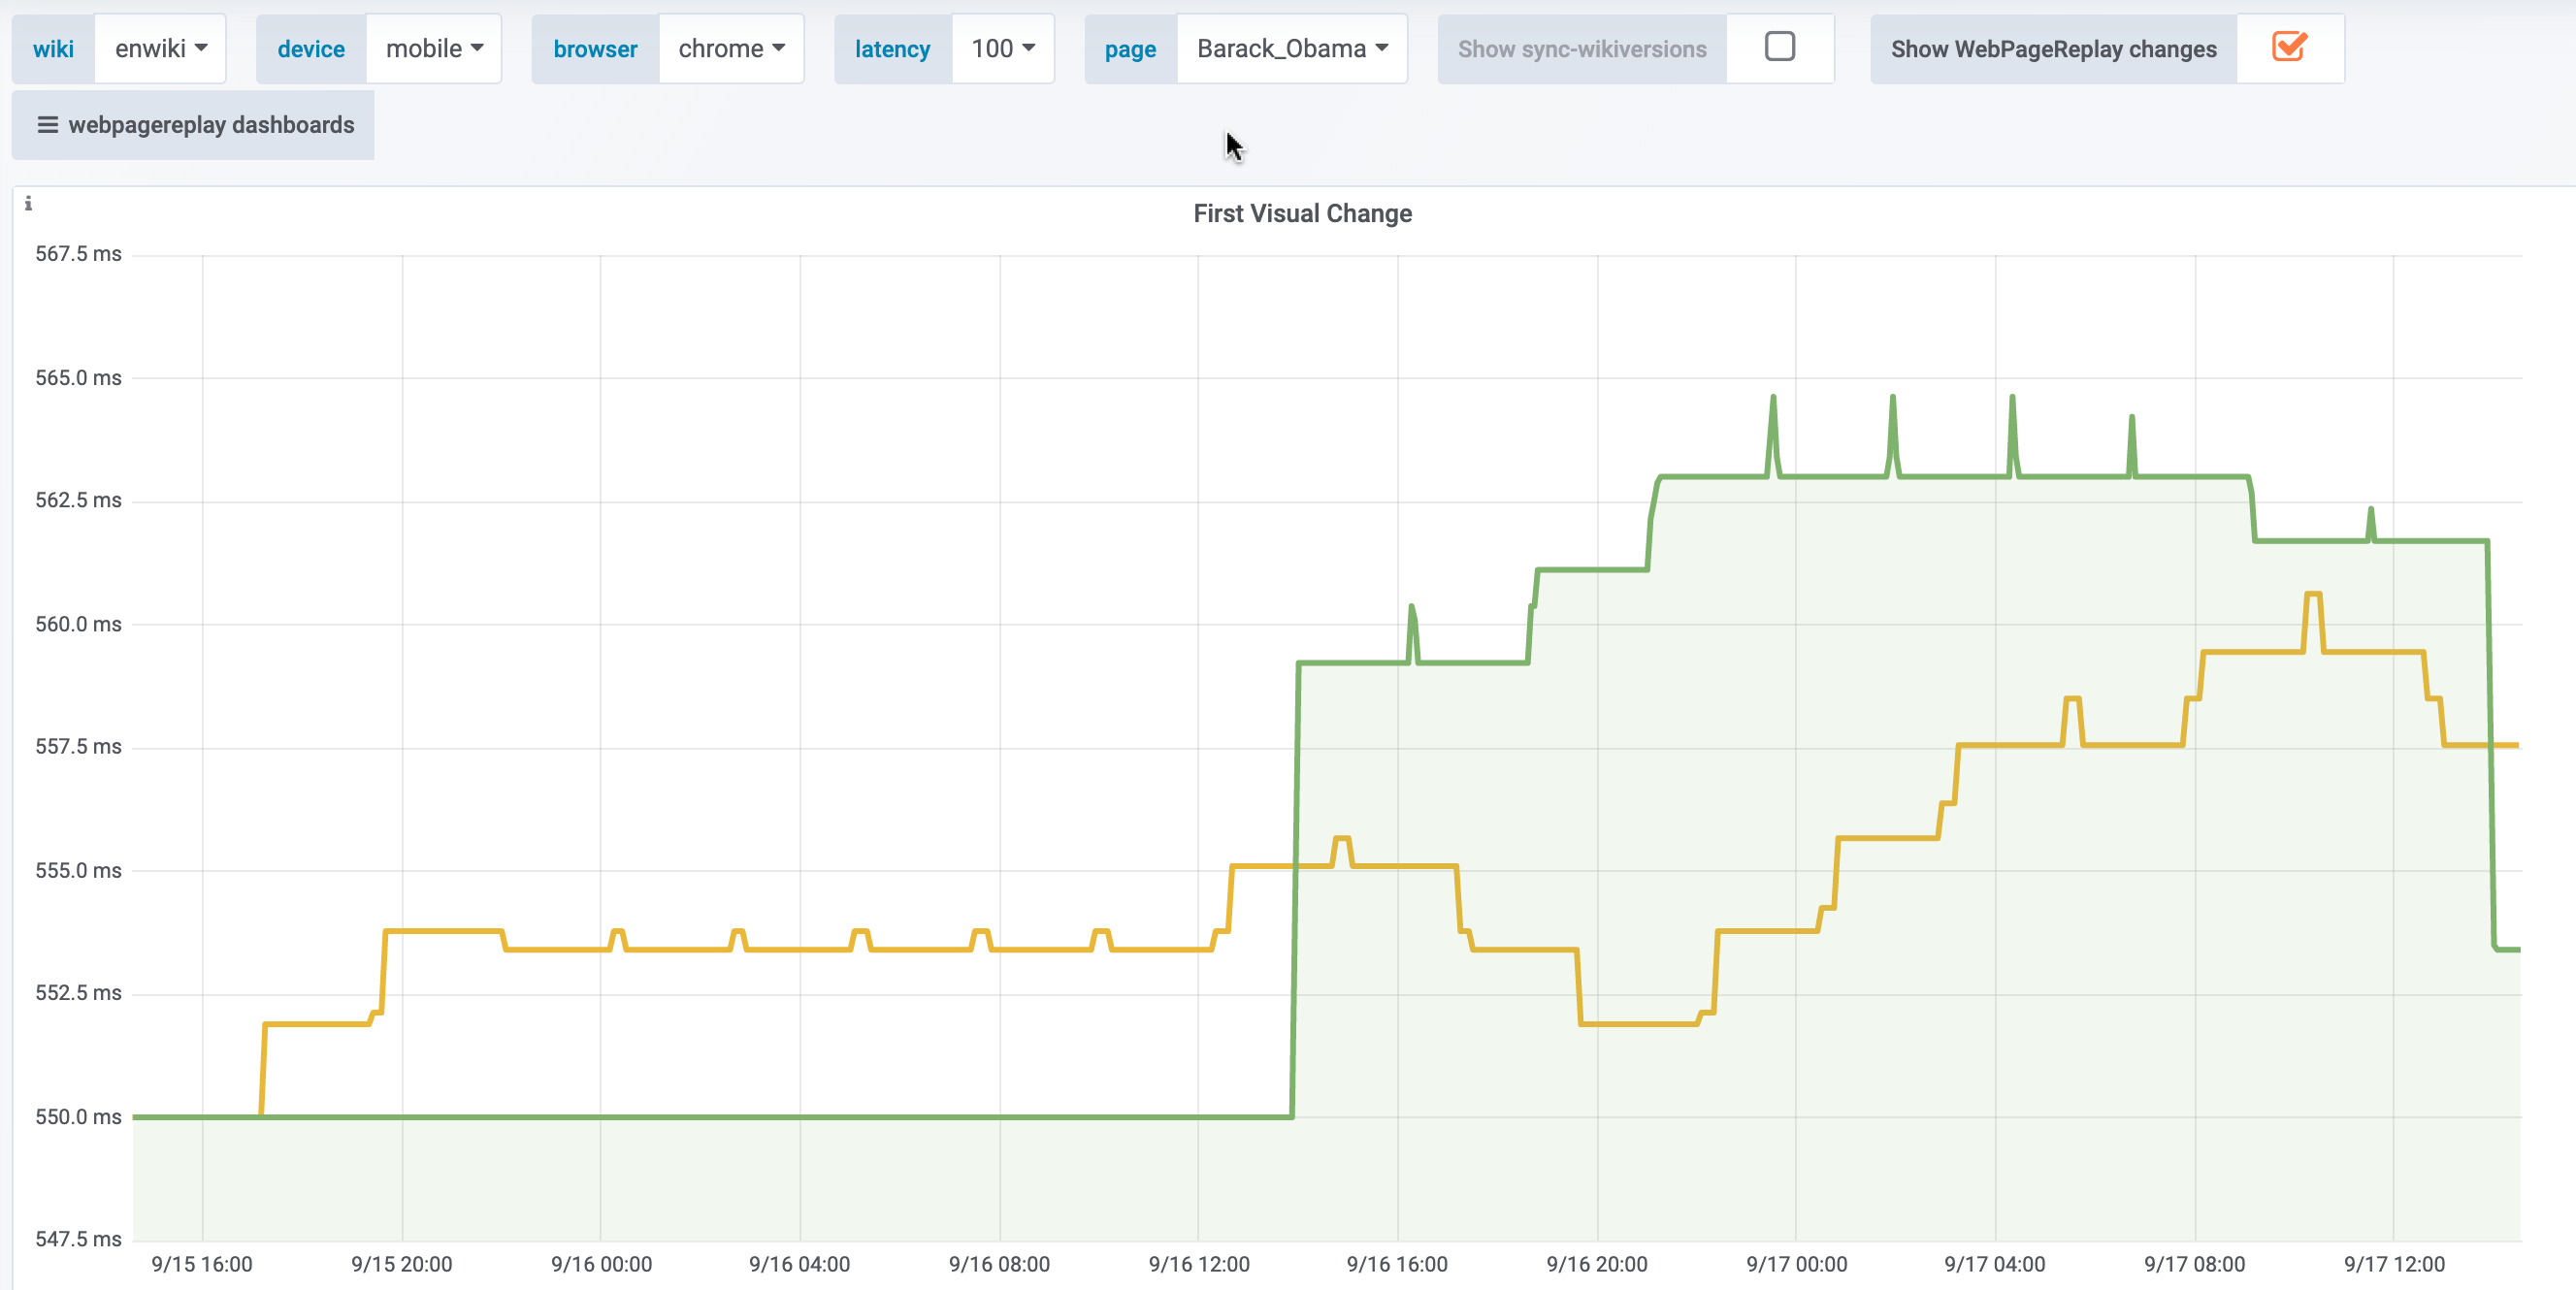
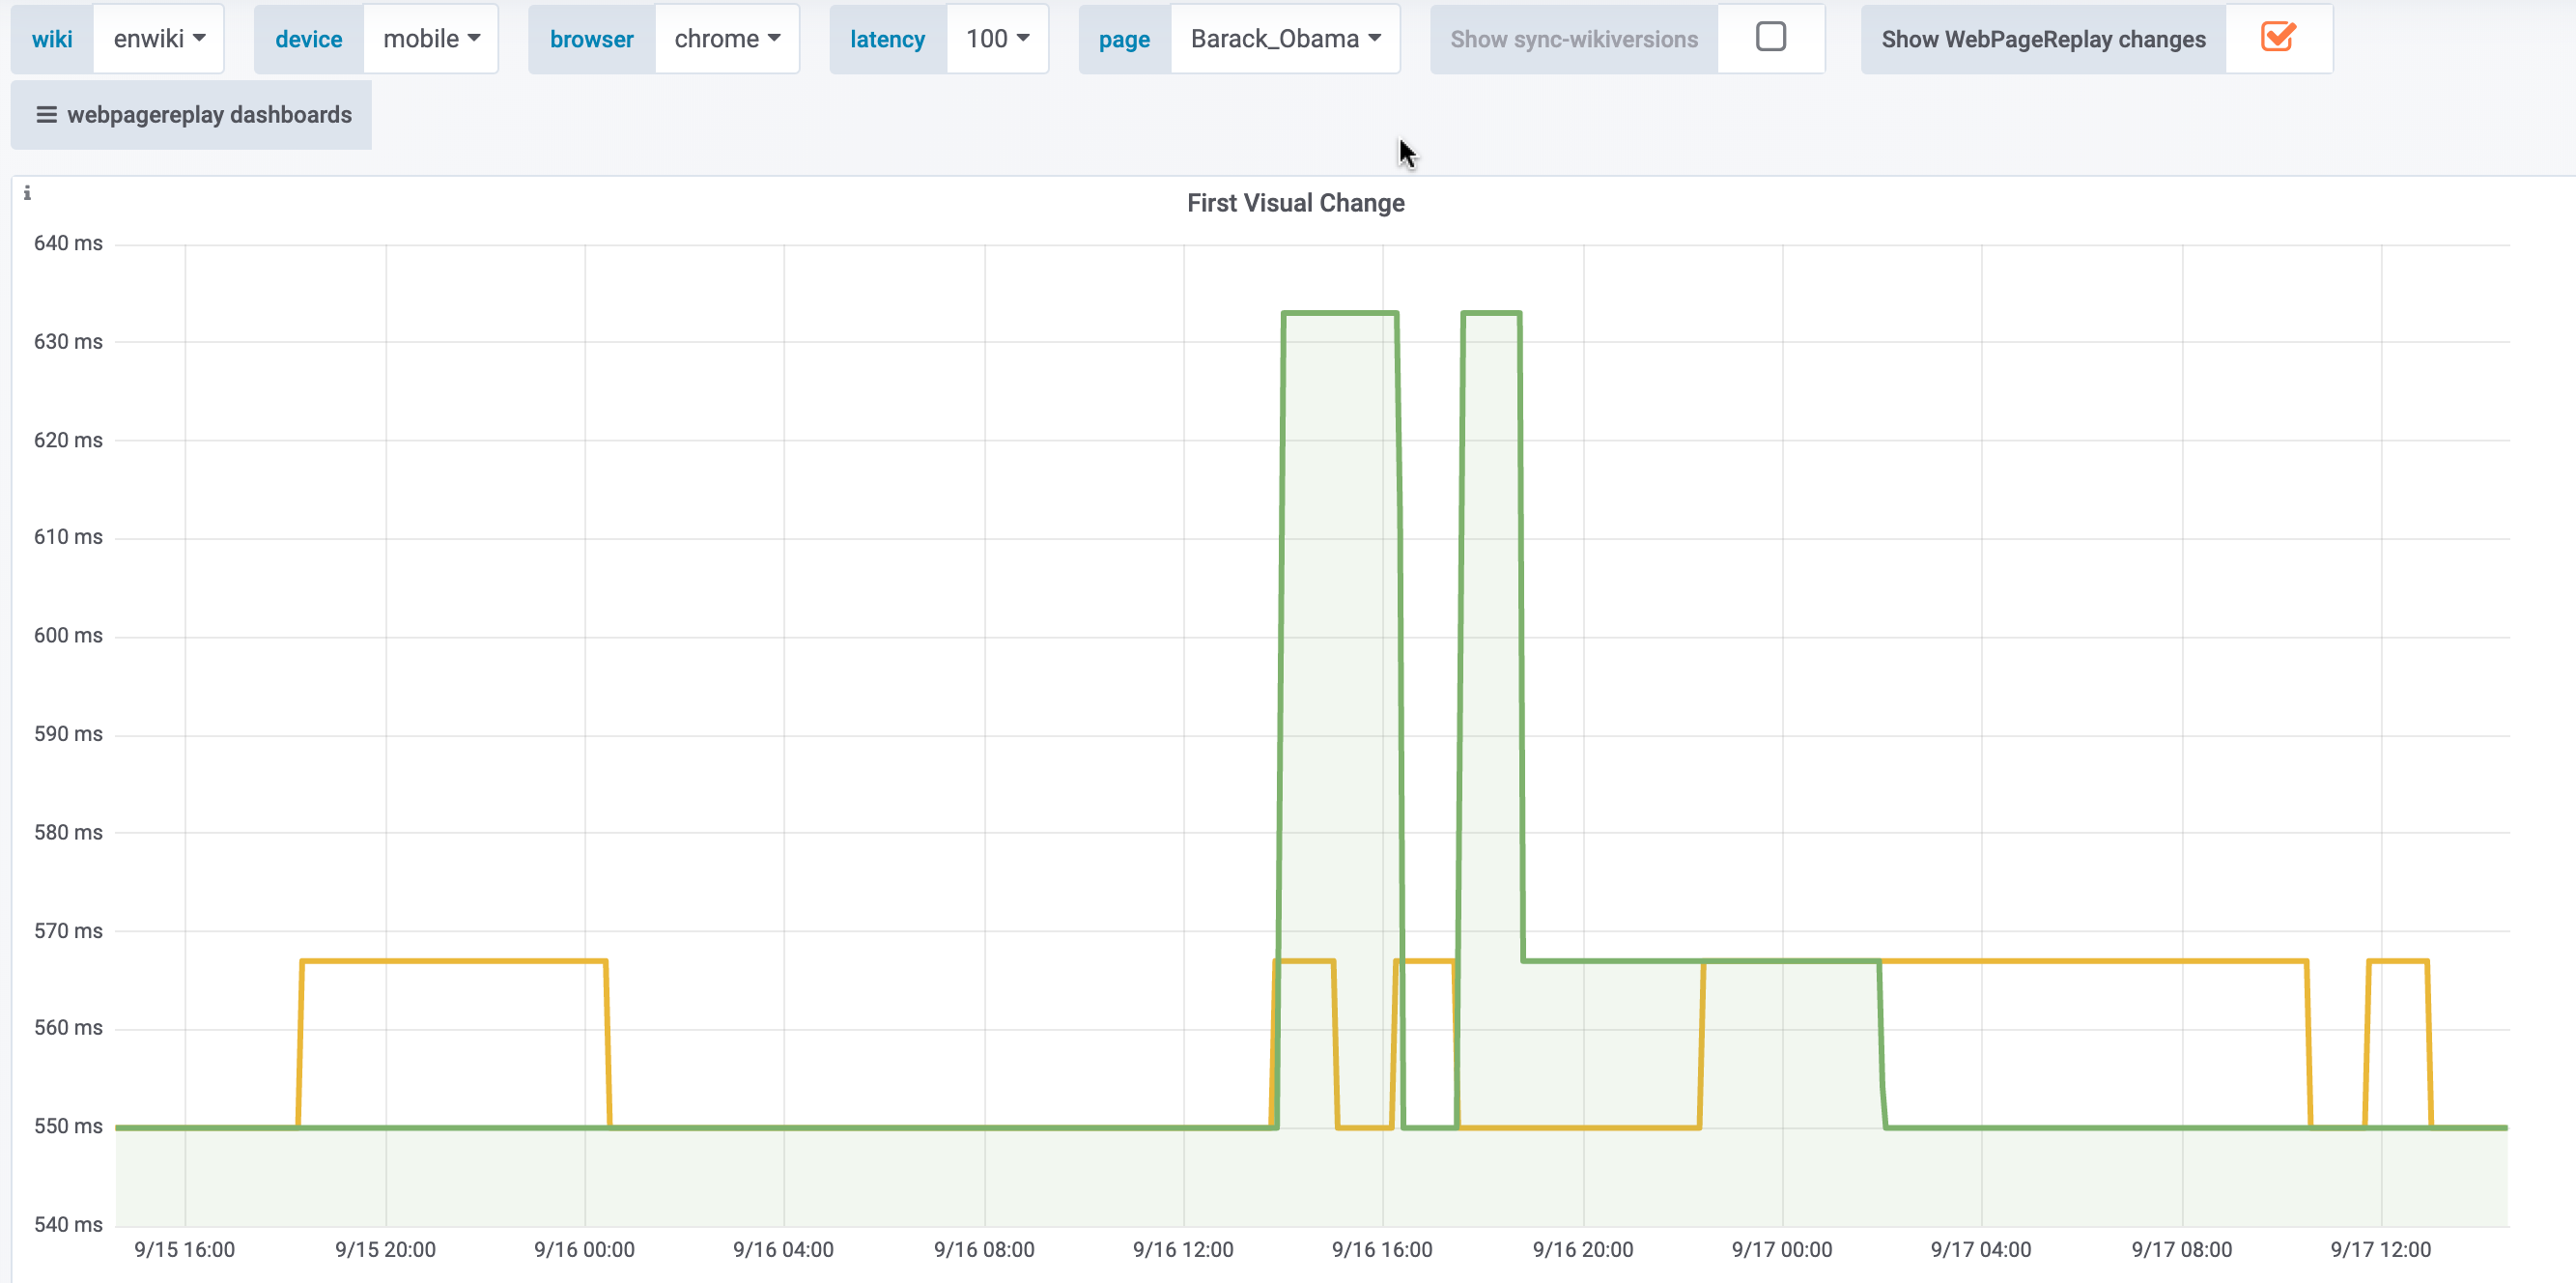
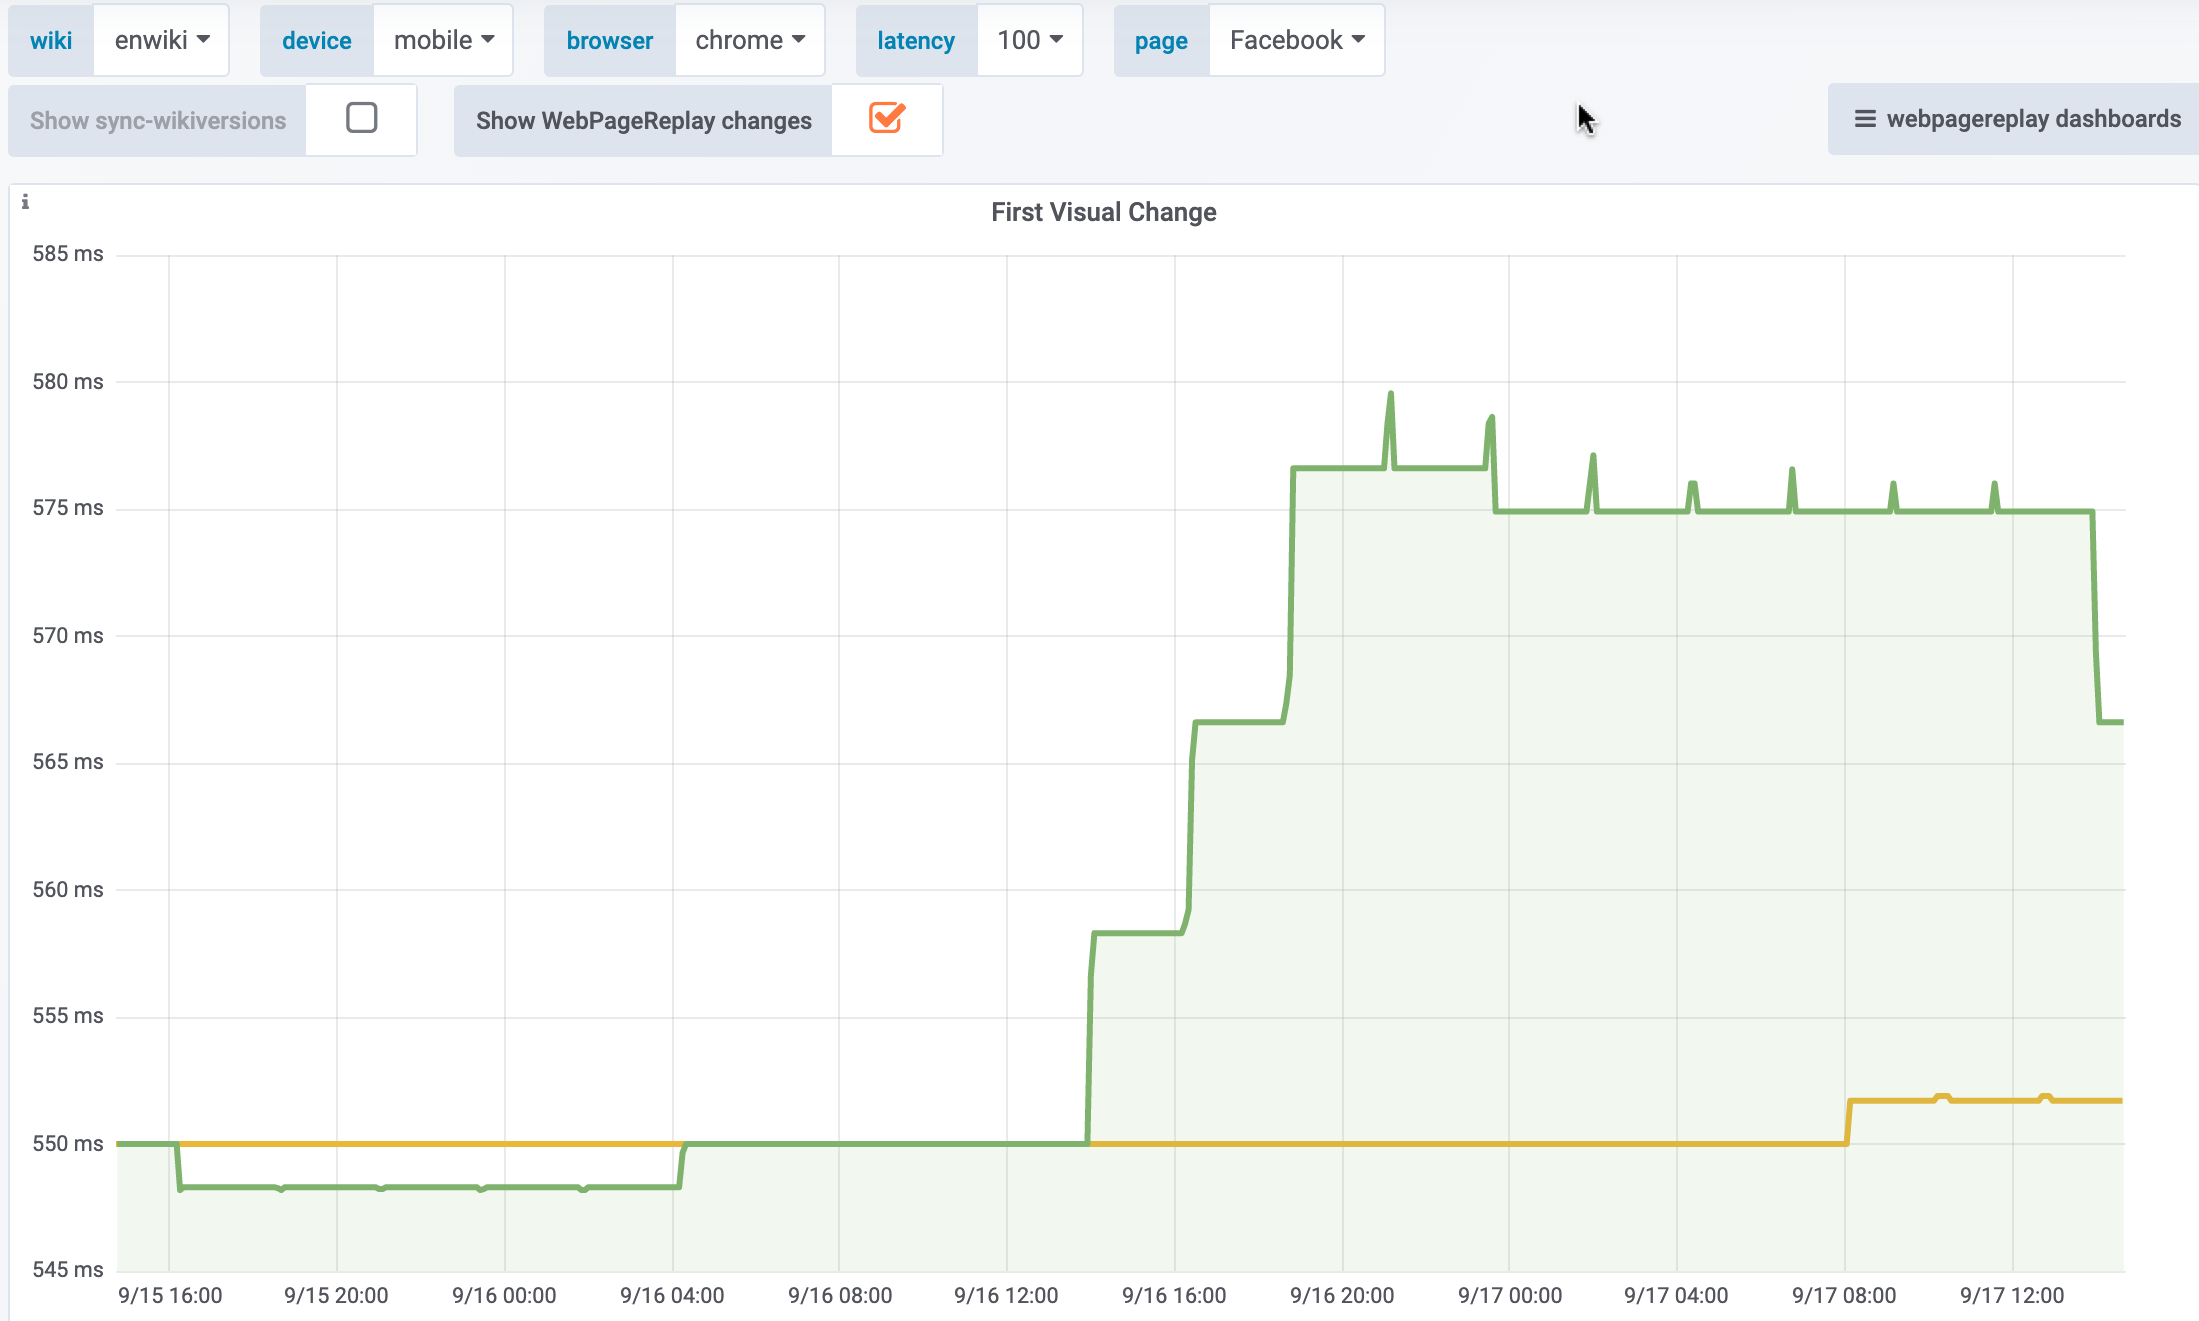
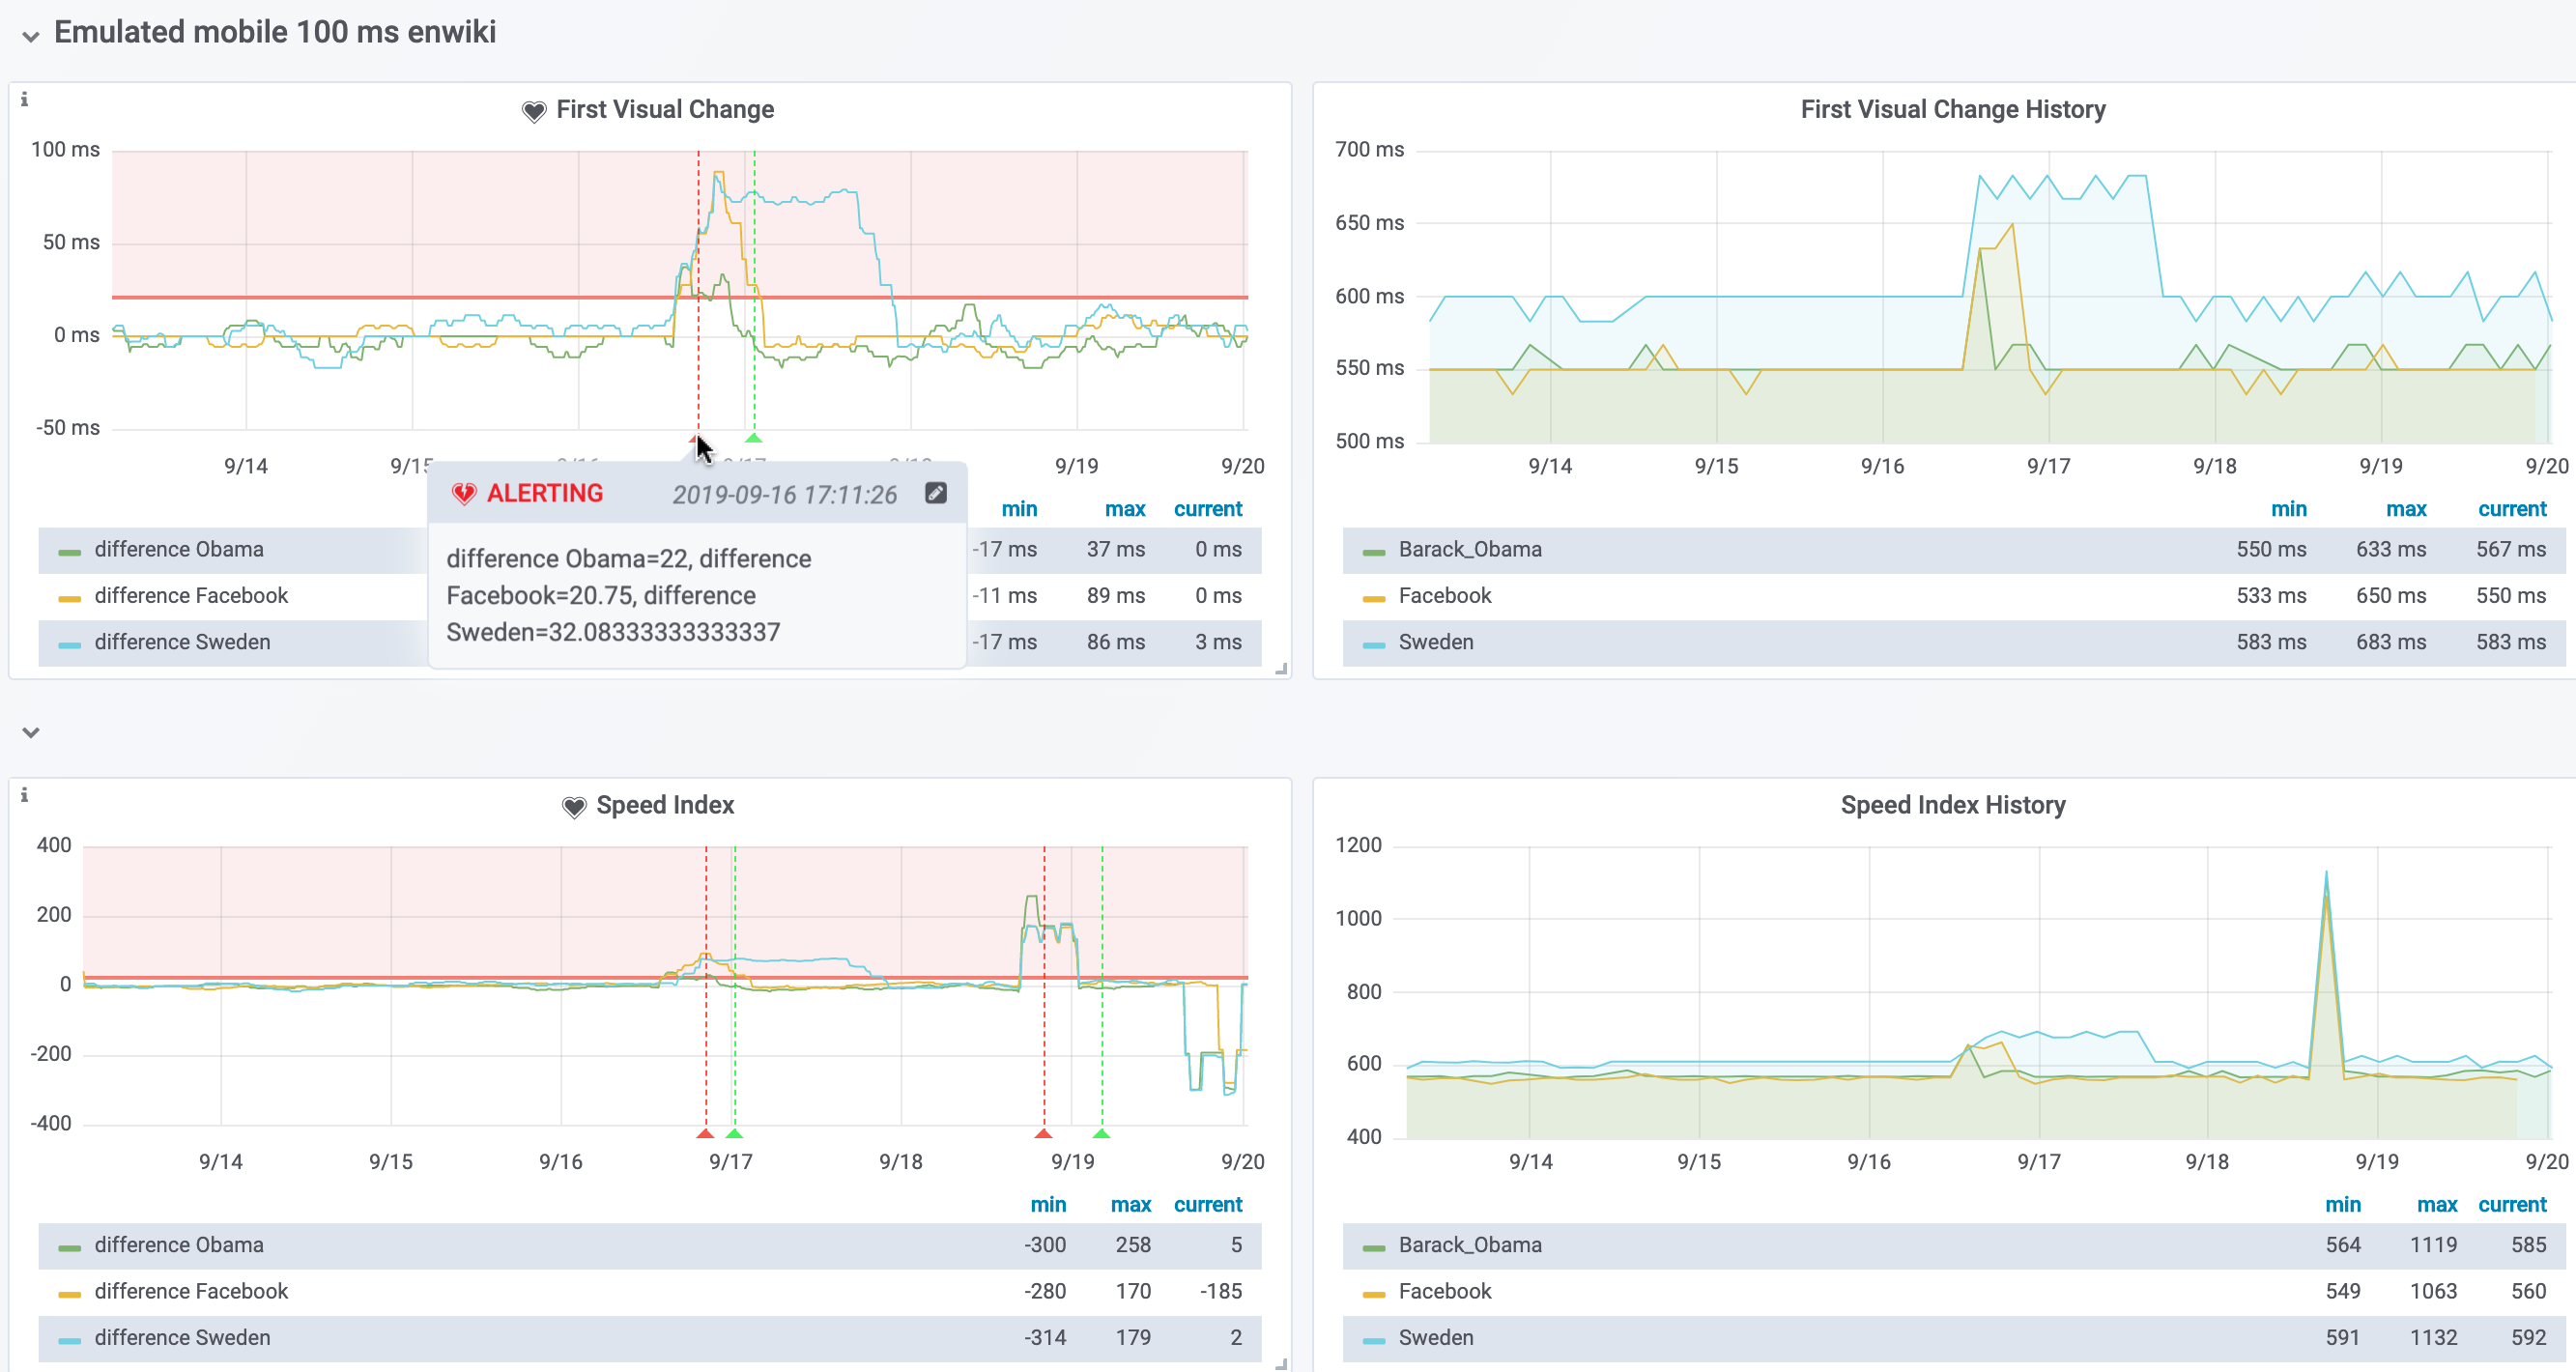
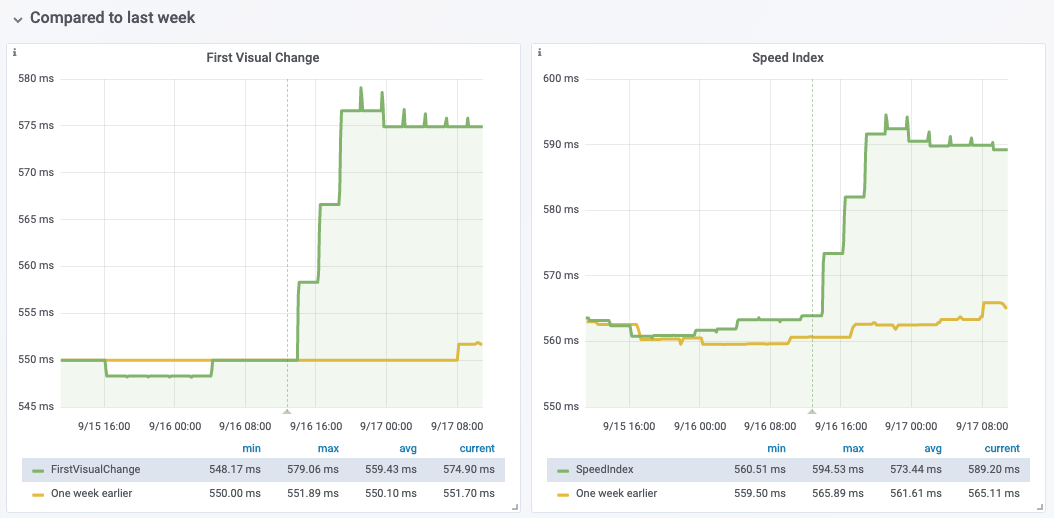
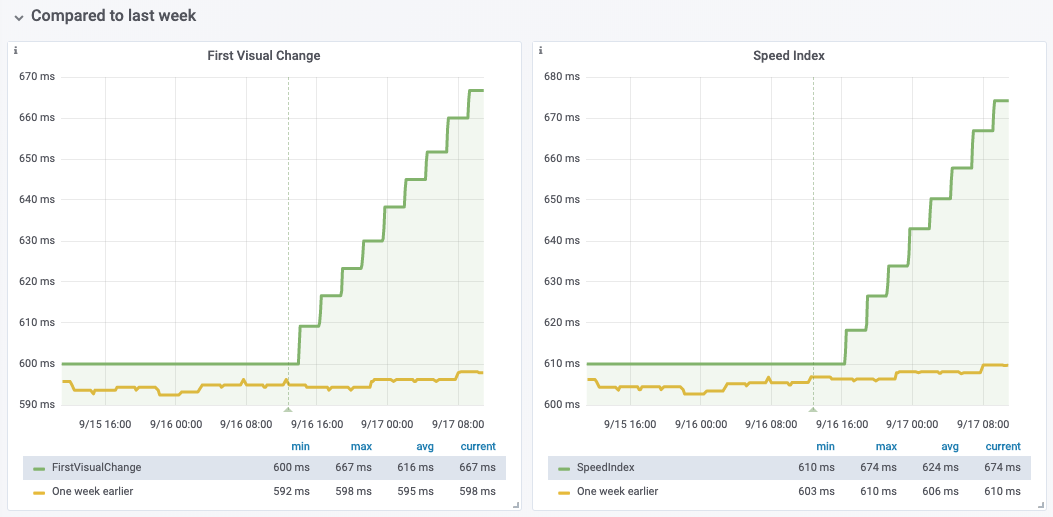
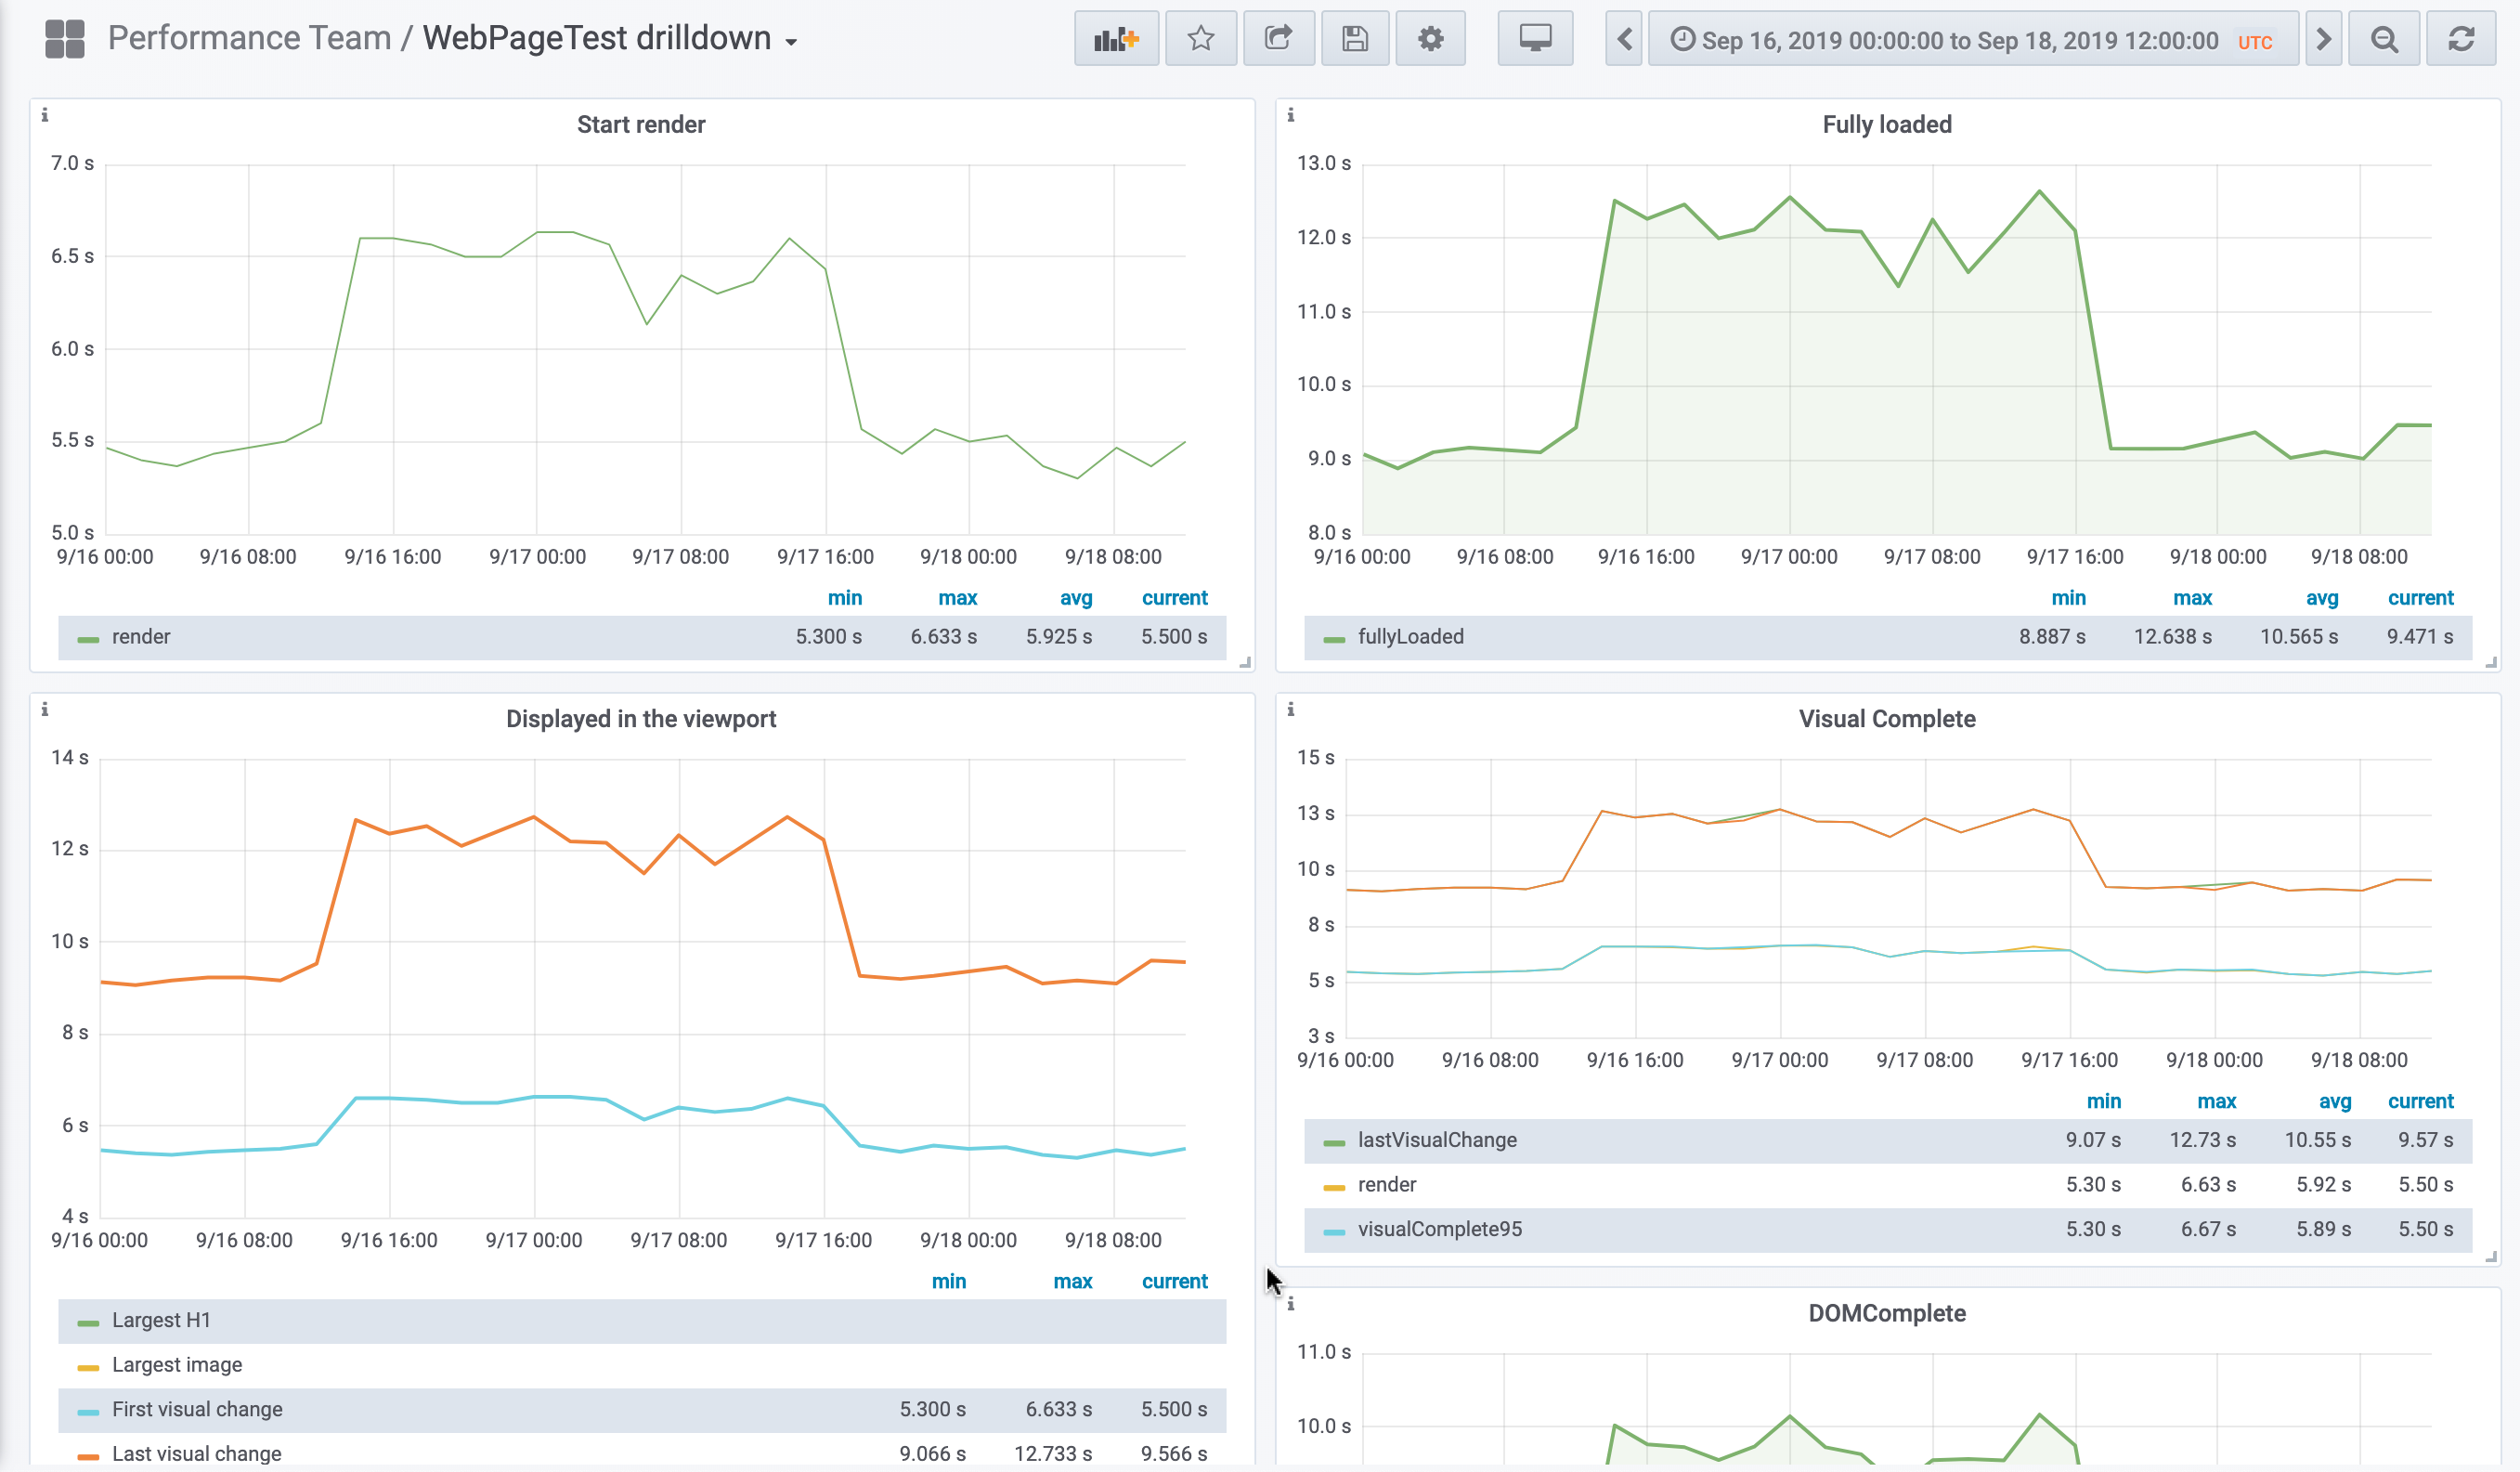
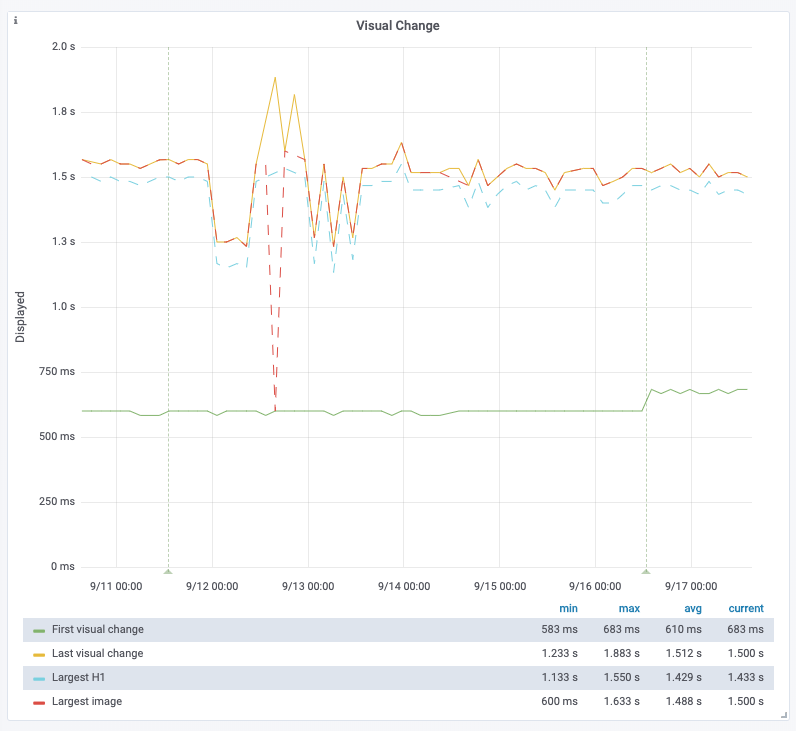
Synthetic
Only visible for the Sweden article on WPR. Not for the other articles on WPR, nor on WPT:
Human
Survey satisfaction ratios on mobile:
| Day | eswiki | ruwiki |
| Sep 14 | 88.01% | 89.10% |
| Sep 15 | 88.07% | 88.37% |
| Sep 16 | 86.24% | 86.31% |
| Sep 17 (partial) | 84.75% | 87% |