Page MenuHomePhabricator

Add device memory usage metric to Fresnel reports
Open, MediumPublic

Assigned To
None
Authored By
Krinkle
Sep 24 2019, 5:24 PM
Referenced Files
F34940536: Screenshot 2022-02-02 at 14.00.03.png
Feb 2 2022, 1:13 PM
F34940543: chrome-tracelog.jpg
Feb 2 2022, 1:13 PM
F30504192: Screenshot 2019-09-29 at 10.01.40.png
Sep 29 2019, 8:10 AM
F30504191: Screenshot 2019-09-29 at 10.01.02.png
Sep 29 2019, 8:10 AM

Description

We should be able to see if patches like https://gerrit.wikimedia.org/r/538926 improve memory usage.

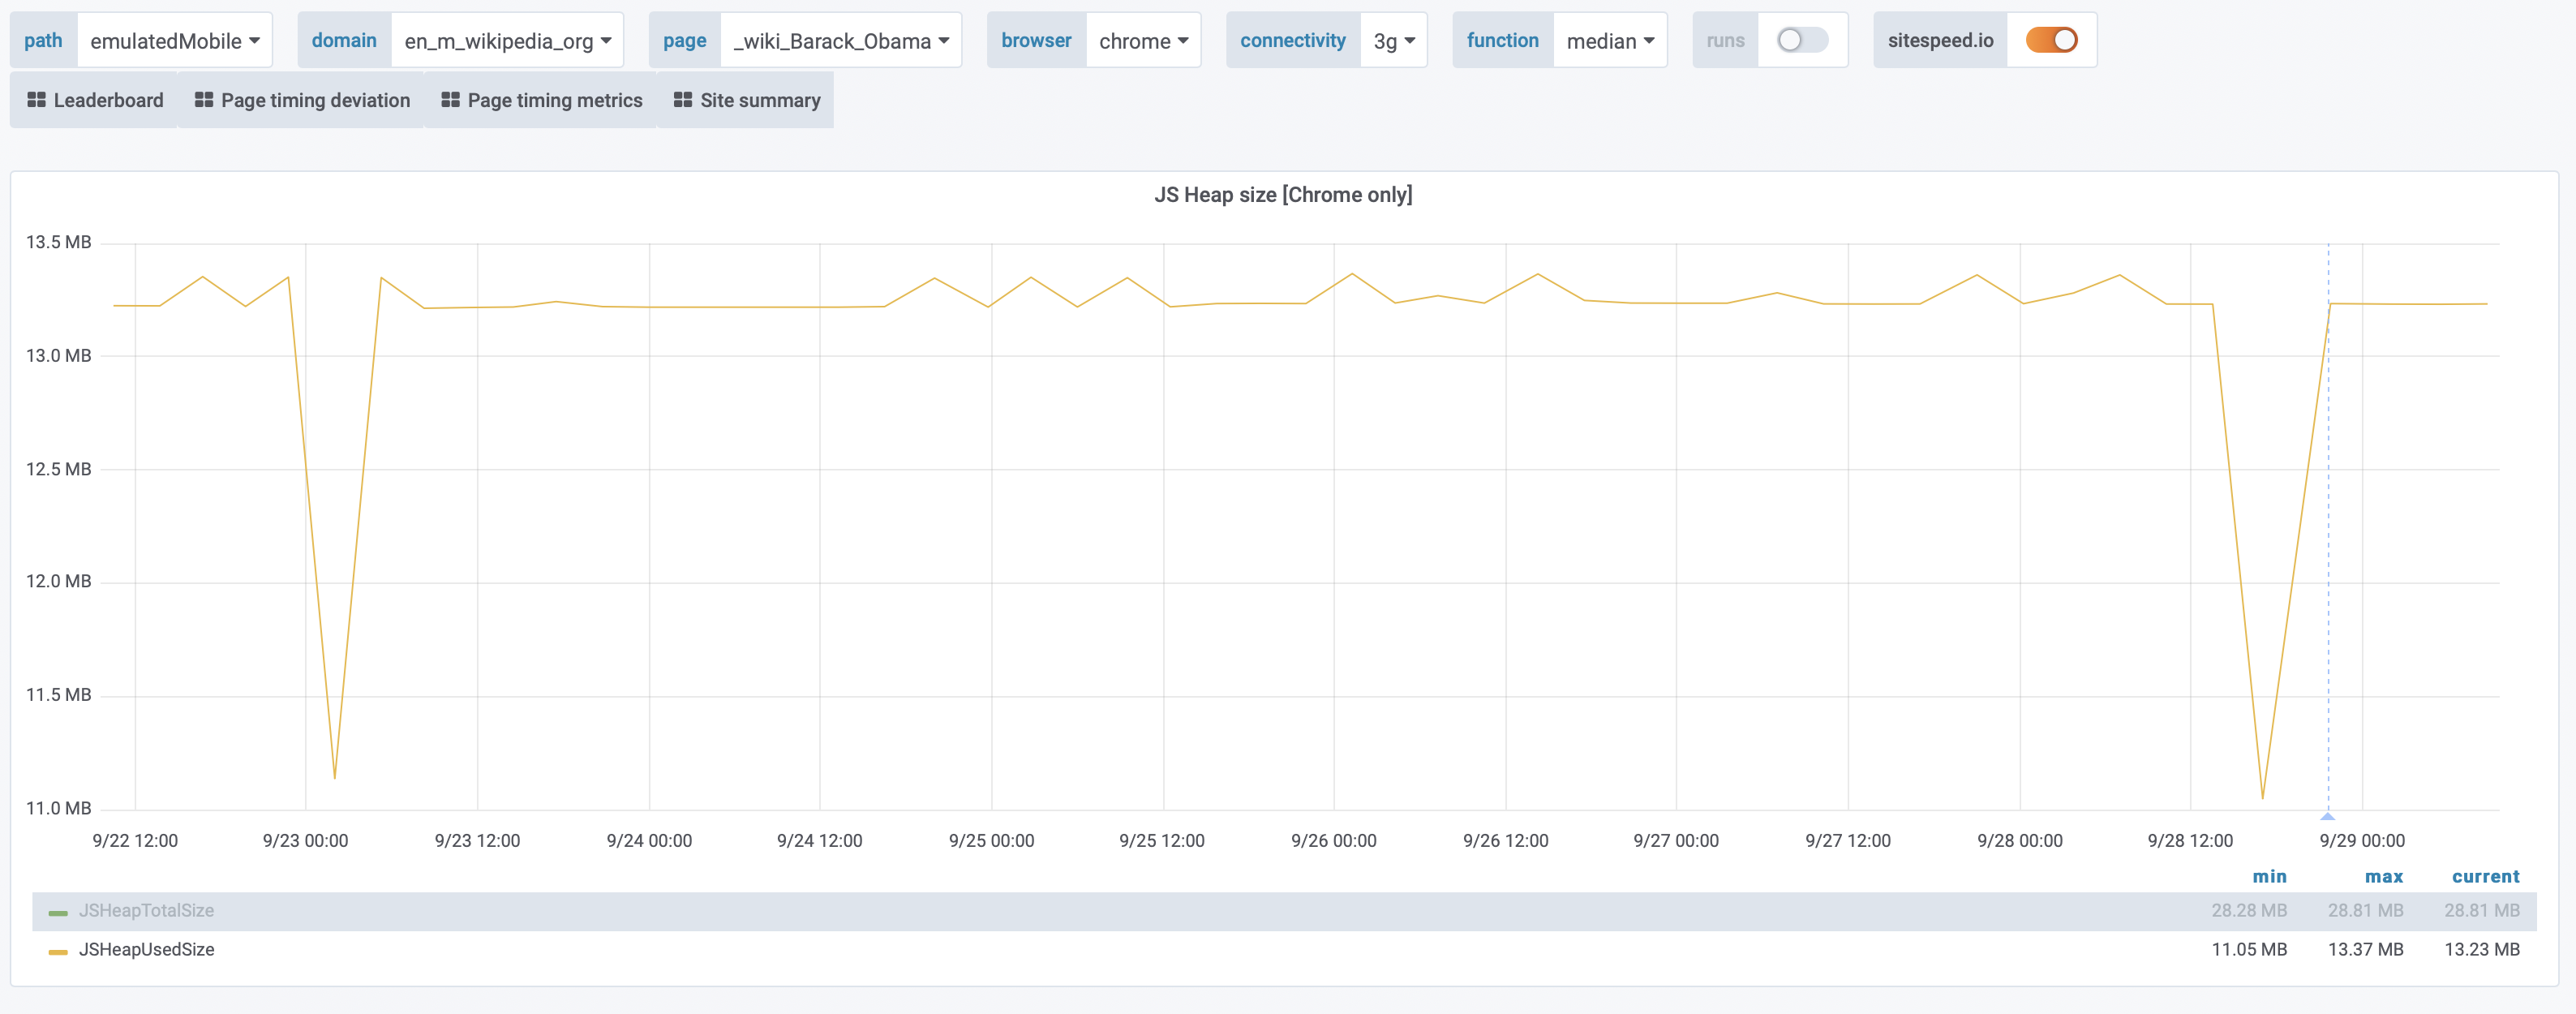
It's been emphasised by both Apple and Google developers at various conferences that mobile devices have limited memory and that the individual app (or web site) plays a big role in that.

For websites there is of course also non-trivial amounts of memory used by the browser itself which we don't control, but especially on low-end devices with 1-2 GB of ram, a tab using 10-20 MB less memory could make the difference between swapping and not swapping, or even freezing other tabs altogether.

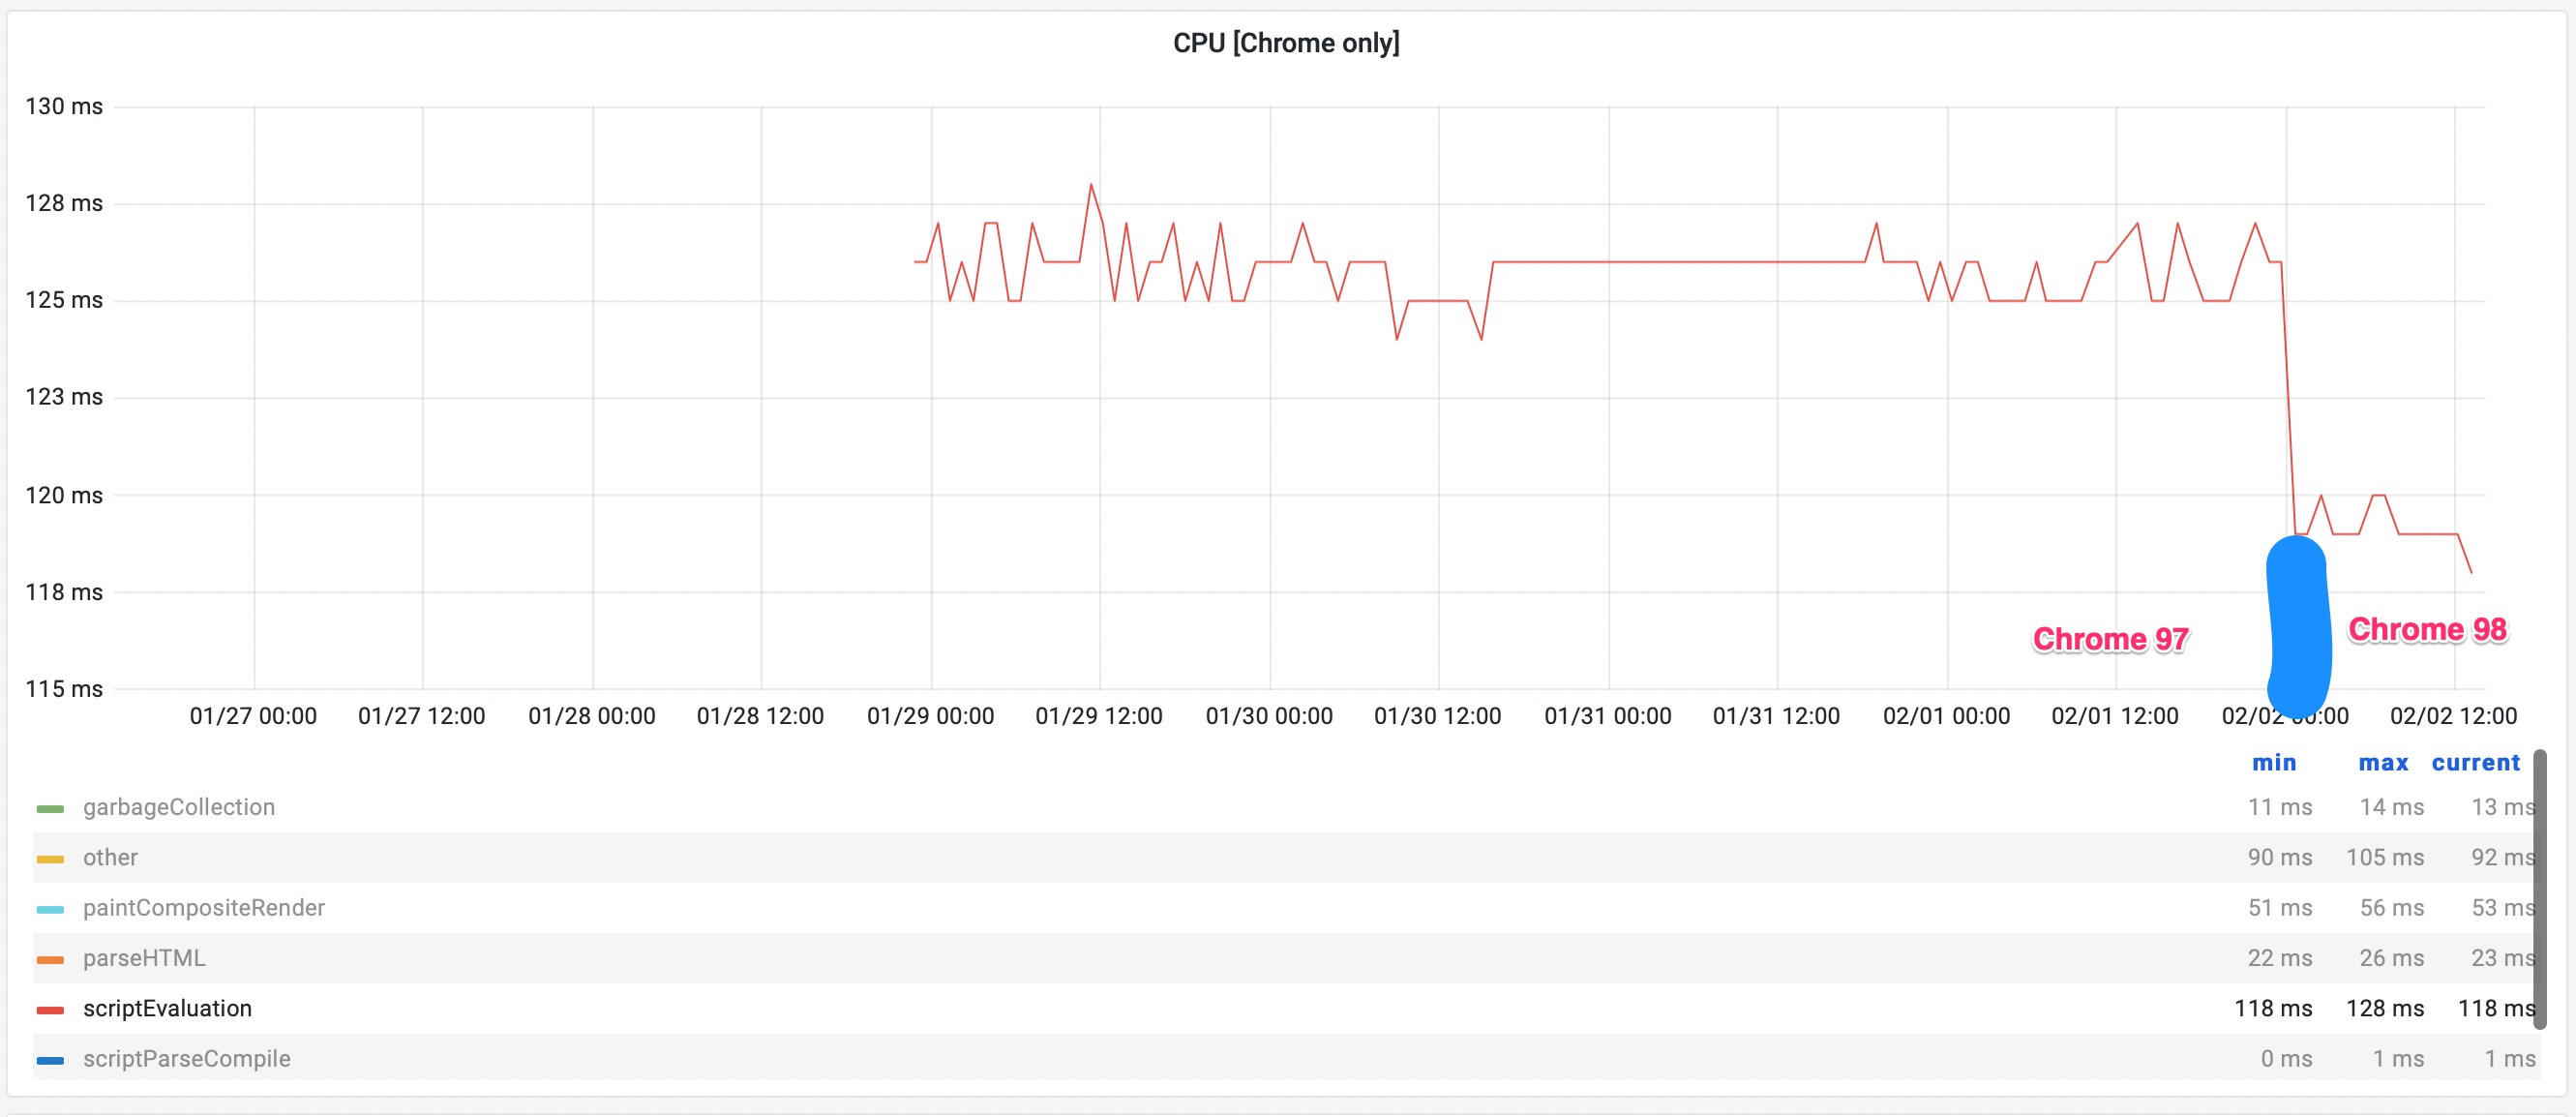
CPUs are getting better and better, but "memory is becoming the new bottle neck"

Related material:

Event Timeline

Restricted Application added a subscriber: Aklapper. · View Herald Transcript

So we should be able to use Chrome devtools protocol to get that, there we have JSHeapUsedSize and .JSHeapTotalSize. Or what do you think @Krinkle ?

I was thinking about window.performance.memory, but that's only because I'm not very familiar with all the great stuff the devtools protocol offers. Probably better indeed. Nice!

I've been tracking JSHeap for a while (but I haven't looked at it) and it looks like it will hard to use to see any changes because the metrics is going up and down. Here's two examples one for mobile and one desktop and I guess if we do a change it needs to big for us to see it.

Screenshot 2019-09-29 at 10.01.02.png (1×3 px, 609 KB)

Screenshot 2019-09-29 at 10.01.40.png (1×3 px, 646 KB)

This is collected when the page has finished loading. But it could also be less noisy for fresnel running on pages with less content?

I wonder if we need something like https://github.com/paulirish/memory-stats.js and measure more over a user journey or something like that?

Krinkle triaged this task as Medium priority.Jan 31 2022, 10:37 PM

Something like this would've been useful during the various improvements @DannyS712 and I were doing over the past year in mw.loader. Without it, it wasn't worth it I found to measure it locally every time and with multiple runs.

I ran into it again today as part of https://gerrit.wikimedia.org/r/c/mediawiki/core/+/758549/ which I suspect may reduce the memory size a bit more in the registry, but again takes a fair amount of effort to confirm and seems useful to try to incorporate if it's stable.

I suspect it will be more stable than in our synthetic test given that we have a relatively simple install in CI is, and its a very local fast, and we use Headless Chrome. (And still multiple runs.)

I suspect it will be more stable than in our synthetic test given that we have a relatively simple install in CI

I don't think the tool will matter, I think for all our measurements should run the tests on dedicated hardware, I think that is the crowd-pleaser we are looking for with all our measurements. I looked at dedicated Mac mini m1 and the metric look better but I'm not sure exactly how Chrome handles it internally:

Screenshot 2022-02-02 at 14.00.03.png (752×2 px, 598 KB)

We could also use the raw Chrome trace log. We do that today and on a dedicated machine the numbers looks good:

chrome-tracelog.jpg (1×2 px, 234 KB)

There's a dip in time spent evaluating scripts between 97 and 98 so maybe 98 is faster. However all events in the trace log is categorised by me so for example if the Chrome team invent a new event, it is not categorised automatically. This is one of the things I've asked the Chrome team to provide but no luck so far.

There's also a new thing in Firefox that the Mozilla performance team added memoryReport , I know they use it in their tests but I haven't tried it so much, You get data from memory usage in the main process but its low level and I'm not sure how usable it would be for us.