Page MenuHomePhabricator

Get rough stats for time taken to resolve a case from CU log
Closed, ResolvedPublic2 Estimated Story Points

Description

For the purposes of measuring our impact on reducing CheckUser investigation times, let's get some numbers for the existing time taken to resolve a case.

As a rough approximation, for cases in the CU log -

  • checked by the same user (actor)
  • having the same "reason" field string

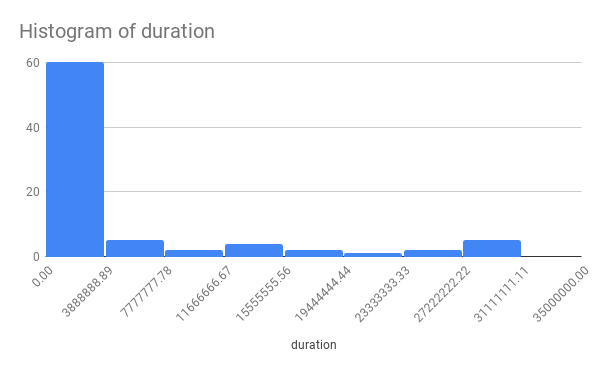
Compute the "time taken" by subtracting the last instance timestamp from the first instance timestamp it appears in the log in chronological order.

Generate an average of the time taken to resolve cases over the last 1 year of logs for the following wikis (from T236279):

  • eswiki
  • zhwiki
  • fawiki
  • enwiki
  • ukwiki
  • viwiki
  • commons
  • enwikibooks

image.png (1×1 px, 754 KB)

Event Timeline

Niharika triaged this task as Medium priority.Oct 3 2019, 6:13 PM
Niharika created this task.
Niharika created this object with visibility "Subscribers".
Niharika added a project: CheckUser.

I'd include a couple of wikis that a) have local checkusers but b) don't perform too many actions. That way, we'd make sure the understand also how those who use the tools less often understand them.

(Thing to watch out for: when the most active local checkuser(s) also is a steward.)

I'd include a couple of wikis that a) have local checkusers but b) don't perform too many actions. That way, we'd make sure the understand also how those who use the tools less often understand them.

(Thing to watch out for: when the most active local checkuser(s) also is a steward.)

Do you have any wikis in mind with that criteria?

Not off the top of my head – not without investigating.

(I'll investigate.)

Thanks @Johan. I can create another task to track the investigation work, if that is helpful.

(I'll investigate.)

Thanks @Johan. I can create another task to track the investigation work, if that is helpful.

Sure. (:

One way to output this data would be as a histogram with the average time per month and per wiki. It might be helpful if we see big shifts in the average time, maybe a policy or procedure changed on a given wiki. Or, even more interesting, maybe the tool changed somehow.

I think that'd give us more insight than a single average amount of time across an entire year.

For future reference, and to check my work, here is the SQL query that was run:

SELECT
    AVG(x.duration) AS average
FROM (
    SELECT
        TO_SECONDS(MAX(cul_timestamp)) - TO_SECONDS(MIN(cul_timestamp)) AS duration
    FROM cu_log
    WHERE STR_TO_DATE(cul_timestamp, '%Y%m%d%H%i%S') > DATE_SUB(NOW(), INTERVAL 1 YEAR)
    GROUP BY cul_user, cul_reason
    HAVING COUNT(cul_id) > 1
    ORDER BY cul_timestamp
) x;

Here are the results:

wikiduration (seconds)duration (humanized)
eswiki4663257.35372 months
zhwiki168909.71912 days
fawiki1415115.197416 days
enwiki624309.79847 days
ukwiki1158839.466713 days
viwiki7176.75002 hours
commons992743.705611 days
enwikibooks2408788.8696a month
dbarratt changed the visibility from "Subscribers" to "Public (No Login Required)".Nov 14 2019, 7:53 PM

I think you are getting unreasonably high numbers here. There is no way we spent 16 days for a check on fawiki. The assumption of "same actor and same summary message" is a weak assumption.

I had a very similar reaction to the data. I made this point when we first talking about this task. I think this is an initial pass at the data and probably gives us a sense of the upper bounds of what's possible but isn't actually realistic.

I think we can take a closer look at the actual data in these rows and see if there's another way to slice it to identify some patterns.

I think we can take a closer look at the actual data in these rows and see if there's another way to slice it to identify some patterns.

Would you like a list of the duration (i.e. the data from which the average is calculated)? If so, from which wikis? (or all?)

I could create a graph as you suggested earlier, that might reveal more insights.

I could create a graph as you suggested earlier, that might reveal more insights.

That could be cool.

I was thinking that maybe we could just snag a few rows from a single user and see what other delineations there are. I would not post that data in Phab but we can look at it elsewhere. We could maybe identify something that helps us know the start and end of a given case.

I ran this query on eswiki:

SELECT
  TO_SECONDS(MAX(cul_timestamp)) - TO_SECONDS(MIN(cul_timestamp)) AS duration
FROM cu_log
WHERE STR_TO_DATE(cul_timestamp, '%Y%m%d%H%i%S') > DATE_SUB(NOW(), INTERVAL 1 YEAR)
GROUP BY cul_user, cul_reason
HAVING COUNT(cul_id) > 1
ORDER BY cul_timestamp
NOTE: This excludes results where there was only a single entry, because the value for duration would be 0

which had 82 results. I threw the results into Google Sheets and this is the histogram it came up with:

Histogram of duration.png (371×600 px, 8 KB)

of the 82, there are 46 that are under 1,000 seconds
of the 82, there are 32 that are under 100 seconds

To me, this doesn't mean anything… the “cases” at the high end might be checkusers using the same reason more than once and the cases at the low end might be checkusers changing the reason for each lookup of the same case.

As @aezell pointed out, this doesn't appear to be a reliable proxy and a more manual analysis would have to be performed.

However, at that point, it might be faster to simply ask checkusers to time themselves. :)