Page MenuHomePhabricator

Update TwoColConflict Grafana board for being a default feature
Closed, ResolvedPublic5 Estimated Story Points

Description

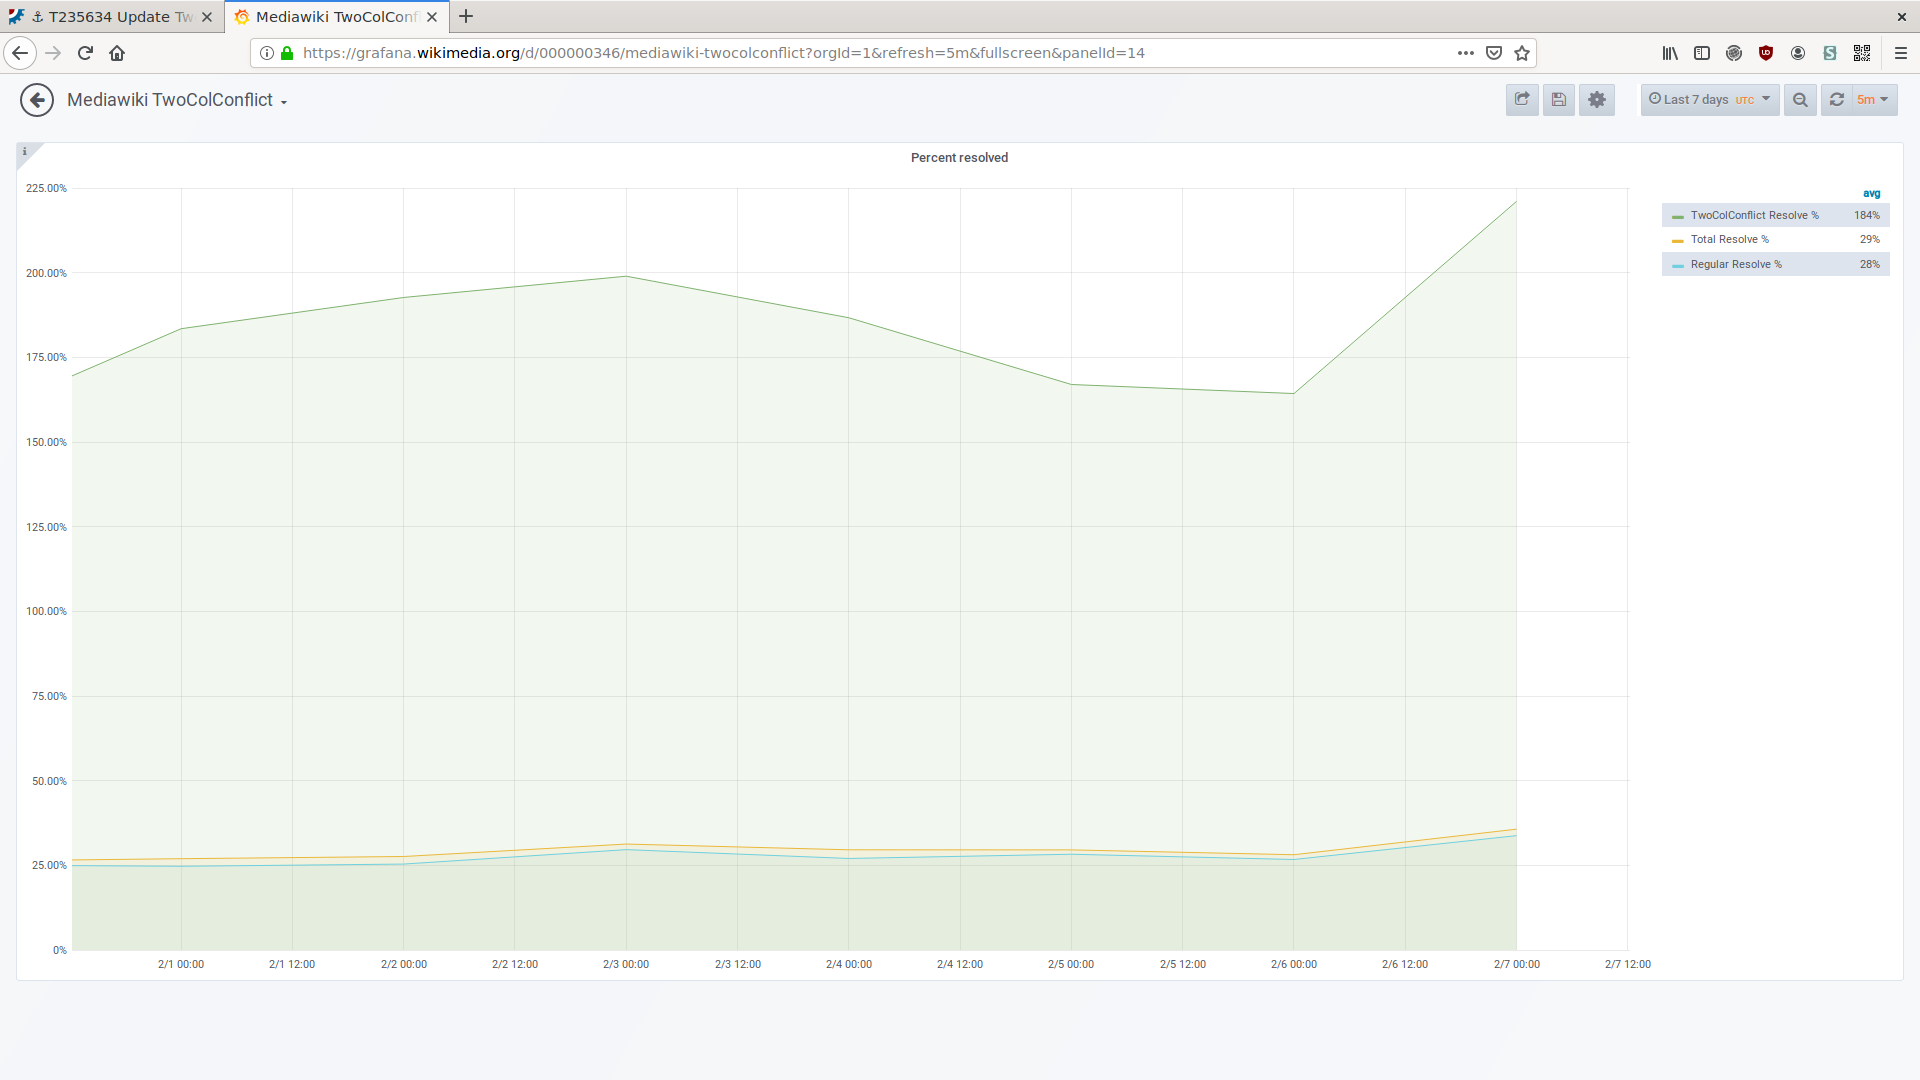
Update the Grafana board https://grafana.wikimedia.org/d/000000346/mediawiki-twocolconflict to be ready for monitoring when Two-Column-Edit-Conflict-Merge goes default. Most important:

  • What percentage of resolved conflicts were fixed through the new interface?
  • Ideally: What was the percentage per edit count basket.
  • Some of the graphs contain a FIXME: check if we still need them and fix them or remove them from the dashboard.
  • Rename the core / "default" workflow panels to "legacy"
  • Averages should not include null (missing) data points, for example when some groups haven't experienced any conflicts.

Possibly use the numbers from https://grafana.wikimedia.org/d/000000213/mediawiki-edit-conflicts.

Event Timeline

Restricted Application added a subscriber: Aklapper. · View Herald Transcript
WMDE-Fisch set the point value for this task to 5.Jan 21 2020, 12:47 PM

We believe it makes sense to keep both metrics alive for some time, even the feature is default, just to make sure the "old numbers" go down (more specifically: the old and new numbers should be the same then).

awight updated the task description. (Show Details)
awight moved this task from Sprint Backlog to Doing on the WMDE-QWERTY-Sprint-2020-02-04 board.

@thiemowmde I'm hoping to clarify "How many percents of the conflicts were fixed through the interface?": Does this mean, "What percent of all conflicts resolved were performed through the new interface?" (Easy but we don't have this graph yet.), or "How many of the conflicts merged using the new interface were successfully resolved?" (Does have a graph.)

Update: I made the panel anyway, it seems useful.

An observation from the code: TwoColConflict refers to the conflict count as "pageloads", which sounds like a qualitatively different number than the core conflict count, however they use the same code paths and are therefore directly comparable. In other words, the graphs should be correct.

Also, my previous question has been answered, we only need the "how many conflicts are resolved" panels, rather than the "share of conflicts through each interface".

One of the graphs is giving me trouble, showing "184%" resolved among other badness:

image.png (1×1 px, 121 KB)

awight moved this task from Doing to Demo on the WMDE-QWERTY-Sprint-2020-02-04 board.

The "Percent resolved" graph bounces around, in nonsensicals ways such as TwoCol Resolved percent dropping from 40% to 10% only when another of the hidden lines is toggled. Line visibility is completely unrelated to the numbers, so I'm assuming something is wrong with Grafana or Graphite, rather than this being a problem with our graph.

Averages should not include null (missing) data points, for example when some groups haven't experienced any conflicts.

The data points were correctly "null", but the client-side average were calculated incorrectly. I found a bug https://github.com/grafana/grafana/issues/3244 which explains that choosing any of the null handling options other than "null as zero" results in a correct average. It makes the graphs look strange, but that's sort of a good thing since it exposes that we have missing data.

thiemowmde moved this task from Demo to Done on the WMDE-QWERTY-Sprint-2020-02-04 board.