Page MenuHomePhabricator

Feedback on new alert setup
Closed, ResolvedPublic

Description

I've started to setup alerts for the new setup. We have one alerts setup for enwiki and I want you @Gilles @Krinkle @aaron to check it first before I start to add more wikis:

https://grafana.wikimedia.org/d/2kP3FjAZk/webpagereplay-enwiki-alerts

At the moment we use a large moving average window (6h) but when I deploy to more servers we can make that smaller.

I'm thinking like this: we have one alert dashboard page per wiki. In this example we have alerts for Firefox and Chrome on Desktop and emulated mobile for Chrome. This means I will create one page per wiki.

To jump to drill down (more info per URL), each dashboard could have a link like this:

Screen Shot 2019-11-04 at 8.20.24 PM.png (956×1 px, 276 KB)

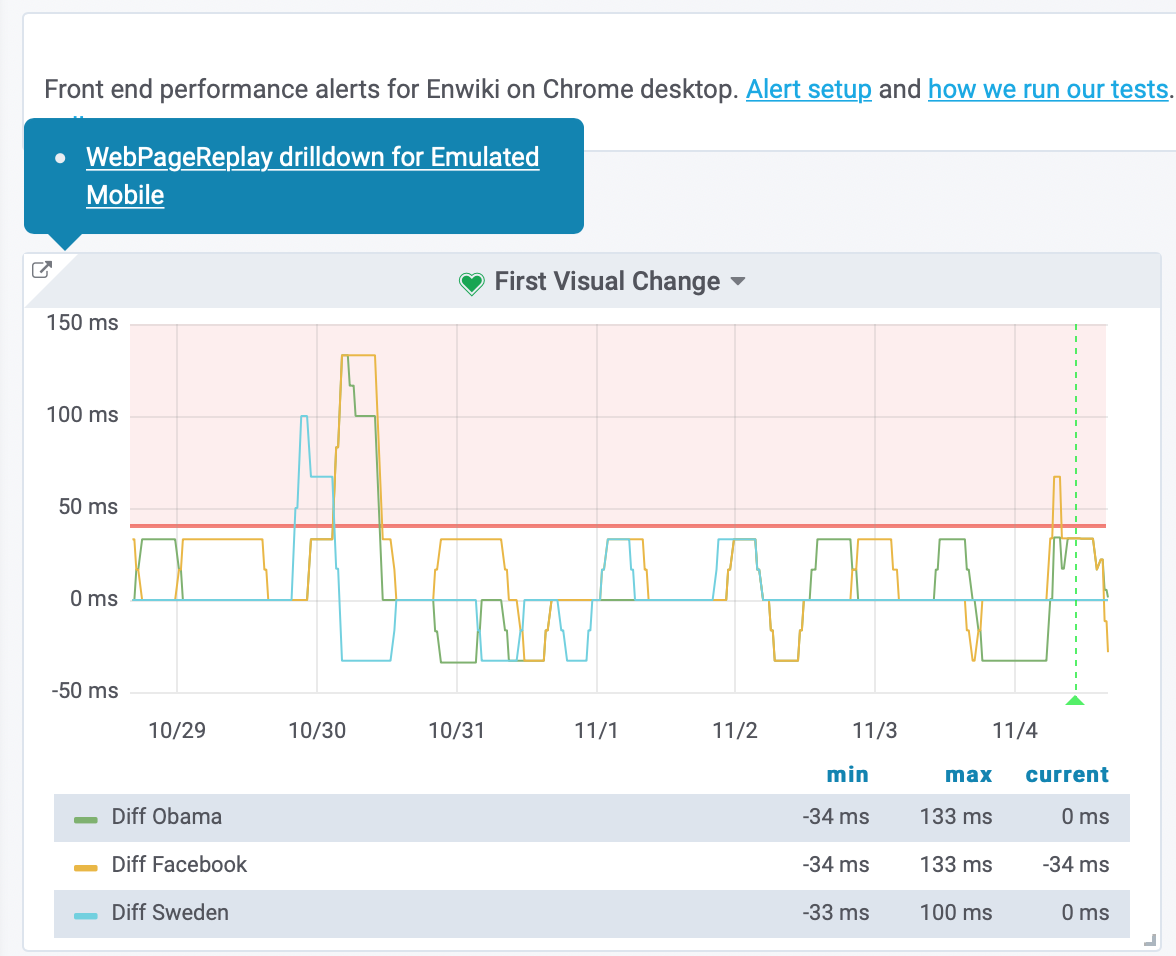
Or is it a better way to do it? When you jump to drill down you can use the annotations to see screenshot etc.

Event Timeline

Change 549098 had a related patch set uploaded (by Phedenskog; owner: Phedenskog):
[operations/puppet@production] Grafana alert for WebPageReplay enwiki tests

https://gerrit.wikimedia.org/r/549098

Change 549098 merged by Filippo Giunchedi:
[operations/puppet@production] Grafana alert for WebPageReplay enwiki tests

https://gerrit.wikimedia.org/r/549098

This change is causing this Icinga alert:
https://icinga.wikimedia.org/cgi-bin/icinga/extinfo.cgi?type=2&host=icinga1001&service=webpagereplay-enwiki-alerts+grafana+alert

UNKNOWN: failed to fetch info about dashboard with uid=000000748 due to exception: HTTP Error 404: Not Found

Interesting. It seems to work in the annotations API, e.g. https://grafana.wikimedia.org/api/annotations?dashboardId=748 returns … "Enwiki Firefox - First Visual Change alert", ….

Which endpoint is the Icinga query hitting?

@Krinkle I created a new dashboard and missed update Icinga.

Peter claimed this task.

Feedback received at the offsite.