https://grafana.wikimedia.org/d/000000107/job-queue-health (deprecated)
and
https://grafana.wikimedia.org/d/000000400/jobqueue-eventbus (considered canonical)
Are showing N/A insert rates:
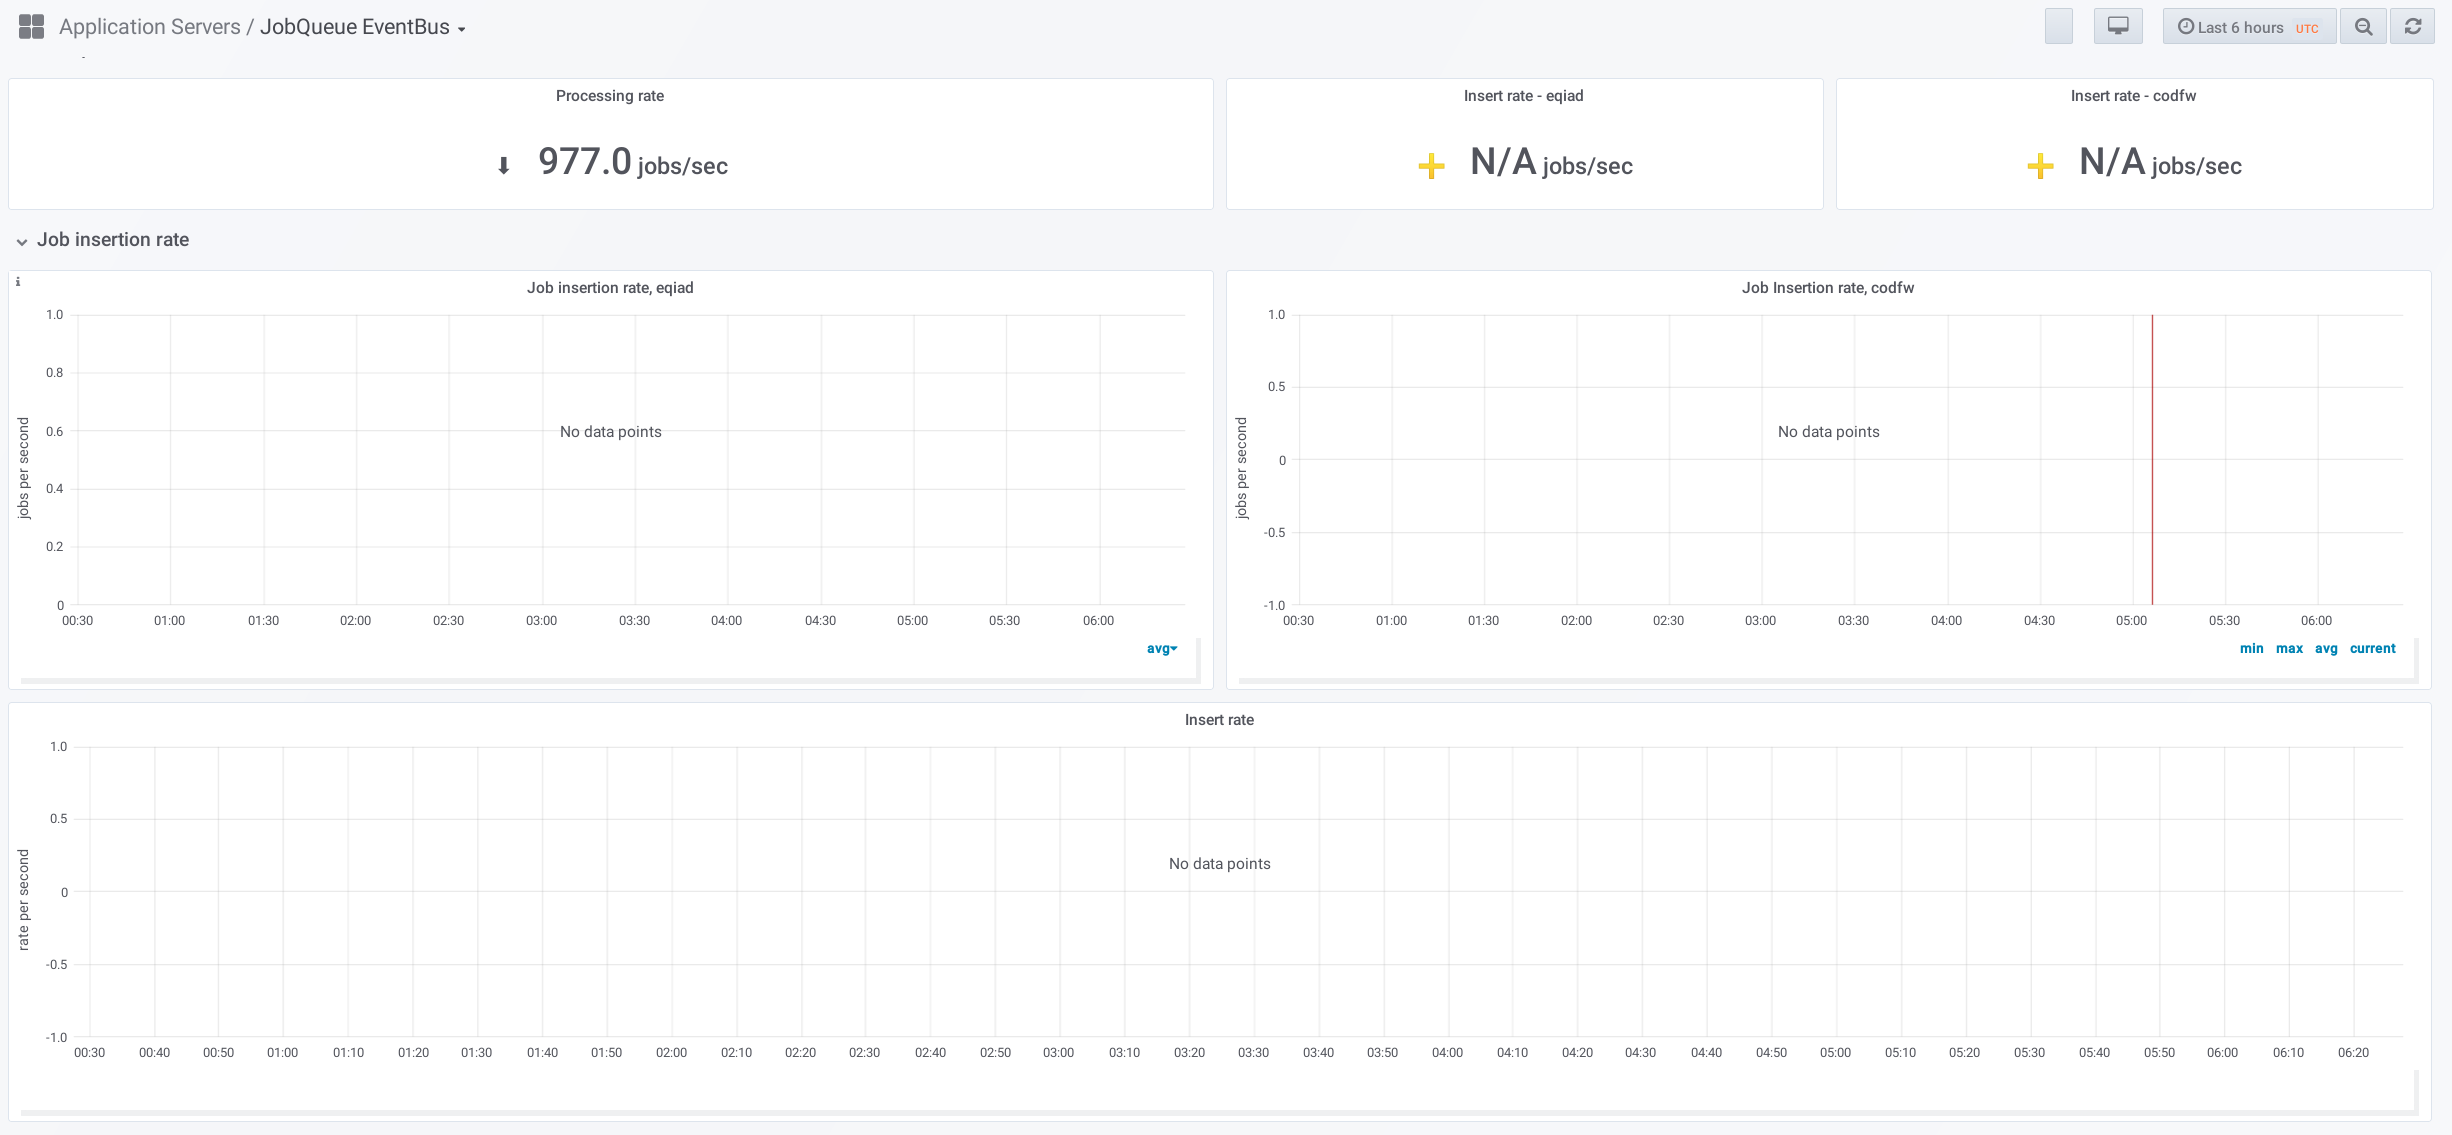
All other metrics, including processing rate seem to be ok. Not sure if a dashboard or prometheus issue. Seems like a metric important enough to report a bug against.