Page MenuHomePhabricator

Add retention trend line to SE reporting
Closed, ResolvedPublic

Description

We're about to release SE v3 to beta imminently, and prod hopefully end this week.

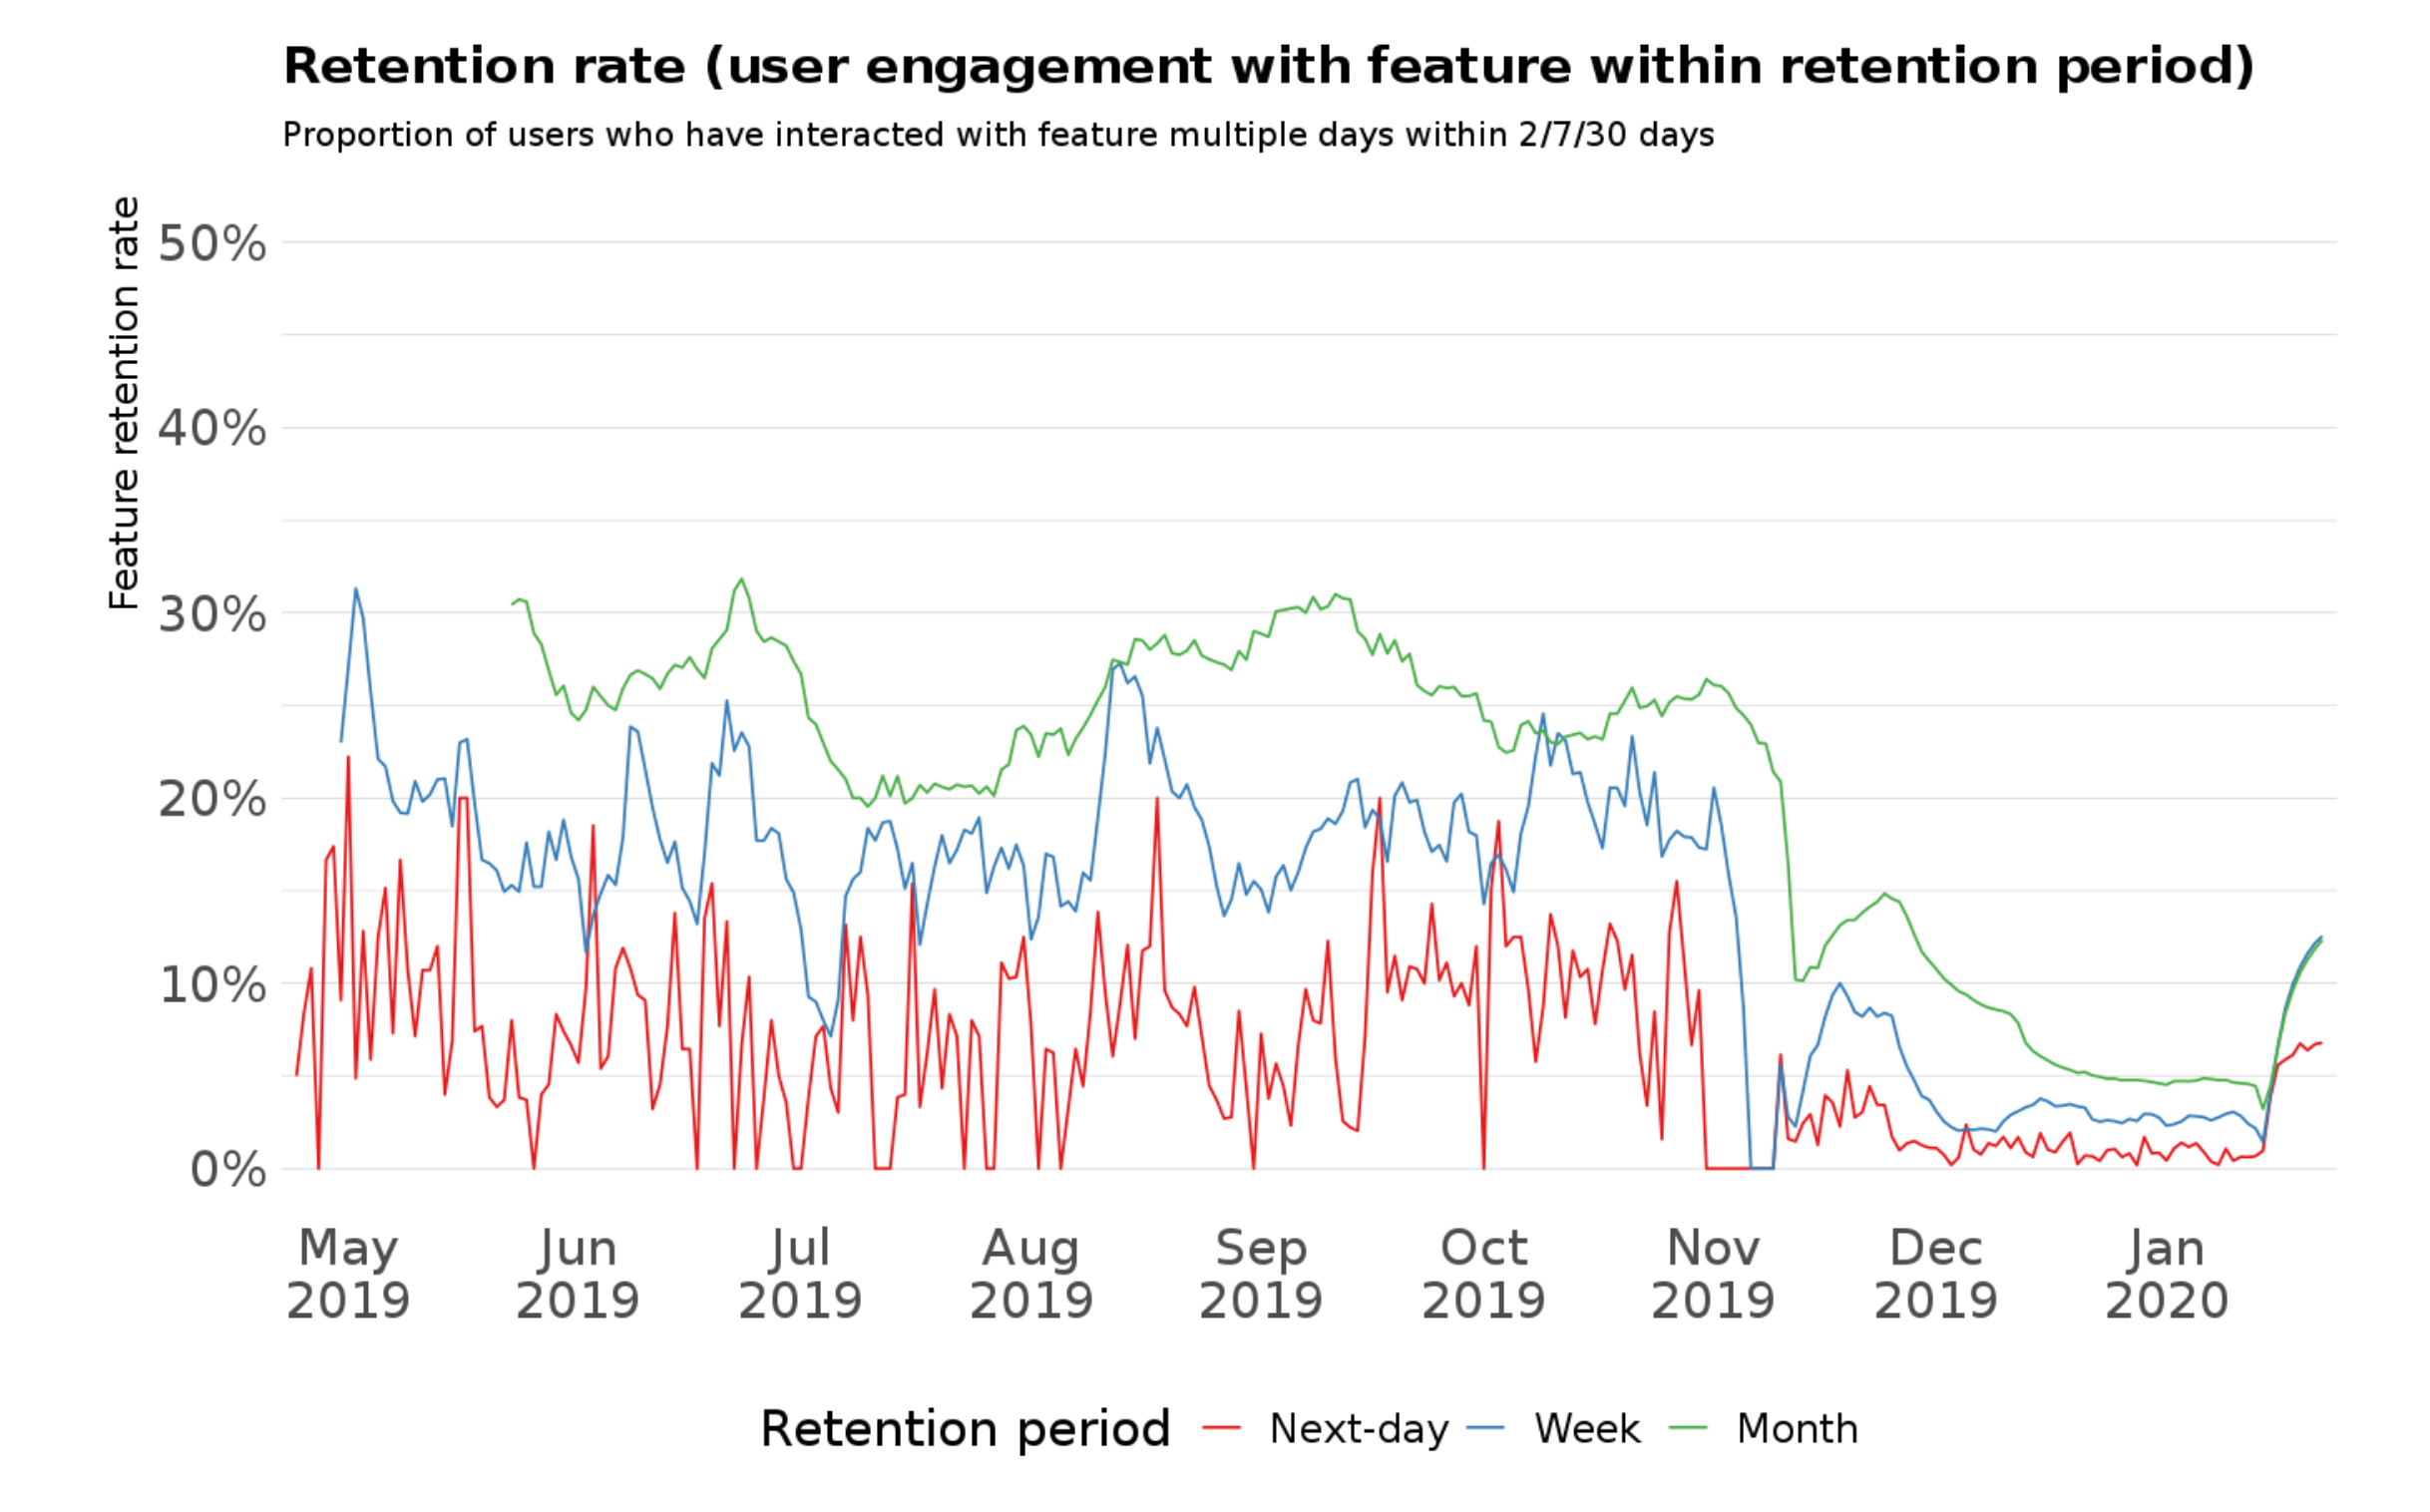
The changes don't include a new edit type, so there's nothing to update on the existing graphs, but the point of the release is to increase editor retention. We have a graph with the rate (at the bottom here), but could we please have a trendline of next-day and 7-day retention rate?

Eventually we would like a comparison of 2nd month retention to match the global reporting, but that can wait.

Event Timeline

LGoto triaged this task as Medium priority.Nov 26 2019, 5:41 PM
LGoto moved this task from Triage to Backlog on the Product-Analytics board.
mpopov moved this task from Backlog to Kanban on the Product-Analytics board.
mpopov edited projects, added Product-Analytics (Kanban); removed Product-Analytics.
mpopov subscribed.

I have added a chart of retention rates over time while making necessary updates to the report before handing it off to Shay:

Screen Shot 2020-01-24 at 11.40.50 AM.png (1×2 px, 779 KB)

Thanks - do we know why there's a drop from November onward? Is it due to
the quarter change?

Thanks - do we know why there's a drop from November onward? Is it due to
the quarter change?

I believe that's from the bug that broke SE analytics for a few weeks, which will need to be noted in the report.

Done and absence of data noted where needed