Page MenuHomePhabricator

Sporadic RST drops in the ulogd logs
Open, MediumPublic

Description

The following pattern is showing up in the ulogd logs, we see this on the puppetmaster front ends but alos on other services that proxy connections

Nov 21 11:26:36 puppetmaster1001 ulogd[23236]: [fw-in-drop] IN=eno1 OUT= MAC=18:66:da:63:3d:08:d0:94:66:5e:c8:02:86:dd SRC=2620:0:861:102:10:64:16:36 DST=2620:0:861:102:10:64:16:73 LEN=60 TC=0 HOPLIMIT=64 FLOWLBL=43734 PROTO=TCP SPT=8141 DPT=58242 SEQ=902339402 ACK=0 WINDOW=0 RST URGP=0 MARK=0

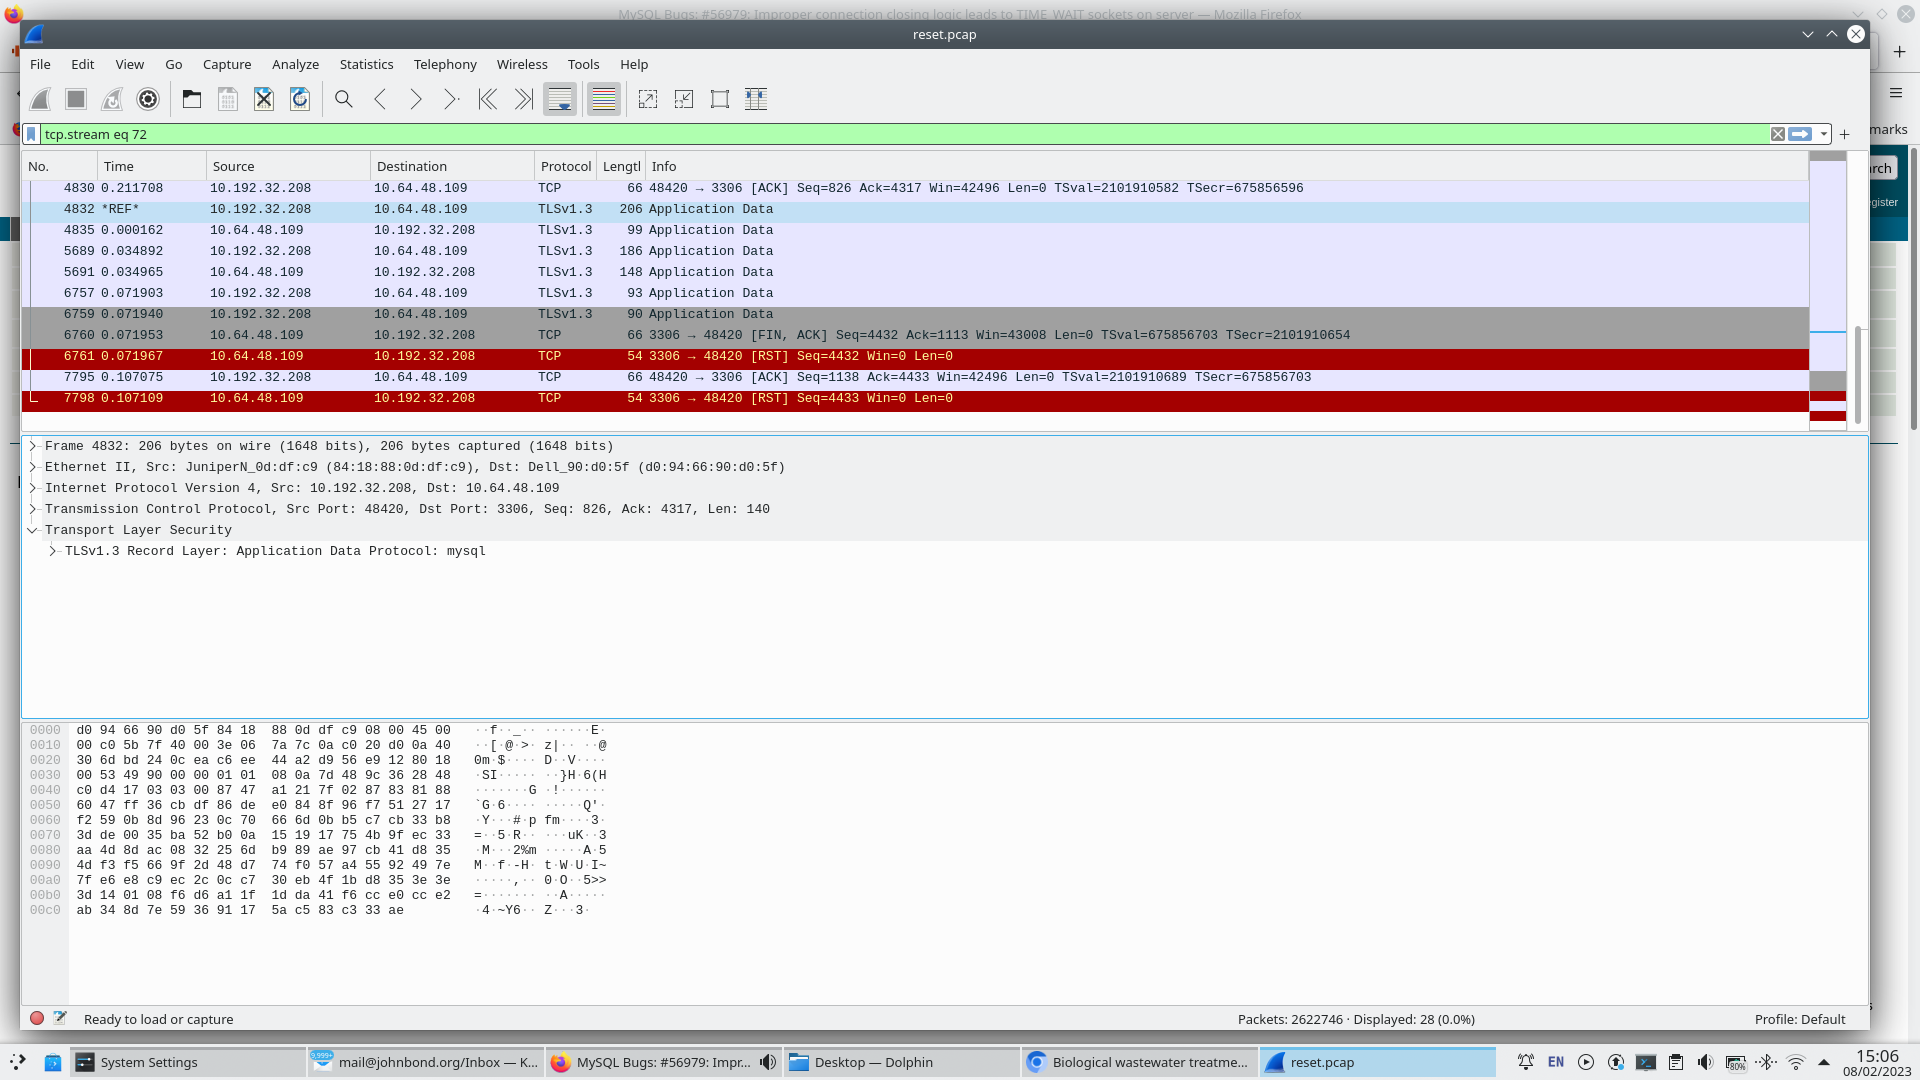
I was able to capture an example TCP stream eliciting this behaviour

1   5.867945 2620:0:861:102:10:64:16:73 → 2620:0:861:107:10:64:48:45 TCP 88 56264 → 8141 [FIN, ACK] Seq=1 Ack=1 Win=358 Len=0 TSval=1115703533 TSecr=3512519644
2   5.867982 2620:0:861:107:10:64:48:45 → 2620:0:861:102:10:64:16:73 TCP 76 8141 → 56264 [RST] Seq=1 Win=0 Len=0

This signature appears to be the result of a tcp half-duplex termination as per rfc1122 section 4.2.2.13 specificly:

A host MAY implement a "half-duplex" TCP close sequence, so
that an application that has called CLOSE cannot continue to
read data from the connection. If such a host issues a
CLOSE call while received data is still pending in TCP, or
if new data is received after CLOSE is called, its TCP
SHOULD send a RST to show that data was lost.

This sounds to me that the front end (puppetmaster1001) is closing a connection to the backend (puppetmaster1002) premultiply i.e. the backed still expected to send more data. As such the backed sends RST to indicate its not happy

I believe this is only happening over IPv6

Event Timeline

Could be totally different but with @jijiki we 've seen this behavior elsewhere as well. The latest installment is T238789. Per that logstash dashboard, it's the mediawiki's that send the RST to the echostore.

The case we were looking into with @jijiki a few weeks ago involved the nginx proxies that would forward the traffic to search from mediawiki. I can't find the packet dumps right now but what I recall is the TLS session being terminated and then the connection being closed with the other end sending back the RST that gets logged. This probably has been unearthed relatively recently but has been happening for a long time.

I believe this is only happening over IPv6

In both of the cases above it was IPv4.

jbond triaged this task as Medium priority.Nov 26 2019, 11:53 AM

Could be totally different but with @jijiki we 've seen this behavior elsewhere as well. The latest installment is T238789. Per that logstash dashboard, it's the mediawiki's that send the RST to the echostore.

Looking at the task description this could just be a missing iptables rule, its not clear if traffic flows and is accepted along this path under normal circumstances?

The case we were looking into with @jijiki a few weeks ago involved the nginx proxies that would forward the traffic to search from mediawiki. I can't find the packet dumps right now but what I recall is the TLS session being terminated and then the connection being closed with the other end sending back the RST that gets logged.

Yes this (assuming this is T249700) sounds very similar. Also worth noting its not really causing a problem other then logs. we could change the logging rules so we don't log RST's from internal networks however it would be nice to find a toggle to fix the issue though

This probably has been unearthed relatively recently but has been happening for a long time.

Yes i expect its always been there but only recently been logged and even more recently had people looking at the logs

I believe this is only happening over IPv6

In both of the cases above it was IPv4.

ack thanks, i believe kubernetes pods are ipv4 only? further the puppematser hosts prefer ipv6. which is probably why we see this pattern and IP version can IMO be ignored as a contributing factor

Could be totally different but with @jijiki we 've seen this behavior elsewhere as well. The latest installment is T238789. Per that logstash dashboard, it's the mediawiki's that send the RST to the echostore.

Looking at the task description this could just be a missing iptables rule, its not clear if traffic flows and is accepted along this path under normal circumstances?

Yes, it seems like 1 extraneous RST is only being logged.

The case we were looking into with @jijiki a few weeks ago involved the nginx proxies that would forward the traffic to search from mediawiki. I can't find the packet dumps right now but what I recall is the TLS session being terminated and then the connection being closed with the other end sending back the RST that gets logged.

Yes this (assuming this is T249700 sounds very similar. Also worth noting its not really causing a problem other then logs. we could change the logging rules so we don't log RST's from internal networks however it would be nice to find a toggle to fix the issue though

Agreed.

This probably has been unearthed relatively recently but has been happening for a long time.

Yes i expect its always been there but only recently been logged and even more recently had people looking at the logs

I believe this is only happening over IPv6

In both of the cases above it was IPv4.

ack thanks, i believe kubernetes pods are ipv4 only? further the puppematser hosts prefer ipv6. which is probably why we see this pattern and IP version can IMO be ignored as a contributing factor

No, the pods have IPv6 addresses as well, even if we are addressing them only over IPv4 (this is mostly due to how the Service resources in kubernetes is currently implemented. There are plans and commits upstream to fix that, albeit it's slow and I haven't looked yet in to what the situation is at e.g. 1.18). But I fully agree that the IP version can be ignored as a contributing factor.

Nemo_bis renamed this task from Sporatic RST drops in the ulogd logs to Sporadic RST drops in the ulogd logs.May 24 2021, 7:47 AM

Thanks to o11y help, the dashboard is now much more usable.

Most of the traffic dropped in iptables are RST packets, so it's now more than sporadic, see https://logstash.wikimedia.org/goto/4abeedb79fbb6ce17c12c884e60d7d3d
And all of it are generated on k8s nodes so T249700: k8s/mw: traffic to eventgate dropped by iptables is still relevant.

One observation from the dashboard is that the RST's aren't very "sporadic" (as per title of this task). They seem fairly evenly distributed over time and consistent. So looks like regular behaviour rather than occasional anomalies.

I've seen this half-duplex close quite often down through the years. Some firewalls do it when they see a FIN for example. I assume it's people trying to avoid having too many connections in TIME-WAIT, perhaps as an anti DOS measure. Not sure why we are experiencing it here though.

I've seen this half-duplex close quite often down through the years. Some firewalls do it when they see a FIN for example. I assume it's people trying to avoid having too many connections in TIME-WAIT, perhaps as an anti DOS measure. Not sure why we are experiencing it here though.

i took a quick look at one of the db server (db1136) as mysql seems to be sending a lot of theses resets (with a different pattern to the original post) and looking at capture i would agree that this is probably some tc fast close optimisation going on as we get

  • mysql send fin/ack to mw server
  • mysql quickly sends RST/ACK (with same seq as above)
  • mediawiki responds with ack assumedly to the first fin/ack
  • mysql sends a rst to the above (now unsolicited) ack

image.png (1×1 px, 290 KB)

however i couldn't find any sysctl or mysql config that could control this behaviour

i took a quick look at one of the db server (db1136) as mysql seems to be sending a lot of theses resets (with a different pattern to the original post) and looking at capture i would agree that this is probably some tc fast close optimisation going on as we get

  • mysql send fin/ack to mw server
  • mysql quickly sends RST/ACK (with same seq as above)
  • mediawiki responds with ack assumedly to the first fin/ack
  • mysql sends a rst to the above (now unsolicited) ack

@Ladsgroup mentioned on irc that this pattern only happens for cross DC traffic suggesting that if the connection is in the same DC then the mediwiki server is able to ack the fin/ack before the server sends the RST packet and tears down the connection/state

FWIW, mw should not send this many cross-dc connections to databases but I assume it's a different aspect of this problem.