Page MenuHomePhabricator

Performance review of GrowthExperiments extension, Special:Homepage Suggested Edits module
Closed, ResolvedPublic

Description

Description

The Growth team has been working on a landing page for new users in our target wikis (Arabic, Czech, Korean and Vietnamese) over the past year. The landing page is Special:Homepage and it is described in detail here. This quarter, we have been working on a suggested edits module for the Special:Homepage. We are interested in a performance review specifically of the Suggested Edits module, which is the least performant of the modules that exist on Special:Homepage. Review of the Suggested Edits module might lead to broader points about the Special:Homepage module loading/rendering framework, so feedback is welcome there too.

High level summary of Suggested Edits:

  1. Each wiki has a configuration page (MediaWiki/NewcomerTasks.json, e.g. cs.wikipedia.org/wiki/MediaWiki:NewcomerTasks.json) which defines "task types" and the maintenance templates that are associated with these task types
  2. When a user visits Special:Homepage, on the client side we make an API query to ApiQueryGrowthTasks and ask for a set "tasks" (articles to edit) where those tasks have a task type that the user has selected (copyediting, adding links, etc). We use ApiQueryGrowthTasks as a generator, and also request information from the info, revisions, and pageimages modules (sample query: https://test.wikipedia.org/w/api.php?action=query&format=json&prop=info%7Crevisions%7Cpageimages&inprop=protection%7Curl&rvprop=ids&pithumbsize=260&generator=growthtasks&ggtlimit=250&ggttasktypes=references&formatversion=2&uselang=en
  3. The API module takes the request, loads the configuration from the MediaWiki/NewcomerTasks.json file, and queries ElasticSearch using hastemplate:{pipe-delimited-list-of-templates-for-that-tasktype. It returns page IDs associated with the search.
  4. Back on the client-side, our front-end code gets some more data from two more sources. From RESTBase it gets the text extract to display with the "Edit card" shown to the end-user and from Pageviews API it gets information about page views for that article.
Preview environment

In your user preferences, navigate to the bottom where it says "Newcomer homepage" and check the box for "Display newcomer homepage", and optionally "Default to newcomer homepage from username link in personal tools". Then either navigate to Special:Homepage or click your username (if you enabled "Default to newcomer homepage from username link in personal tools").

Which code to review

For front-end code:

  • modules/homepage/*.js
  • modules/homepage/suggestededits/*.js

For back-end code:

  • includes/HomepageModules/SuggestedEdits.php
  • includes/Specials/SpecialHomepage.php
  • includes/NewcomerTasks/*.php
  • includes/Api/ApiQueryGrowthTasks.php
Performance assessment

Please initiate the performance assessment by answering the below:

  • What work has been done to ensure the best possible performance of the feature?

We recently merged code to execute search and load the configuration within process rather than making an external HTTP request (T235717). This is not yet in production but it will be with wmf.10

  • What are likely to be the weak areas (e.g. bottlenecks) of the code in terms of performance?

There is no server-side rendering of the first card that a user sees (T236738). So there is a second or two where the user sees an empty box in suggested edits while 3 API queries are executed (T238171). The slowest one is for ApiQueryGrowthTasks; suggestions on optimizing that would be appreciated. For now we plan to do {T238231: Newcomer tasks: show skeleton screen while loading} but it would be nicer to just have the module load faster.

  • Are there potential optimisations that haven't been performed yet?

Server-side rendering of the initial card.

Would it make sense to have a single API query that's slower but already contains pageview and RESTBase text extract data? Or maybe that data should be put into the ElasticSearch index so that on the client-side we only need a single query to ApiQueryGrowthTasks to be able to construct the cards?

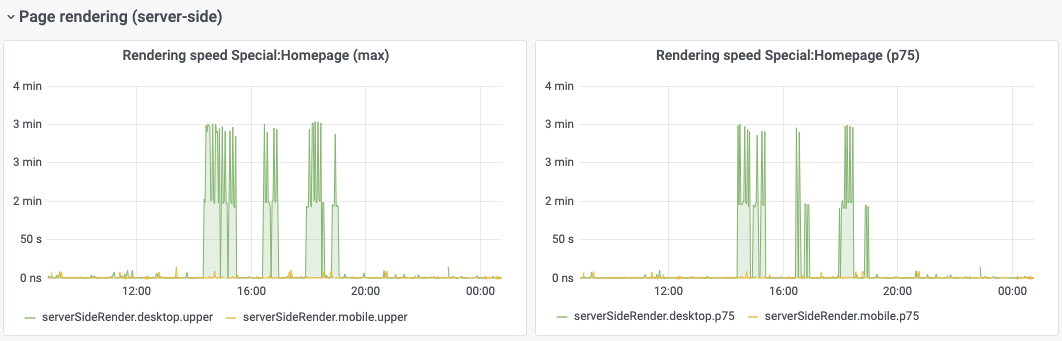
  • Please list which performance measurements are in place for the feature and/or what you've measured ad-hoc so far. If you are unsure what to measure, ask the Performance Team for advice: performance-team@wikimedia.org.

I looked at a profile on test.wikipedia.org and nothing jumped out. Once the in-process config is live T235717 things will probably look better.

Event Timeline

@Tgr @Catrope @marcella please feel free to update the task description or add comments here if you think I've missed something or you prefer a different focus for the performance review of Special:Homepage + Suggested Edits.

@Gilles since we seem to have a good idea of the main bottleneck (not having a server-side rendered initial task) and depending on your team's workload and other requests for performance reviews, please feel free to put this towards the bottom of your priority list.

Gilles triaged this task as Medium priority.Jan 6 2020, 1:17 PM

First off, aggregating the API requests into a single one would definitely be beneficial. The extra round-trips in the current setup are very expensive because of incompressible network latency.

Secondly, is this a feature only visible by logged-in users?

Also, it seems like this all starts from an ES search. How dynamic are the results? Don't most people have the default settings? If so, are they each doing a dynamic ES search every time the module is displayed? Do 2 users looking at the page around the same time with the same preferences see the same tasks? How important is it to direct different users to different tasks? (if at all)

How frequently do users visit that page, individually?

What I'm getting at is trying to get an understanding of the usage patterns in order to figure out the caching tradeoffs in regards to that feature.

Secondly, is this a feature only visible by logged-in users?

Yes, logged-in users only. (And specifically, we enable it for a subset of newly user registrations on a relatively small number of wikis at the moment.)

Also, it seems like this all starts from an ES search. How dynamic are the results?

It depends. The results are generated by querying hastemplate: with a set of template names. Those templates are updated, probably not daily, but maybe weekly? @MMiller_WMF might have some more insight into this but I'm not sure if we have measured this so far. In our discussions about caching, one concern has been that if we cache the query for hastemplate:Kdo?|Kdy? and a user clicks on an article only to find that there is no maintenance template attached to it anymore, that is a poor user experience. I suppose the solution would be to invalidate the cache when one of those templates is added/removed.

Don't most people have the default settings?

Yes, @MMiller_WMF or @nettrom_WMF can correct me, but I believe it's about 85% that don't touch the default difficulty level settings. This number might be different now that we have introduced topics in the filter selection options.

If so, are they each doing a dynamic ES search every time the module is displayed?

Yes.

Do 2 users looking at the page around the same time with the same preferences see the same tasks? How important is it to direct different users to different tasks? (if at all)

They should not see the same tasks; we randomize on the server-side (setting srsort=random). It is important on a product level that the users see different tasks.

Conceptually, this is a resource allocation problem: there is a pool of articles suitable as task suggestions, with some filtering criteria (task type, article topic), articles enter or exit that pool as editors add/remove maintenance tags to articles, and we want to assign mostly non-overlapping subsets of task suggestions to new users (we want to avoid two users working on the same article as existing collaboration tools don't work well for the case of two very inexperienced users), matching the filtering criteria of their choice.

We are currently handling that by using ElasticSearch to keep track of the pool in real time (we don't really care about keeping track of addition in real time, but we care about removals since we don't want to suggest articles which have just been fixed) and for doing the filtering, and rely on the random sort functionality to get mostly non-overlapping results. There would be a number of possible alternatives (we've been trying to avoid building our own queue system, but that's definitely an option), but as Kosta says, whatever we end up with we won't be able to serve the same cached result to different users.

First off, aggregating the API requests into a single one would definitely be beneficial. The extra round-trips in the current setup are very expensive because of incompressible network latency.

Yeah, we are hoping to get there. (FWIW "API request" here means ElasticSearch query, so the network requests are within the datacenter, but we make a large number of queries so it still adds up to a lot of latency.) A single ES query behaves differently from separate queries interleaved together, in ways that cause us problems (T242560, T242476, T243478), so it's not trivial.

The preloading of the next page summary is nice. I think you could afford to preload the next image as well to avoid the image flashing in, which is even more visible due to the text not doing the same. The images are fairly small, it would be a reasonable tradeoff and in the spirit of what the current UX is trying to do with preloading.

At this point on Beta the biggest cost is the initial ES request, with a TTFB of 1.3+ seconds, which suggests this is how long the backend takes to generate the response. Do you have performance monitoring for these requests coming from Suggested Edits in particular? I think it will be critical to see the distribution in production.

Currently I think that not having a spinner or progress display when waiting for the initial card is the right call. While research on this topic is inconclusive, generally speaking we know that a spinner will attract attention to the fact that some wait is happening. The more sensible consensus I've seen on that topic is to start showing a message or spinner once the user has already been waiting for some time for something that shouldn't take that long. By looking at the distribution of response times in production (ideally, collected client side) you will be able to make an informed decision about this. I.e. if you find out that it takes more than 3-4 seconds for a significant percentage of users, you might want to handle the waiting UX differently for those "long" cases, than for the majority that might have a wait under a second, where it might be counter-productive to draw attention to the waiting period.

I would suggest collecting this data client side as a custom metric. Time-to-suggested-edits, which could be for example the time difference between Element Timing of the skeleton/frame (Chrome-only for now) and Element Timing of the first card displayed (granted that it works for dynamically inserted elements, if not just use the time you insert it into the DOM). This will give you the true delta between the skeleton and the real thing, based on when things really appear on the screen, from the user's perspective.

Change 598155 had a related patch set uploaded (by Gergő Tisza; owner: Gergő Tisza):
[mediawiki/extensions/GrowthExperiments@master] Preload suggested edit card images

https://gerrit.wikimedia.org/r/598155

Change 598155 merged by jenkins-bot:
[mediawiki/extensions/GrowthExperiments@master] Preload suggested edit card images

https://gerrit.wikimedia.org/r/598155

Thanks for implementing that, I tried it out on Beta and it works as expected. What are your thoughts on performance instrumentation of this feature and the custom metric I've suggested?

Other optimisations that can be done here already have tasks. The only thing that remains for this review is making a decision about performance monitoring for this feature.

@Gilles thanks for the suggestion on the performance instrumentation. We have instrumented a few things that can be seen on this Grafana dashboard (h/t to @Krinkle for helping with this!)

  • Server-side rendering speed - timing begins when Special:Homepage is first executed, and then the timer stops after all modules have been rendered, meaning their HTML is generated, and any data required to export to the client-side has been added to the output page. The p99 value for this used to be around 100ms but now is at 600-700ms (see T258021)
  • "Time to suggested edits module" - This is a client-side metric that assess how quickly the Suggested Edits module on Special:Homepage is loaded and ready to interact with. The timer begins when initSuggestedEdits() is first called; on desktop this happens as soon as the relevant JavaScript is processed in the browser; on mobile this happens once the mobile overlay is rendered. The timer finishes when the module controls are rendered and the suggested edit card is shown to the user.

We instrumented some other parts of the pipeline (see T257371 and the patches there), the most interesting one is the time to fetch tasks via the API and this is in the dashboard as well.

Now that we have some data, we are trying to qualify how good or bad the performance is so that we can decide which actions to take (see the performance review document for the list we are considering).

While writing up my own assessment of the dashboard data for the team, I realized I am probably relying too much on my subjective interpretation of the numbers and what is acceptable/desirable. So I thought I would ask if WMF, or the Performance team in particular, have guidelines that would allow us to qualitatively assess the data we have collected so that we can correctly prioritize time and resources to put into performance improvements? Specifically -- is the server-side rendering speed too slow? Is a p75 value of ~4000ms for "time to suggested edits" too slow given that this is the main interactive component of the page? If these are numbers are too high, what is the number we should aim for?

Yes, a 4000ms p75 is very high for the main content of a page. While there is no scientific consensus on absolute thresholds, we can look at the consequences of slow performance as guidance. Google is taking performance into account more and more in order to rank pages in search results. They've recently rolled out a new set of guidelines that is based on the latest research on the subject: https://web.dev/vitals/

The initial rendering of the page is the area that has been the most researched, and based on their conservative interpretation of the scientific knowledge on the matter, you can see that they've rated anything beyond 4 seconds at the p75 as poor for Largest Contentful Paint, which would logically be the metric you would expect for the main content of the page. This also weighs down on the ranking this page is going to get on Google search results, hampering its discoverability. Google's approach on the LCP guidelines is sound (the other metrics are new and have less research to back up the 2020 thresholds), as such I think it makes sense to target p75 below 2.5 seconds for "time to suggested edits".

Note that they're going to revisit those thresholds yearly based on the latest knowledge and it's pretty obvious that they're going to be lowered, as people's expectations become greater as devices and connectivity improve over time.

I just took a look at your dashboard, which I haven't consulted in a while. I see that there were some really expensive calls in the last 24 hours:

Screenshot 2020-11-04 at 11.15.58.png (341×1 px, 71 KB)

It might be worth looking into those to see if they were coming from multiple users.

As far as I'm concerned this review is complete, you've filed tasks about the various recommendations and you have adequate performance monitoring of the feature. Thank you!

It might be useful to set up some alerts on that dashboard, to be notified about incidents like this in the feature without having to keep on eye on the dashboard regularly. We can show you how our Grafana-based alerts currently work.

It might be useful to set up some alerts on that dashboard, to be notified about incidents like this in the feature without having to keep on eye on the dashboard regularly. We can show you how our Grafana-based alerts currently work.

That would be cool, thanks. I thought we had a task for this but I think we just discussed it in a team retro. In any case, is there documentation on wikitech/mediawiki.org I could reference? Setting up a meeting time that works for our team + you might be tricky due to timezones.